“NOTICE: this is the author’s version of a work that was accepted for publication in the Book Perspectives in Fundamental and Applied Rheology. Changes resulting from the publishing process, such as peer review, editing, corrections, structural formatting, and other quality control mechanisms may not be reflected in this document. A definitive version is available in the Book Perspectives in Fundamental and Applied Rheology, Rubio-Hernández, F. J., et al. (Eds), Gráficas Fernando, 271-275, 2013.
Perspectives in Fundamental and Applied Rheology Part V: Non-Newtonian Fluid Mechanics
CHAPTER 8
Flow of Red Blood Cells in Microchannel Networks:
in vitro
studies
Diana Cidre1, Raquel O. Rodrigues1,Vera Faustino1,2, Elmano Pinto1,2, Diana Pinho2, David Bento2, Carla S. Fernandes1, Ricardo Dias1,2, Rui Lima1,2
1 ESTiG/IPB, Polytechnic Institute of Bragança, Bragança (Portugal) 2 CEFT, Faculty of Engineering, University of Porto (Portugal)
Introduction
Human blood is a multiphase biofluid primarily composed by the deformable red blood cells (RBCs) suspended in plasma. Because the complex structure of RBCs, blood exhibits unique flow characteristics on micro-scale level, due to their complex biochemical mechanisms and their response to both shear and extensional flow, which influence the rheological properties and flow behaviour of blood [1,2].
In the past years in vitro blood studies have been extensively performed and some important physiological phenomena, such as Fahraeus and Fahraeus-Lindqvist effect, were revealed [1,3]. This pioneer studies performed by Fahraeus and Fahraeus-Lindqvist in straight glass microchannels [4] revealed that for narrow tubes (diameter<300 μm), the apparent viscosity of blood declines with decreasing diameter. More recently, due to the developments in microscopy, computers and image analysis techniques, several
researchers have used new measuring methods to obtain deeper quantitative understanding of the blood flow dynamics, in vitro [5-8] and in vivo experiments [9-10]. The increasing interest by the microfluidic and biomedical communities has also played a key role in several recent developments of lab-on-chip devices for blood sampling, analysis and cell culturing, aimed in a near future, the development of blood diagnostic devices, as an alternative tool to the traditional diagnostic strategies.
However, the blood flow in microvascular networks phenomena remains incompletely understood. Thus, it is important to investigate in detail the behaviour of RBCs flow occurring in a microchannel network, such as, with divergent and convergent bifurcations, which mimics the irregular vessel segments linked by numerous diverging and converging bifurcations.
pronounced cell-free layer (CFL) immediately downstream of the apex of the convergent bifurcation [1,4]. This interesting result led us to the present work, where the CFL in a microchannel network is investigated by using a high-speed video microscopy system in order to further understand the blood flow behaviour in microvessels networks.
Experimental Work
Microchannel fabrication and geometry The microchannels fabricated for the assays have been produced in PDMS by photolithography from a photo-resist mould. The mould was fabricated by photolithographic technique on a silicon (Si) wafer with an ultra-thick photoresist (SU-8). In this process, a layer of SU-8 photoresist was spin-coated onto the Si wafer and patterned by UV exposure through a photomask. After various curing steps, a SU-8 developer was then used to obtain the final mould master containing the inverse of the desired microchannels.
Proceed to the silanization of templates for later replicate them in PDMS. The silanization process consists in a petri dish, place a drop of trichlorosilane and place it next to the SU-8 mould for 20 minutes in a flow chamber. The trichlorosilane will leave a thin film in the mould in order to protect them and help in the removal of PDMS.
The PDMS was prepared by mixing a base and curing agent at a weight ratio of 10:1 for the channels, and 20:1 for the glass slide. After removing the bubbles created during the mixing steps, the mixture was poured over the mould master and baked in the oven for about 20 min at 80°C. The PDMS is then removed from the mould, cooled to room temperature
and the input/output ports were made with an appropriate punching.
Finally, the PDMS microchannel structure was sealed with a glass slide previously spin-coated with PDMS and baked in the oven for 20 min at 80ºC. After this procedure the microfluidic device returns to the oven for further 24 hours for a strong seal.
The geometry used is complex, containing several bifurcations and confluences (see Fig. 1). Figure 1 illustrates the configuration and the most relevant dimensions of the geometry used in the study.
Figure 1. Geometry and dimensions of the microchannel in mm.
The blood samples used were collected from a healthy adult sheep, and ethylenediaminetetraacetic acid (EDTA) was added to prevent coagulation. The RBCs were separated from the blood by centrifugation and washed twice with physiological saline (PS). The washed RBCs were suspended in Dextran 40 (Dx 40) to make up the required RBCs concentration by volume. All blood samples were stored hermetically at 4ºC until the experiment was performed at an ambient temperature of about 22ºC.
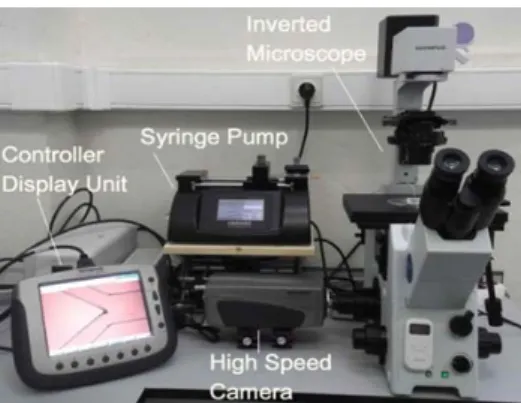
The high-speed video microscopy system used in the present study consists of an inverted microscope (IX71, Olympus) combined with a high-speed camera (i-SPEED LT, Olympus) (see Fig. 2). The PDMS microchannel was placed on the stage of the microscope where the flow rate of the working fluids was kept constant by means of a syringe pump (PHD ULTRA) with a 1 ml syringe (TERUMO ® SYRING).
Figure 2. Experimental Set-up.
The assays were conducted with 5 µl/min of flow rate and a haematocrit level of 10% (10% Htc).
All images were recorded at the centre plane of the microchannels using a rate of 60 frames/second. The recorded images were transferred to a computer and then processed and analyzed using an image processing program (Image J, 1.46r).
Results and Discussion
The results were taken in several sections of the microchannel, however the last confluence was analysed in more detail for being the last apex of the microchannel network.
Figure 3. Image of the confluence obtained after “Z Project” using average intensity function (UP) and image results from
the binarization (DOWN).
Figure 4 graphically represents the coordinates of the three CFLs obtained in the final confluence of the microchannel network, using the binary image and the “wand tracing” tool of ImageJ software.
The graphical outcome of Figure 4 shows a higher CFL in the middle zone that was resulting from the final confluence, and two slightest CFLs resulting from the other upstream confluences.
These preliminary results appear to indicate that these variances in the CFLs are derived from the differences in the confluences geometries that influences the RBCs velocities and trajectories profiles, as was shown by preview studies made by Leble and coworkers [1].
Figure 4.Coordinates of the cell-free layer (CFL) formed in the confluences.
Conclusions
In the present work, we reported an assay on microchannel network with several divergent and convergent bifurcations using a constant flow rate of red blood cells. At the last convergent bifurcation we report a total of three cell-free layers (CFLs) resulting from the complex microchannel network geometry, where the middle streamline formed around the last apex is more pronounced than the ones formed upstream.
The early results appear to indicate that this variance in the CFLs derives from the differences in the confluences geometries that influences the RBCs velocities and trajectories profiles.
Acknowledgments
References
1. Leble, V., Lima, R., Dias, R., and Fernandes, C. (2011). Biomicrofluidics 5, 044120
2. Wan, J., Forsyth, A. M., and Stone, H. A. (2011), Integr. Biol. 3, pp.972-981
3. Lima, R., Ishikawa, T., Imai, Y. and Yamaguchi, T. (2012)., Single and two-phase flows on Chemical and Biomedical Engineering, (Dias, R., Martins, A., Lima, R., and Mata, T. eds.) pp.513-547, Bentham Science Publishers
4. Fahraeus, R., Lindqvist, T. (1931). Am. J.
Physiol. 96, pp.562
5. Goldsmith, H., and Turitto, V. (1986). J. Thromb. Haemost. 55, pp.415
6. Chien, S., Usami, S., Skalak, R. (1984). In Handbook of Physiology – The cardiovascular system IV (Renkin, E. M., and Michel, C.C. eds), pp.217, American Physiological Society, Bethesda
7. Abkarian, M., Faivre, M., Horton, R., Smistrup, K., Best-Popescu, C.A., and Stone, H.A. (2008). Biomed. Mater. 3, 034011
8. Lima, R., Wada, S., Tsubota, K., and Yamaguchi, T. (2006). Meas. Sci. Technol. 17, pp.797
9. Jeong, J.H., Sugii, T., Minamiyama, M., Takeuchi, H., and Okamoto, K. (2006).Microvasc. Res. 73, pp.39