Received on 11/13/2010; reviewed on 12/06/2010; accepted on 05/11/2011; available in 10/21/2011 Corresponding authors *:
† Masters in accounting from University of São Paulo (USP).
Institution: Institute of
Administration Foundation (FIA).
Address: Rua Cisplatina,
no. 871, Apt. 31 São Paulo/SP/ CEP: 04211-040. E-mail:[email protected] Telephone: (11) 2215-0661 Ω Postdoctoral degree in
finance from Columbia University (CUNY).
Institution: University of
(USP).
Address: Av. Prof. Luciano Gualberto, 908 – sala G 168. Cidade Universitária, SP – São Paulo, CEP: 05508-010. E-mail: [email protected] Telephone: (11) 3818-4023 ¥ Doctorate of business administration from University of São Paulo (USP).
Institution: Fundação Getúlio Vargas (EAESP-FGV).
Address: R. Itapeva, 474
– Bela Vista, SP- São Paulo. CEP: 01332-000. Email:mr.mendesdasilva @gmail.com Telephone: (11) 2615-4705 £ Postdoctoral degree in applied statistics from University of São Paulo (USP).
Institution: São Paulo
Federal University (UNIFESP).
Address: Rua Oliveira
Melo, 104 São Paulo/SP/ CEP: 04271-000.
E-mail:[email protected] Telephone: (11)
3596-3335
F Doutor em Administração University of São Paulo (USP). Institution: Mackenzie Presbyterian University. Address: Rua da Consolação, 930 – SP/São Paulo – CEP: 01302-907. E-mail: [email protected] Telephone: (11) 3596-3335
Note from the Editor: This article was accepted by Antonio Lopo Martinez.
Analysis of co-movements between the capital markets in Brazil and the
United States
Daniel Reed Bergmann†
Fundação Instituto de Administração (FIA)
José Roberto Ferreira SavoiaΩΩΩΩ
Universidade de São Paulo (USP)
Wesley Mendes-da-Silva¥
Fundação Getúlio Vargas (EAESP-FGV)
Mauri Aparecido de Oliveira£
Universidade Federal de São Paulo (UNIFESP)
Wilson Toshiro NakamuraΦΦΦΦ
Universidade Presbiteriana Mackenzie
ABSTRACT: In this article copula theory is used to analyze the co-movements between the
Brazilian and American capital markets. To formulate an effective asset allocation strategy, it is important to understand extreme events – both positive (booms) and negative (crashes) – and their effects on markets. The market indexes used are the Ibovespa and the S&P 500, covering the period from March 2001 to April 2007. We tested the adherence to the log-returns of the main copulas found in the financial literature, using the following criteria: log-likelihood, Akaike information criterion and Bayesian information criterion. The results show that the symmetrized Joe-Clayton copula is most suitable to model the dependence structure between the log-returns of the Ibovespa and the S&P500. This work differs from some previous ones (e.g., Mendes & Moretti, 2005 and Canela & Collazo, 2005) because we take into account the modeling of dynamic copulas, as introduced by Patton (2006). Finally, from the tail-dependence indexes over time, it can be concluded that the occurrence of crashes in the American market tends to affect the Brazilian market more than does the occurrence of booms.
1. INTRODUCTION
According to Sun, Rachev & Fabozzi (2006), the co-movements of international stock markets are often utilized as a barometer of globalization and financial integration. The analysis of such co-movements is important for the risk diversification and formation of international portfolios. The origin of co-movement between stock markets rests in the volatility-in-correlation effect found by Andersen et al. (2001), in the returns of individual stocks, and by Solnik, Boucrelie & Le (1996) in index returns. In fact, the volatility-in-correlation effect can be explained by the dependence of the tails of the respective assets, which exhibit simultaneous extreme events. The co-movement, volatility in correlation and tail dependence of distributions are related, as shown by analysis of the dependence structure of international stock markets. It has also been found that the correlations between consecutive returns decay gradually, that is, there is evidence of long-term dependence of returns.
According to Mendes & Moretti (2005), co-movement reflects the inter-correlations between the respective returns of assets (or returns in different markets) and long-term dependence shows the autocorrelation in relation to the return of a single asset (or of a single market). Therefore, when international stock markets are analyzed, there are two dependence structures that operate: correlation in relation to a single market and correlation between multiple markets.
According to Genest (2009), correlation is a broad concept in the areas of finance and insurance, used as a measure of the linear dependence between random variables. However, this term is often used incorrectly to mean any notion of dependence. Correlation is a very specific measure of dependence, among many others. In the world of elliptical distributions (e.g., the multivariate normal distribution or multivariate t-distribution), it is an acceptable metric. Since financial and risk management theories use the dependence structure of assets, it is important to introduce an alternative measure that overcomes the limitation of correlation coefficients. For this purpose, here we use the method of copulas, which was first utilized by Sklar (1959). He proved that a collection of marginal distributions can be grouped together through a copula to form a multivariate distribution from them.
According to Morettin & Toloi (2004, p. 10), Cont (2001, p. 224) and Pagan (1996, p. 18-21), the main stylized facts of financial returns are:
• The autocorrelation function of the squared returns decays slowly;
• Probability distributions of returns have heavier tails than a normal distribution;
• The series of log-returns presents clusters of volatility over time.
According to Cherubini, Luciano & Vecchiato (2004), copula theory can be used in finance and econometrics to deal with two questions related to the stylized facts stated above:
• The returns of financial assets are not normally distributed (existence of asymmetry and/or heavy tails in the probability distributions); and
• The dependence between the returns of financial assets is nonlinear.
Basically a copula can be defined as a function that couples univariate marginal distributions to form a multivariate distribution. For this purpose, it is necessary to define a dependence function between the variables. Copulas permit creating multivariate distributions that have marginals with different distributions. This is of great value in this work since some financial series can present asymmetry and kurtosis of varying degrees (Pagan, 1996; Morettin & Toloi, 2004).
Although the concept of copulas arose over 50 years ago with Sklar (1959), their applications in finance and economics only started to be published in 1999. According to Genest (2009, p. 3), 41% of the publications related to the theme of copulas are related to the financial area. He grouped the studies into four areas, as follows:
1. Risk management: Developments in this area have been spurred by the Basel
II Agreement and by the academic contributions of Embrechts, McNeil & Strausmann (1999) and Li (2000).
2. Portfolio management: Many works of this type investigate the dependence
between financial markets in different countries, such as that of Patton (2006).
3. Pricing of derivatives: The works in this area deal with exotic options, credit
swaps, etc. Details can be found in Cherubini, Luciano & Vecchiato (2004).
4. Risk measurement: The themes in this group refer to value-at-risk (VaR),
contagion between markets and expected shortfall. The work of Rodrigues (2005) proposes an application of copulas to the subject of contagion, for example.
2. RESEARCH QUESTION
According to Cherubini, Luciano & Vecchiato (2004) and Rachev, Menn & Fabozzi (2005), when at least one marginal distribution (of a determined asset) is not normal, the traditional correlation measure of Pearson is inadequate because it only captures the linear dependence between them. Since the returns of financial assets are typically not normally distributed and have nonlinear dependence, it is more prudent to use a more robust measure of their association. The measure that has been shown to be particularly suitable in modeling copulas is Kendall’s τ.
In this work, we consider two stock market indexes, the Ibovespa and S&P 500, to analyze the dependence between the Brazilian and American markets by means of copulas. According to Cherubini, Luciano & Vecchiato (2004, pp. 112-120), there are various types of copulas, both conditional and unconditional, that can be utilized for dependence modeling (e.g., normal copula, Student-t copula Gumbel copula).
For portfolio managers to carry out their international asset allocation strategies, it is important first to evaluate the probability of the occurrence of extreme events with negative repercussion in the markets under analysis (Canela & Collazo, 2005).
Here we investigate which of the two types of extreme events – positive (boom) or negative (crash) – occurring in the American stock market can affect the Brazilian market more. To answer this question, we employ the theory of copulas and measure the dependence structure by Kendall’s τ and by the dependence indexes in the tails.
We start by describing the types of copulas existing in the finance literature and classify them according to their statistical adherence. In the same way as Patton (2006), Canela & Collazo (2005) and Breymann, Dias & Embrechts (2003), we measure that adherence by means of the econometric concepts of log-likelihood, the Akaike information criterion (AIC) and the Bayesian information criterion (BIC).
This work makes a valuable contribution to the finance literature because it shows the possibility of using an indicator that can capture on a daily basis the impact of extreme events in markets (this indicator is the tail index of the copulas). That possibility is restricted to a specific class of copulas (symmetrized Joe-Clayton copulas). Thus, in the context of a financial crisis, this approach is important.
3. METHODOLOGY
We apply a sequence of quantitative procedures to the series of log-returns of the Bovespa and S&P 500. They are:
1. We first find the nonparametric univariate distribution of the log-returns. This procedure was also applied by Patton (2006) to exchange rate series.
2. With the marginal distributions determined, we choose which family of copula functions best represents the particular dependence between each pair of series.
3. With the distributions and copula defined, we estimate the model parameters. These parameters refer both to the marginal distributions and the copula function to be employed. According to the LL, AIC and BIC criteria, we select the copula whose fit is most significant from a statistical standpoint.
4. Finally, we calculate the tail indexes to verify the impacts of extreme events on the two financial markets in question.
A copula is a function that relates two of more marginal distributions in order to construct a joint distribution. By means of various copulas, we try to represent the exact dependence structure between the variables studied, to enable separating the dependence structure in a joint distribution and the marginal behavior of each of these variables.
The main theorem that underpins copula theory was developed by Sklar (1959) and defines the relation between copulas and functions of randomly distributed variables. The above result implies the possibility of expressing a multivariate distribution through its marginal distributions. Since a copula can capture various dependence structures between series even when the marginal distributions are not of the same family, the use of this type of function in modeling is extremely useful in a multivariate setting where the variables have some form of mutual dependence.
According to Rachev, Menn & Fabozzi (2005, p. 73), a copula C is a probability distribution function (p.d.f.) on the d-dimensional hypercube:
[ ] [ ]
0,1 0,1 ...[ ]
0,1 d I = × × × :[ ]
: d 0,1 C I →(
x1,...,xd)
→C x(
1,...,xd)
Sklar (1959) showed that any multivariate p.d.f. F of any random vector Y
(
1,..., d)
Y = Y Y can be represented by a copula function C in the following form:
(
)
(
)
(
(
)
(
)
)
( )
( )
(
1)
1 1 1 1 1 1 ,..., ,..., ,..., ,..., d Y d d d d d Y Y d F y y P Y y Y y C P Y y P Y y C F y F y = ≤ ≤ = ≤ ≤ = where i YF , i = 1,...,d denotes the marginal distribution functions of the random variables , 1,...,
i
Y i= d .
In this case, we use copulas as a way to represent the dependence between the two markets and their risk factors, while preserving the marginal distribution specification of each market. According to Cherubini, Luciano & Vecchiato (2004, p. 41), the representation of the co-movements in a setting where the distributions of the returns are not normal poses some problems that can be new for some financial academics or practitioners.
A limitation of the use of copulas to evaluate the co-movements of financial markets is to extrapolate the results over a long horizon.
Below we present the bivariate copulas used in this work. All the definitions below can be found in Cherubini, Luciano & Vecchiato (2004, pp. 112-128).
3.1 BIVARIATE GAUSSIAN COPULA
It is extracted from the multivariate normal distribution. However, if one or more of the marginal distributions is not Gaussian, the resulting joint distribution will be different. This type of copula does not permit extreme dependence in either of its tails, so it is a symmetric copula.
The Gaussian copula is defined as follows:
( )
(
1( )
1( )
)
, ,
Ga
XY
C v z = Φρ Φ− v Φ− z
where ΦρXY is the joint distribution function of a bivariate standard normal vector, with linear
correlation coefficient XYρ and Φ is the standard normal distribution function. Therefore,
ΦρXY Φ −1 v
( )
,Φ−1( )
z(
)
= 1 2π
1−ρ
2XY −∞ Φ−1 z ( )∫
−∞ Φ−1 v ( )∫
exp 2ρ
XYst−s 2−t2 2 1(
−ρ
2XY)
dsdt (1)Since expression (1) is parametrized by the linear correlation coefficient, one can also write CρGa. The representation shown below, demonstrated by Roncalli (2001), is equivalent to expression (1):
( )
, 0 1( )
2 1( )
1 v XY Ga XY z t C v zρ
dtρ
− − Φ − Φ = Φ − ∫
(2) The conditional version of (2) can be expressed by:( )
1( )
1( )
21 , 2 1 XY Ga XY z v C v zρ
ρ
− − Φ − Φ = Φ − (3)The Gaussian copula generates a multivariate normal distribution if the margins (marginal distributions) are standard normal (Sklar, 1959).
3.2 BIVARIATE STUDENT-T COPULA
In turn, this copula is extracted from the multivariate Student-t distribution. It differs from the normal copula by permitting some degree of extreme dependence in the distribution’s tails. However, it has the common characteristic of being symmetric, i.e., there must be the same degree of dependence in both tails.
Let tυ:ℜ → ℜ be a univariate Student-t distribution function with
υ
degrees of freedom:( )
(
(
(
)
)
)
1 2 2 1 / 2 1 / 2 x s t x ds υ υυ
υ
πυ υ
+ − −∞ Γ + = + Γ ∫
(4) where Γ(.) is the Gamma function. Then ρ∈I and tρ υ, define the bivariate distribution function corresponding to tυ:( )
(
)
2 2 2 2 , 2 2 1 2 , 1 1 2 1 x y s t st t x y dsdt υ ρ υρ
υ
ρ
π
ρ
+ − −∞ −∞ + − = + − − ∫ ∫
(5)The conditional version of (5) can be expressed by:
( )
( )
( )
( )
1 1 21 1 2 2 1 , 1 S t z t v C v z t υ υ υρ
υ
υ
υ
ρ
− − − + − = Φ + − (6)3.3 PLACKETT COPULAS
The Plackett family of copulas is given by:
( )
(
)(
)
(
(
)
)(
)
(
)
2 1 1 1 1 4 1 , 2 1 u v u v uv Cθ u vθ
θ
θ θ
θ
+ − + − + − + − − = − (7)For θ =1, then C u v1
( )
, =uv, which is the well-known product copula. It is used when there are two independent random variables.3.4 GUMBEL COPULA
According to Gumbel (1960), this copula is given by:
( )
( )
1( )
1 , exp ln 1/ ln 1/ , [1, [ C u v u v θ θ θ θ = − + θ∈ +∞ (8) 3.5 FRANK COPULAAccording to Frank (1979), this copula is given by:
( )
1(
exp(
)
1 exp( )
)
(
(
)
1)
, ln 1 , 0 exp 1 u u Cθ u vθ
θ
θ
θ
θ
− − − − = − + ≠ − − (9) 3.6 CLAYTON COPULAAccording to Clayton (1978), this copula is given by:
( )
(
)
1, 1 , >0
Cθ u v = u−θ +v−θ − − θ θ (10) 3.7 ROTATED GUMBEL COPULA
Rotation permits the copula to exhibit dependence in the lower tail, while without rotation (4.4) it only exhibits dependence in the upper tail. The distribution function in this case is given by:
(
1)
(
(
1)
(
(
)
)
)
1 1 ,..., 1 exp ln 1 ... ln 1 N n j N j C u u u n u u α α α = = − + + − − − + + − − ∑
(11)3.8 SYMMETRIZED JOE-CLAYTON COPULA
Patton (2006) employed a modified form of the Joe-Clayton copula to model the movement of exchange rates. The Joe-Clayton copula is given by:
(
)
{
(
)
(
)
}
1 1 , , 1 1 1 1 1 1 JC U L C u v u v κ γ γ γ κ κτ τ
= − − − − + − − − − − (12) Where:(
)
( )
( )
( )
2 2 1 log 2 1 log 0,1 , 0,1 U L U Lκ
τ
γ
τ
τ
τ
= − = − ∈ ∈This copula has two parameters,
τ
U andτ
L, which allow modeling the dependence in the upper and lower tail, respectively (Patton, 2006). The Joe-Clayton copula also has slight asymmetry whenτ
U =τ
L. That fact is not suitable for financial settings. To overcome this problem, it is necessary to modify the copula’s form, so that it becomes the symmetrized Joe-Clayton copula, given by:(
, ,)
0, 5(
, ,)
0, 5(
1 ,1 ,)
1SJC U L JC U L JC L U
C u vτ τ = C u vτ τ + C −u −vτ τ + + −u v (13) It is symmetric when τU =τL.
3.9 DYNAMIC OR CONDITIONAL COPULA
For the bivariate case, Patton (2006) extended the standard copula definition to the conditional case. For this purpose, he considered the heteroskedasticity pattern, widely used in the financial literature, for the volatility of any financial return. Besides this, there are many situations where it is necessary to have generalized joint conditional density to study the pricing of financial options with multiple underlying assets, or to calculate the VaR of an asset portfolio.
Patton (2006), in modeling marginal distributions, assumes that the conditional measures evolve according to an autoregressive process, and that the conditional variances evolve according to a GARCH(1,1) process. Likewise, the evolution of C should also be t
considered. One may consider only the case in which the parameters are variant in time (i.e., only the functional form of the conditional copula remains fixed) or cases where variations occur both in the functional form of the copula and in its parameters. Our modeling of the conditional copulas follows the same assumptions as in Patton (2006).
Nelsen (1999) showed that any convex linear combination of copulas also is a copula, and thus a functional form varying in time of the conditional copula could be a convex sum of
4. MEASURES OF DEPENDENCE
There are a number of concepts about association. In this section, we present some of these concepts. Among the measures of association most utilized are concordance (as distinct from dependence), linear correlation, tail dependence and positive quadrant dependence. Some measures associated with these are Kendall’s τ, Spearman’s correlation coefficient (ρ), linear correlation coefficients and tail dependence indexes.
All these measures are related to the properties of copulas, since by coupling a distribution function with its marginals, the copula “captures certain (…) aspects of the relationship between the variates, from which it follows that the concepts of positive dependence are properties of the copulas” (Nelsen, 1999).
This study has the limitation of using only one measure to assess the co-movements of the assets. Other studies can be carried out considering other statistical theories (e.g., extreme values theory).
4.1. TAIL DEPENDENCE
Tail dependence measures are utilized to capture the dependence in the tail of the bivariate distribution. They serve to describe how large (or small) values of one random variable accompany large (or small) values of another random variable.
Let X and Y be continuous random variables with distribution functions F and G, respectively. The dependence parameter of the upper tail
λ
U is the limit (if it exists) of the conditional probability that Y is greater than the 100t-th percentile of G, given that X is greater than the 100t-th percentile of F when t approaches 1 from the left, that is:( )1
( )
( )1( )
1 lim U t P Y G t X F tλ
− − − → = > > (14) Likewise, the dependence parameter of the lower tailλ
L is the limit (if it exists) of the conditional probability that Y is smaller than the 100t-th percentile of G given that X is less than or equal to the 100t-th percentile of F as t approaches 0 from the right, that is:( )1
( )
( )1( )
0 lim L t P Y G t X F tλ
+ − − → = ≤ ≤ (15) These parameters are nonparametric and depend only on the copula formed by X and Y.5. ANALYSIS OF THE RESULTS
Let us suppose that the true copula belongs to a determined parametric family C =
{
Cθ,θ
∈Θ}
, with certain mathematical properties. Then the estimates, θ, obtained by the likelihood method (LM) via optimization of the likelihood of each copula are consistent and have a normal distribution.According to Roncalli (2001), the CML (Canonical Maximum Likelihood) method estimates the association of the parameters θ of the copula without assuming any parametric form for the marginal distributions of the returns (here of the Ibovespa and S&P 500). Therefore, we have an advantage in that we do not need to specify these marginal distributions, and thus the approach chosen is robust and free of the specification errors related to marginal distributions. All the algorithms were developed with the MATLAB®
software.
We selected 2044 log-return values from the Ibovespa and the S&P 500 index, starting on January 3, 2001 and ending on December 31, 2007, as shown in the following figures.
(a) (b)
Figure-1 (a) Series of the log-returns of the Ibovespa, (b) Series of the log-returns of the S&P 500. Source: Economática database
We estimated the parameters by the CML of the following copulas: Gaussian (GC), Clayton (CC), Plackett (PC), Frank (FC), Gumbel (GUC), rotated Gumbel (RGUC), Student-t (SC), symmetrized Joe-Clayton (SJCC), time-varying Gaussian (GCt), rotated time-varying Gumbel (RGUCt), and time-varying symmetrized Joe-Clayton (SJCCt).
Just as Patton (2006), Canela & Collazo (2005) and Breymann, Menn & Embrechts (2003), we created an adherence hierarchy through the econometric concepts of log-likelihood (LL), the Akaike information criterion (AIC) and the Bayesian information criterion (BIC). The results are shown below.
-8 -6 -4 -2 0 2 4 6 Observations -4 -3 -2 -1 0 1 2 3 Observations
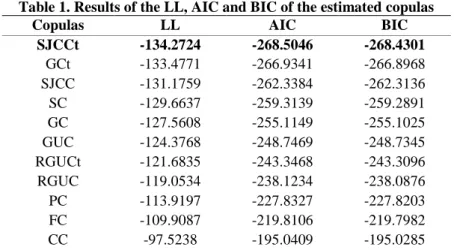
Table 1. Results of the LL, AIC and BIC of the estimated copulas
Copulas LL AIC BIC
SJCCt -134.2724 -268.5046 -268.4301 GCt -133.4771 -266.9341 -266.8968 SJCC -131.1759 -262.3384 -262.3136 SC -129.6637 -259.3139 -259.2891 GC -127.5608 -255.1149 -255.1025 GUC -124.3768 -248.7469 -248.7345 RGUCt -121.6835 -243.3468 -243.3096 RGUC -119.0534 -238.1234 -238.0876 PC -113.9197 -227.8327 -227.8203 FC -109.9087 -219.8106 -219.7982 CC -97.5238 -195.0409 -195.0285
Source: Prepared by the authors.
Table 1 shows that the dynamic copulas adhere better to the returns. The criteria utilized indicate that the most suitable copula to model the dependence structure of the log-returns of the Ibovespa and S&P 500 is the time-varying symmetrized Joe-Clayton copula. Patton (2006) reached the same conclusion regarding the symmetrized Joe-Clayton copula with the parameters varying in time to model variations in exchange rates.
We used the nonparametric Wilcoxon test (rank sum) for independent samples, through the MATLAB® software, to check for significant differences between the two series
of tails shown above. The test revealed a p-value equal to 0.000, so we should not accept the null hypothesis that the medians of the two series are equal at significance of 5%. Moreover, the series related to the lower tail is much more informative than that represented by the values of the upper tail, because its volatility is much more apparent. There was a strong negative conditional correlation between the series during 2007 (the year before the financial crisis hit). Given there were significant differences between the medians of the two series of tails (lower and upper), we utilized static dependence indexes on the tails related to the symmetrized Joe-Clayton copula to respond to the research question. The results are shown in Table 2.
Table 2. Results obtained for the indexes
λ
L and
λ
U in relation to the unconditional copulas. Copulas Lλ
λ
U GC 0 0 CC 0.6448 0 PC 0 0 FC 0 0 GUC 0 0.6148 RGUC 0.608 0 SC 0.2757 0.2757 SJCC 0.605 0.5548The dependence in the lower (or upper) tail of the multivariate distribution of the random variables is captured by the measures of extreme correlation, called lower lambda,
λ
L (or upper lambda,λ
U). This makes it possible to measure whether the extreme positive (or negative) values of a determined random variable (e.g., stock index) is accompanied by an extreme positive (or negative) value of another random variable through the upper (or lower) lambda. Ifλ
L is greater thanλU
, it can be said that the negative shocks in a determined market have much more effect on the other market analyzed than do positive shocks, and vice versa. Table 2 shows that the occurrence of extreme negative events, or crashes, in the American market, tends to have a greater effect on the Brazilian market than extreme positive events, or booms, sinceλ
L(0.6055)>
λU
(0.5548).6. CONCLUSION
The ability of copulas to capture the dependence in the tails is fundamental for the study of the co-movement of financial markets. For example, it can permit verification of the simultaneous occurrence of booms or crashes in two markets, and the intensity of the effect. For portfolio managers to carry out their international asset allocation strategies, it is important for them to assess the probability of the occurrence of extreme events with negative repercussion (lower tail) in the markets under consideration (Canela & Collazo, 2005). Through the indexes of tail dependence over time investigated here, it is possible to conclude that crashes in the American market tend to have a greater effect on the Brazilian market than do booms in the American market.
Future studies can be undertaken utilizing the lower tail index determined by the symmetrized Joe-Clayton copula to measure the risk of moments of economic crisis or large shocks that negatively impact markets. We believe that investigation of the behavior of the lower tail index over time can capture significant dependence relationships between markets, to help investors make more informed asset allocation decisions.
REFERENCES
ANDERSEN, T.G.; BOLLERSLEV, T.; DIEBOLD, F. X.; EBENS, H. The distribution of realized stock return volatility. Journal of Financial Economics, v. 61, pp. 43-76, 2001. ANDRADE, M. M. Como Preparar Trabalhos para Cursos de Pós-Graduação. São Paulo: Atlas, 1999.
BREYMANN, W.; DIAS, A.; EMBRECHTS, P. Dependence Structures for Multivariate High-Frequency Data in Finance. Quantitative Finance, v. 3, pp. 1-14, 2003.
CANELA, M. A.; COLLAZO, E. P. Modelling Dependence in Latin American Markets
using Copula Functions. Working Paper, 2005.
CHERUBINI, U.; LUCIANO, E.; VECCHIATO, W. Copula Methods in Finance. London: John Wiley & Sons Inc., 2004. 293p.
CLAYTON, L.G. A model for association in bivariate life tables and its application in
epidemiological studies of familial tendency in chronic disease incidence. Biometrika, v. 65, pp. 141-151, 1978.
CONT, R. Empirical Properties of Asset Returns: Stylized Facts and Statistical Issues.
Quantitative Finance, v. 2, pp. 223-36, 2001.
EMBRECHTS, P.; MCNEIL, A. J.; STRAUSMANN, D. Correlation: Pitfalls and Alternatives. Risk Magazine, 12, no. 5, pp. 69-71, 1999.
FRANK, M. J. On the simultaneous associativity of F(x,y) and x + y – F(x,y). Aequationes
Mathematics, v.19, pp. 194-226, 1979.
GENEST, C.; GENDRON, M.; BORDEAU-BRIEN, M. The Advent of Copulas in Finance.
The European Journal of Finance, v. 00, pp. 1-10, 2009.
GUMBEL, E. J. Bivariate Exponential Distributions. Journal of American Statistical
Association, v. 55, pp. 698-707, 1960.
LEHMANN, E. Some concepts of dependence. Annals of Mathematical Statistics, v. 37, pp. 1137-1153, 1966.
LI, D. X. On default correlation: A copula function approach. Journal of Fixed Income, v. 9, pp. 43-54, 2000.
MENDES, B. V. M.; MORETTI, A. R. Medindo a Influência do Mercado Americano nas Interdependencias observadas na América Latina. Revista Brasileira de Finanças, v. 3, n. 1, pp. 15-29, 2005.
MORETTIN, P. A.; TOLOI, C. M. C. Análise de Séries Temporais. São Paulo: Edgard Blucher, 2004.
NELSEN, R. B. An Introduction to Copulas. New York: Springer-Verlag, 1999.
PAGAN, A. The Econometrics of Financial Markets. Journal of Empirical Finance, v. 3, pp. 15-102, 1996.
PATTON, A. Modelling Asymmetric Exchange Rate Dependence. International Economic
Review, v. 47, n. 2, pp. 527-556, 2006.
RACHEV, S.; MENN, C.; FABOZZI, F. J. Fat-Tailed and Skewed Asset Return
Distributions. New Jersey: John Wiley & Sons Inc., 2005. 369p.
RODRIGUEZ, J. C. Measuring Financial Contagion: A Copula Approach. Journal of
Empirical Finance, v. 14, 2007
RONCALLI, T. Copulas: A Tool for Dependence in Finance. Working Paper, 2001. SCARSINI, M. On measures on concordance. Stochastica, v. 8, pp. 201-218, 1984. SKLAR, A. Fonctions dé repartition à n dimensions et leurs marges. Publications de l´
Institut Statistique de l´ Université de Paris 8, pp. 229-231, 1959.
SOLNIK, B.; BOUCRELlE, C.; LE, Y. F. International Market Correlation and Volatility.
SUN, W.; RACHEV, S.; FABOZZI, F. Unconditional Copula-Based Simulation of Tail
Dependence for Co-Movement of International Equity Markets. Germany: Technical