Creating Customer Loyalty through Service Customization
Pedro S. Coelho (ISEGI – New University of Lisbon, Lisbon, Portugal)
Jörg Henseler (Institute for Management Research, Radboud University Nijmegen, Nijmegen, The Netherlands)
This is the peer-reviewed version of the article published by EMERALD as:
Coelho, P. S., & Henseler, J. (2012). Creating customer loyalty through service customization. European Journal Of Marketing, 46(3-4),
331-356. https://doi.org/10.1108/03090561211202503
This work is licensed under a Creative Commons Attribution-NonCommercial 4.0 International License.
REVIEW ARTICLE
Creating Customer Loyalty through Service Customization
Purpose
Although practitioners and scholars alike embrace service customization as a possibly powerful management instrument, its impact on customer relationships as well as contingencies for its effective application are not well understood. Drawing from relationship marketing and exchange theory, we develop a model of customer relationship outcomes of service customization and the efficacy of service customization.
Methodology
We conduct two large-scale, representative, cross-sectional studies in different service industries based on the European Customer Satisfaction Index framework, and apply PLS path modeling to test our model.
Findings
Customization increases perceived service quality, customer satisfaction, customer trust, and ultimately customer loyalty toward a service provider. Customization has both direct and mediated effects on customer loyalty and interacts with the effects of customer satisfaction and customer trust on loyalty.
Research implications
Service customization is a viable instrument for relationship marketing. Its efficacy depends on customer satisfaction and customer trust. While this study solely focuses on the impact of service customization, future research could assess the relative importance of service customization in the presence of other relationship marketing instruments.
Practical implications
Service providers can use service customization as an effective instrument for achieving not only higher customer satisfaction, but also higher customer loyalty. Service customization is most effective for companies that have deficits in satisfying their customers, while at the same time their customer relationships are
characterized by a high level of trust. These results help managers to decide upon resource allocation to enhance customer satisfaction, trust and loyalty.
Originality
This paper investigates the simultaneous effects of service customization on customer loyalty and other relationships variables and offers new insights relatively to the nature and size of customization effects. It fills an important gap in the knowledge of customization outcomes, and clarifies under which circumstances service customization is most effective. The paper is of great value for service providers that face the decision whether to customize their offering or not.
Creating Customer Loyalty through Service Customization
Introduction
Over the past decades, there has been a growing recognition among scholars and practitioners that product and service differentiation represents a source of competitive advantage. The core idea of differentiation is to identify profitable market segments and to design products and services to optimally satisfy the needs of the target segments. As a more extreme form of differentiation, the concept of customization – that means the degree to which the firm's offering is tailored to meet heterogeneous customers' needs (Anderson, Fornell, & Rust, 1997) – has faced increasing popularity among firms (Kara & Kaynak, 1997). Customization aims at satisfying as many needs as possible for each individual customer, in contrast to conventional techniques, which try to reach as many customers as possible while satisfying a rather limited number of customer needs (Simonson, 2005; Fiore, Lee, & Kunz, 2004). Kotler (1989) and Pine (1993), among others, regard customization as an answer to the shifting nature of customer demand for greater variety, more features, and higher quality in products as well as services. Driven by its expected benefits, customization has become a cornerstone of customer relationship management (Freeland, 2003; Lemon, White, & Winer, 2002). Clearly the developments in computing power and the dissemination of the Internet have offered new opportunities to marketers to customize offerings to ever demanding customers. Many researchers expect that corporate investment in customization technologies will continue to surge in the future (Gardyn, 2001; Kim, Lee, Shaw, Chang, & Nelson, 2001; Rust & Lemon, 2001). This trend goes along with companies’ strong need for information on the nature and extent of demand for service customization (Liechty, Ramaswamy, & Cohen, 2001).
Given the organizational efforts involved in customization strategies, it is striking that the expected positive outcomes to be achieved by using customization are rather assumed or taken for granted than empirically validated. Many companies follow a customization strategy with the objective of establishing a competitive advantage (Huffman & Kahn, 1998). Still, empirical evidence for competitive advantages and company growth through customization (e.g., Aijo, 1996; Kotha, 1995) is rather anecdotal in nature. Moreover, the literature provides only little evidence that offering customized products does in fact lead to superior returns (Kotha, 1995). Simonson (2005, p. 32) questions whether the fundamental assumptions underlying the customization concept for satisfying individual customer preferences actually hold – “customers may not have well-defined preferences to be revealed, and they may fail to appreciate customized offers that fit their measured preferences.” Murthy and Sarkar (2003, p. 1350) remark that they “found no research on empirical validation of the assumptions or the results of analytical models providing substantial opportunities for researchers.” So far, the predominant logic for using customization as a marketing instrument lies in its added benefit or value to the customer. Yet, customization does not automatically imply a benefit for the customer. Hart (1995) asserts that customers’ demand for customized products and services may vary or even be non-existent – that is consumers do not regard customization as beneficial for them, or they associate it with high efforts. The benefits of customization may well be outweighed by the monetary and non-monetary costs that a customer encounters, such as the increased price of customized products, the delay in receipt of custom-made products, and the need for customers to invest time in specifying their preferences before the service can be brought (Bardakci & Whitelock, 2003, 2004; Huffman & Kahn, 1998).
The ambiguity in the current knowledge on customization outcomes is highly unsatisfactory. Understanding the consequences of customization is particularly crucial for service firms. The chances for service firms resulting from customization have well been recognized, as “[s]ervice firms have .. been at the forefront of
customer-centric marketing due to their greater ability to customize their offerings” (Sheth, Sisodia, & Sharma, 2000, p. 64). In order to make use of service firms’ customization abilities and to make deliberate decisions on customization strategies, it is indispensable that service firms are familiar with the effects that customization has on customer-firm relationships. More specifically, “it is important to examine the impact of practicing customization on the customer’s commitment to and long-term relationships with marketers” (Simonson, 2005, p. 42). In the light of the prominent role of customization among customer relationship management tactics (Gordon, McKeage, & Fox, 1998), the questions that arise are whether, and if so, in what manner customization influences focal relationship marketing variables? Our present research addresses these questions and examines how customization affects customer-firm relationships from a customer perspective. Drawing from relationship marketing theory, we develop a parsimonious, theoretically grounded model that describes how customization influences customer loyalty toward a service provider. We test our model by means of a large-scale empirical study in two service industries (banking and cable TV) within a Western European country.
Our paper delivers three important contributions to the marketing and service management literature. Firstly, we provide empirical support for several favourable relationship outcomes of customization: perceived quality, customer satisfaction, customer trust, and ultimately customer loyalty. Secondly, by means of quantifying the direct and indirect effects of customization, we enable researchers and managers to compare the efficacy of service customization with that of other relationship marketing instruments. Thirdly, we demonstrate that the effects of service customization on customer loyalty are contingent on relationship quality, i.e. the joint levels of customer satisfaction and trust. Overall, this paper provides assistance for managers of service firms in making a reasoned decision on the customization strategy – whether to customize the service offering at all, and if so, to what extent.
The paper is organized as follows. The next section analyzes the extant literature on customization and develops a framework of customization outcomes, deriving the focal hypotheses of this research. The subsequent section describes the research design. The fourth section presents the main results obtained in the study. The fifth section provides a discussion on the main findings and highlights the theoretical and managerial implications. The final section identifies possible limitations and addresses avenues for further research.
Literature Review and Hypothesis Development
Current scientific knowledge on the outcomes of service customization is scarce and mixed. One reason for this may be that scholars have mainly devoted their attention to customization from a supply side perspective (mostly in the form of mass customization, see for instance Pine, 1993). Until now, few studies have investigated the mechanism by which customization influences consumers’ decision processes (Tam & Ho, 2005). Some early empirical evidence for a positive influence of customization on customer relationships stems from research based on the American Customer Satisfaction Index model (Fornell, Johnson, Anderson, Cha, & Bryant, 1996): one quality indicator measuring the “[e]valuation of customization experience, or how well the product fit the customer's personal requirements (postpurchase)” plays an outstanding role when predicting customer satisfaction. Similarly, Ostrom and Iacobucci (1995) find that service customization contributes to the formation of customer satisfaction, although its impact is somewhat lower than that of service quality. Ball, Coelho, and Vilares (2006) confirm the predictive validity of the personalization construct in a relationship marketing context, since personalization contributes to the explanation of customer satisfaction and ultimately customer loyalty. However, whilst conventional wisdom tells us that personalized service is better service, based on empirical findings Surprenant and Solomon (1987, p. 94) conclude that “all forms of personalization do not necessarily result in more positive evaluations of the service offering by consumers.”
Theoretical background and hypotheses
The hypotheses will be developed in two steps. In a first step, we lay the theoretical basis for hypotheses on the influence of service customization on the focal relationship marketing constructs: service quality, customer satisfaction, customer trust, and customer loyalty. In a second step, we provide the theoretical grounding for the interaction effects of service customization.
Basically, there are two explanations for a relationship between service customization and service quality. Firstly, customization can signal high quality (Ostrom & Iacobucci, 1995), i.e. customization plays the role of a quality endorser. Secondly, customization is a driver of service quality. The idea of service customization underlies several of the original ten determinants of service quality (Parasuraman, Zeithaml, & Berry, 1985). There is also empirical support for the notion that customization in the service delivery process is a dimension of service quality (Ennew & Binks, 1996). An effect from customization to quality can thus be expected to emerge:
H1: Higher service customization leads to a higher perceived quality.
Customers expect and demand customization in service encounters (Bettencourt & Gwinner, 1996; Bitner, Booms, & Tetreault, 1990). Customized offers are likely to satisfy a customer more than standardized offers would, because they facilitate a real match between customer and product (Ostrom & Iacobucci, 1995; Kahn, 1998). Depending on the type of service, service customization can provide a solution to consumers’ need for uniqueness (Tian, Bearden, & Hunter, 2001). Previous empirical findings related to the relationship between customization and satisfaction generally support a relationship between service customization and customer satisfaction. With the exception of Surprenant and Solomon (1987), who report that customization does not necessarily lead to greater customer satisfaction with the service offering, the large majority of empirical studies confirm a substantial positive relationship between service customization and customer satisfaction (Ostrom & Iacobucci, 1995; Devaraj, Fan, & Kohli, 2006; Meuter, Ostrom, Roundtree, & Bitner, 2000; Srinivasan, Anderson, & Ponnavolu, 2002; Bettencourt & Gwinner, 1996). One explanation for this finding is delivered by role theory: through adjusting their behavior for different customers (customization of their behavior), frontline employees can better meet individual consumer’s expectations and thereby create customer satisfaction (Solomon, Surprenant, Czepiel, & Gutman, 1985). Bettencourt and Gwinner (1996) conclude that consumers who experience customized treatment will be more satisfied with the interaction than those who experience a standard treatment. Based on the conceptual deliberations and the overall empirical evidence, we hypothesize:
H2: A higher level of service customization leads to higher customer satisfaction.
As customization decreases customer uncertainty and vulnerability, it creates customer trust (Moorman, Deshpande, & Zaltman, 1993). Several empirical studies have confirmed a significant effect of customization on customer trust (Coulter & Coulter, 2002; Komiak & Benbasat, 2007; Moorman et al., 1993). Some empirical studies find that the perceived willingness of companies to customize is a builder increases trust (Doney & Cannon, 1997; Koufaris & Hampton-Sosa, 2004). Further theoretical and empirical support for a relationship between customization and trust can be found in social psychology (c.f. Miller, 2002). Although in this context the customization construct mainly describes the type of interaction between two parties instead of a customization of an exchange object, it relates to the customization of the interaction within the dyad of service relationships (Mittal & Lassar, 1996). Another explanation for the customization-trust effect is that the customer may see the time and effort involved in customizing services as a signal of the benevolence of the firm. Customization fulfils the three criteria for signaling (Singh & Sirdeshmukh, 2000): (1) it is clearly visible for the consumer, (2) it unambiguously signals high quality, and (3) customers perceive it as an investment that is committed and cannot be salvaged. As a specific form of trustworthy behavior, the customization of services may encourage the customer to believe in the benevolence of the firm, thus increasing his/her trust (Sirdeshmukh et al., 2002). We thus hypothesize:
H3: A higher level of service customization leads to increased customer trust.
A highly regarded theory to explain why customers stay loyal in exchange relationships is Thibaut and Kelley’s (1959) social exchange theory. In its very essence, it states that individuals maintain a relationship as long as the attractiveness of alternatives does not exceed the attractiveness of the current offer for more than the switching costs induced from switching relationship partner. Ideally, customization creates switching costs and increases the attractiveness of the current exchange relationship in comparison to alternatives. Firstly, customization requires a mutual investment into the exchange relationship. Customers spend time and effort expressing their needs and wishes; companies examine these needs and wishes and tailor the product, implying a renunciation of economies of scale. The exchange relationship partners’ investments constitute relationship-specific assets (Heide & John, 1988), which are positively associated with a continuation of relationships (Levinthal & Fichman, 1988). Secondly, the higher attractiveness of a customized offer means at the same time a decrease in the attractiveness of competing offerings ceteris paribus. Ultimately, the combination of an increase in switching costs and a reduction in attractiveness of alternatives that are associated with service customization lets us expect the following effect:
H4: A higher service customization leads to a higher customer loyalty.
Finally, we investigate to what extent the creation of customer loyalty is contingent on customization. More specifically, we examine the influence of service customization on the effects of customer satisfaction and customer trust on customer loyalty.
It is the core promise of customization that a customer’s needs are better fulfilled than by a standardized offering. This implies that through customization, the attractiveness of alternatives diminishes relatively to the customized offering. Social exchange theory (Thibaut & Kelley, 1959) posits that the attractiveness of alternatives plays a role only if there are deficits of customer satisfaction. Similarly, variations in customer satisfaction have stronger consequences for customer loyalty in the presence of viable alternatives (Sharma & Patterson, 2000). In particular, customers’ willingness to maintain a non-satisfactory exchange relationship alleviates in the presence of good alternatives. Besides making alternative offerings less attractive, customization creates switching costs for the customer (that is particularly sunk costs). Predominantly, switching costs are regarded as a moderator in the satisfaction–loyalty linkage (Yang & Peterson, 2004). In case of substantial switching costs and particularly painful switching processes, dissatisfied customers tend to maintain business relationships with existing service firms and to overcome the temptation to dissolve the relationship (Jackson, 1985). As Jones, Mothersbaugh, and Beatty (2000, p. 262) put it, “when perceived switching costs are low, dissatisfied consumers should be more likely to defect than are satisfied customers. Alternatively, when perceived switching costs are high, customers may remain despite their dissatisfaction due to perception that switching costs outweigh switching benefits.“ In total, the notion of switching costs as moderators of the satisfaction-loyalty link has found ample conceptual (Fornell, 1992; Lee, Lee, & Feick, 2001; Oliver, 1999) and empirical support (Hauser, Simester, & Wernerfelt, 1994; Anderson & Sullivan, 1993; Sharma & Patterson, 2000). Altogether, we expect an interaction of service customization and customer satisfaction to emerge as formulated in the following hypothesis:
H5: The relationship between service customization and customer loyalty is weaker the higher the
customer satisfaction.
The relationship between a service firm and its customers can be analyzed from a principal-agent perspective, where the customer takes the role of the principal and the service firm that of the agent. Both the principal and the agent will maximize their own interest (Jensen & Meckling, 1976). The agent is assumed to have an information advantage, which can be pressed home at the principal’s expense. In order to prevent the latter, several governance mechanisms have been identified. One remedy to this problem is to invest resources into the monitoring of the agent’s actions (Holmstrom, 1979). Another solution is the concept of customer trust (Dwyer, Schurr, & Oh, 1987). For a customer, an investment of resources can take several forms. For
instance, the customer could forego the additional benefit of a customized service and instead accept a standardized service. The service firm may provide a standardized service as a commitment technique. This means, the firm is committed to guaranteeing a predetermined level of quality to their customers (c.f. Boulding & Kirmani, 1993). Alternatively, the principal may use all available (incomplete) information about the agent in order to curb self-serving behaviors that may run counter to the principal’s interests (Eisenhardt, 1989). This information about an agent’s positive or negative intentions can be regarded as the benevolence dimension of trust (Mayer et al., 1995). If an agent is seen as benevolent, the agent is expected to refrain from opportunistic behavior. In absence of other mechanisms designed to prevent opportunistic behavior, trust becomes important. Berry and Parasuraman (1991, p. 107) remark that “[e]ffective services marketing depends on the management of trust because the customer typically must buy a service before experiencing it.” This finding holds particularly true for service customization, where typically the service is tailored after it has been ordered. Trust is likely to become an important factor when the service offer is less predefined, as in case of high customization. Besides the theoretical grounding of an interaction effect of customer trust and service customization on customer loyalty, there is also empirical evidence: the role of customization differs for “real relationships”, which are based on trustful interactions, and pseudo-relationships, which are characterized by repeat-patronage only (Gutek, 1999). We finally conclude:
H6: The relationship between service customization and customer loyalty is stronger the higher the
customer trust.
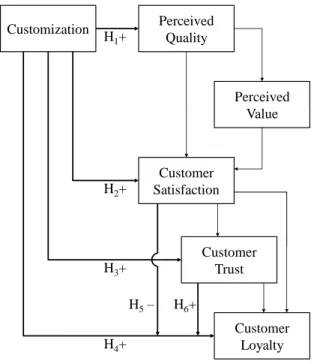
As a compilation of the effects of service customization on focal customer relationship constructs, we propose the framework shown in Figure 1. In order to place the focal variables into a nomological net of extant marketing theory, we depart from a baseline model. This model is derived from the European Customer Satisfaction Index (ECSI) model and draws from the service quality (Parasuraman, Zeithaml, & Berry, 1985; Zeithaml, Berry, & Parasuraman, 1996), customer satisfaction (Fornell, 1992; Oliver, 1999), and relationship marketing literature (Morgan & Hunt, 1994; Ganesan, 1994). Aware of the significant debate and controversy about the linkages that connect satisfaction and loyalty as well as their antecedents, we note that our aim is not to address these issues. Rather, we borrow from previous research a tenable, empirically supported customer relationship model that can help our objective of explicating the effects of service customization on customer-firm relationships, which is the primary objective of this study.
The original ECSI model is a well-established framework for measuring and explaining customer satisfaction and its antecedents and related constructs (Kristensen, Martensen, & Grønholdt, 2000; Cassel & Eklof, 2001; Vilares & Coelho, 2003), consisting of six latent variables (Image, Expectations, Perceived Quality, Perceived Value, Customer Satisfaction and Loyalty). It has been validated across a number of European countries and many industries, such as insurance, mobile phones, fixed phones, carbonated soft drinks, public transportation, retail banking, cable TV, supermarkets, postal services, food products, and public service. Besides service customization, we included trust in our baseline model. Many marketing scholars have highlighted the importance of trust as a key predictor of loyalty (c.f. Sirdeshmukh, Singh, & Sabol, 2002; Agustín & Singh, 2005). Consequently, recent studies have included the trust construct in an extended ECSI model (c.f. Ball, Coelho, & Machás, 2004; Ball et al., 2006). Our conceptualization of trust corresponds to what Mayer, Davis, and Schoorman (1995) refer to as the benevolence dimension of trust. For reasons of parsimony, we omit the constructs image and expectations.
Research design
Data collection
The data were collected using surveys of banking and cable TV customers corresponding to the 2005 wave of the European Customer Satisfaction Index (ECSI) in a Western European country1. This national customer satisfaction study produces yearly results regarding several industries (including the retail banking and telecommunications).
The questionnaire used in the survey queries the overall experience of the respondent with the company, and includes a set of questions regarding the six constructs of our model (service customization, perceived quality, perceived value, customer satisfaction, trust, and customer loyalty).
Data collection used telephone interview supported by CATI. The sampling design is based on the random selection of households using random digit dialling (random generation of phone numbers). In each household the selection of a resident is made by a pseudo-random method (the eligible resident with the nearest birth date). The first set of questions in the questionnaire is used to qualify the potential respondent as a customer of the industry (banking or cable TV) and to identify his main supplier. All other questions in the questionnaire refer to the identified company. More detailed information about the selection of the respondents may be found in ECSI (1998). The sample size is 1583 observations for banking customers and 521 for the cable TV ones.
Both samples spread over the main banks and cable TV operators. We find a slightly higher proportion of males among respondents of banking industry and of females for cable TV (57% in both cases). Customers of both industries spread over all age classes and show similar structure: less than 30 years old (27% for banking and 29% for cable TV); between 30 and 39 years (22% for banking and 23% for cable TV); between 40 and 49 years (20% for banking and 19% for cable TV); and 50 years or more (31% for banking and 27% for cable TV). Regarding the educational level we find that 36% of banking customers and 28% of cable TV ones have basic education (less than 9 years); 31% of banking customers and 39% of cable TV have secondary education (between 9 and 12 years); and 33% of customers of both industries have university education (bachelor or more). This socio-demographic profile is consistent with the knowledge of industry managers and similar to the profiles obtained from other waves of ECSI survey in these industries.
Operational measures
All constructs in the proposed model are based on reflective multi-item scales. Indicators of perceived quality, perceived value, customer satisfaction and customer loyalty are the ones used in the ECSI model (Kristensen et al., 2000; Cassel & Eklof, 2001; Vilares & Coelho, 2004) and have been validated across several European countries and many industries. In particular, perceived value, customer satisfaction and customer loyalty use the same measurement model as the American Customer Satisfaction Index, which has been extensively validated (Fornell et al., 1996). The indicators used to measure trust have been used by Ball et al. (2004, 2006), among others. The measurement scale of customization is compiled from the studies of Fornell et al. (1996) and Ball et al. (2006), and adapted to the industries under study. Face validity of customization was obtained through expert judgment; other forms of validity (convergent, discriminant and nomological) are assessed in the results section. All indicators are measured with a 10-point rating scale, having 1 representing the lowest level and 10 the highest level. Table A1 of the Appendix I presents a detailed list of indicators used in the measurement model.
Estimation
The structural model consists of eight latent variables. It includes the six constructs shown in Figure 1, plus two latent variables that represent interactions between original latent variables (satisfaction × customization and trust × customization interaction terms). Interaction terms were modelled creating new constructs, having as indicators the products of the standardized indicators relative to the underlying constructs involved in the interaction, following the approach of Chin, Marcolin, and Newsted (2003).
The model was estimated using Partial Least Squares (PLS). This option is mainly motivated by the nature of the data. In fact we are measuring categorical variables with an unknown non-normal frequency distribution, which is usually negatively skewed. In this context PLS can be a preferable alternative to the use of maximum likelihood methods (comparisons between maximum likelihood methods and partial least squares can be found in Fornell & Bookstein, 1982; Chin, 1998; Vilares, Almeida, & Coelho, 2008). Moreover, PLS has been the standard estimation method in the context of the ECSI and in the American Customer Satisfaction Index (ACSI). All data analyses were done using SmartPLS (Ringle, Wende, & Will, 2007) and SAS System.
Results
Descriptive analysis
Means and standard deviations of original variables can be found in Table 1. In the banking data set, means vary between 5.73 for y31 (evaluation of price given quality) and 8.23 for y43 (company treats in an honest
way in every transaction). For cable TV customers, means vary between 5.47 for y31 (evaluation of price
given quality) and 7.42 for y12 (quality of products and services). For banking customers the highest means
are found in trust indicators and the lowest in perceived value and customization constructs. For cable TV the highest means are found in perceived quality and the lowest in perceived value and trust. The means for most of the measures are more than two scale points to the right of the centre of the scale suggesting a negatively skewed distribution. In banking data set, standard deviations vary between 1.60 for y23 (diversity of products
and services) and 2.71 for y61 (probability to choose the company again). For cable TV the lowest standard
deviation is 1.70 for y22 (reliability of products and services) and 2.49 for y61 (probability to choose the
company again). Loyalty indicators are the ones that globally show highest standard deviations and the indicators of perceived quality are the ones with the lowest variability. Globally, the banking data set tends to show higher means and lower standard deviations than the cable TV one. Indicators of perceived value and customer loyalty are the ones with smaller differences between the two data sets. The most significant differences between the means of the two data sets are found in the indicators of trust (with banking customers showing higher perceptions). Significant differences in standard deviations are found in indicators of the same constructs, with the banking data set showing lower variability than the cable TV one.
– Take in Table 1 –
Measurement reliability and validity
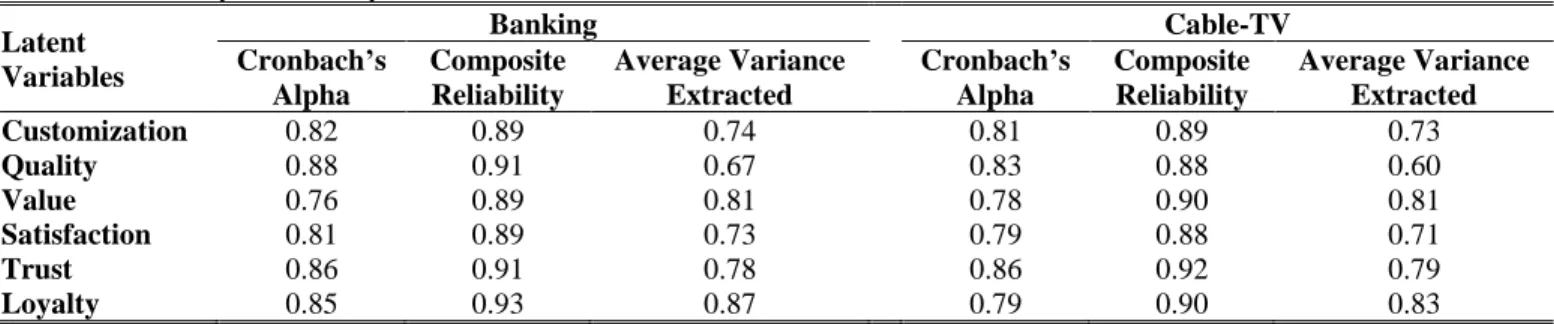
We first examine the reliability and validity measures for the model constructs (Table 2). All Cronbach’s Alphas exceed the 0.7 threshold (Nunnally, 1978) and are usually higher than 0.8. Without exception, latent variable composite reliabilities (Fornell & Larcker, 1981) are higher than .80, and in general near .90, showing a high internal consistency of indicators measuring each construct and thus confirming construct reliability. The average variance extracted (AVE, Fornell & Larcker, 1981) is also always higher than .60, indicating that the variance captured by each latent variable is significantly larger than variance due to
measurement error, and thus demonstrating unidimensionality and a high convergent validity of the constructs. Reliability and convergent validity of the measurement model was also confirmed by computing standardized loadings for indicators (Table 2) and Bootstrap t-statistics for their significance (Anderson & Gerbing, 1988). All standardized loadings exceed the 0.7 threshold and they were found, without exception, significant at 1% significance level, thus confirming a high convergent validity of the measurement model.
– Take in Table 2 –
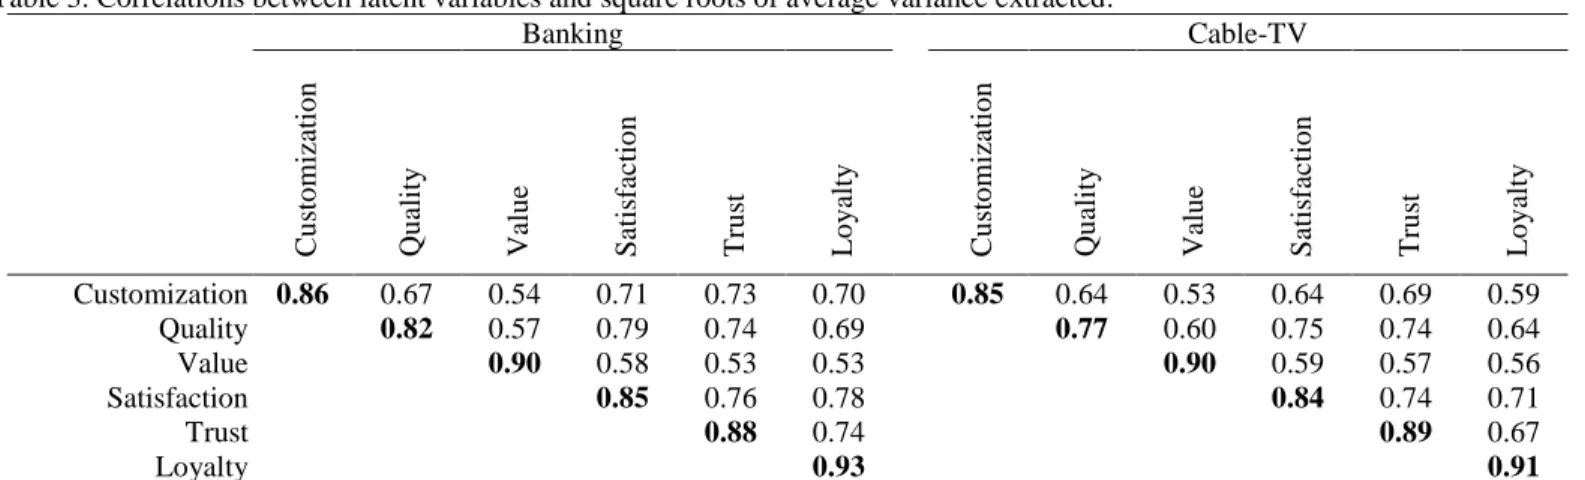
Discriminant validity is assessed determining whether each latent variable shares more variance with its own measurement variables or with other constructs (Fornell & Larcker, 1981; Fornell & Bookstein, 1982; Chin, 1998). In this vein, we compared the square root of the AVE for each construct with the correlations with all other constructs in the model (Table 3). A correlation between constructs exceeding the square roots of their AVE indicates that they may not be sufficiently discriminable. We can observe that the square roots of AVE (shown in boldface in the main diagonal of both matrices) are always higher than the absolute correlations between constructs. We conclude that all the constructs show evidence for acceptable validity.
– Take in Table 3 –
Model estimation results
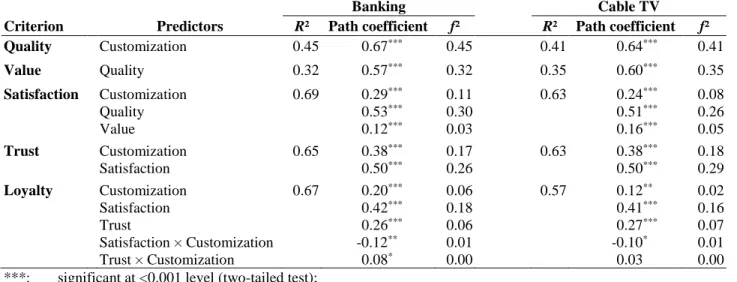
Table 4 shows the explanatory power (through determination coefficient, R2) of the equations explaining the
endogenous constructs. It can be seen that the proposed model shows a high explanatory power for customer satisfaction (0.69 for banking and 0.63 for cable TV), trust (0.65 for banking and 0.63 for cable TV) and loyalty (0.67 for banking and 0.57 for cable TV). The determination coefficients regarding the explanation of perceived quality and perceived value are lower (between 0.32 and 0.45), which was to be expected since our model offers a less detailed explanation of these constructs. Particularly for our focal construct, loyalty, results show a good explanatory power and therefore provide strong support for the nomological validity of the proposed model.
Furthermore, Table 4 presents the estimates of path coefficients of the proposed model and respective significances. The effect sizes for evaluating the predictive importance of each determinant (original constructs and interaction terms) may also be found in Table 4. Globally we can observe that, with one exception, all the hypothesized paths are statistically significant. The satisfaction × customization-loyalty path is significant at 1% and 5% significance level in banking and cable TV, respectively. The trust × customization-loyalty path is significant at 5% significance level in banking and non-significant for cable TV. In cable TV data set the customization-loyalty path is significant at 1% significance level. All other hypothesized paths are significant at 0.1% significance level.
Customization shows, in both industries, significant positive impacts on quality, loyalty, satisfaction, and trust thus confirming hypotheses H1 to H4. The customization-satisfaction interaction shows, in both cases, a
negative impact on loyalty, which confirms hypothesis H5. The trust-customization interaction shows positive
impacts on loyalty. Nevertheless, this impact was found significant only in the banking data set, partially confirming hypothesis H6. Globally, these results offer strong empirical evidence to support both the influence
of customization on customer loyalty and the mediating role of quality, satisfaction and trust on the customization-loyalty relationship. Results also support the existence of interaction effects between customization and customer satisfaction and between customization and trust on customer loyalty (the last one only in banking industry).
The impact of customization on perceived quality is 0.67 in banking industry and 0.64 in cable TV. The impact of customization on satisfaction is 0.29 for banking and 0.24 for cable TV. In both data sets this impact is lower than the one originated by quality, but significantly higher than the perceived value one. Effect sizes also follow this pattern, confirming that satisfaction is mainly explained by quality and customization. The impact of customization on trust is also similar in both data sets (0.38). In both data sets,
this impact is of lower magnitude as the ones by customer satisfaction. When explaining trust, both customization and customer satisfaction reveal similar medium effect sizes. The highest direct impact on loyalty is, in both data sets, originated by satisfaction (0.42 and 0.41, respectively). Trust always shows the second highest impact on loyalty (0.26 and 0.27, respectively) followed by customization (0.20 and 0.12, respectively). Note, that the impact of customization on loyalty was significantly smaller in cable TV. The satisfaction × customization interaction shows in both data sets similar and substantial impacts on customer loyalty (-0.12 and -0.10), but lower, as expected, than the direct impacts originated by the respective interacting variables. The trust × customization interaction is only significant in the banking data set, also showing a large positive impact on customer loyalty (0.08). The loyalty determinant contributing with the highest explanatory power is satisfaction, since both customization and trust show significantly lower effect sizes.
Globally, we can conclude that results relative to both industries are rather consistent. With the exception of the trust × customization interaction in cable TV, the impacts from customization on other model constructs are of similar magnitude on both data sets. Customization also shows relatively similar explanatory power when explaining customer satisfaction, trust and loyalty. Nevertheless, the impacts and effect sizes originated by customization on other constructs tend to be larger in the banking industry, mainly when explaining perceived quality and customer loyalty. A possible explanation for these differences in parameters across industries is that there are more opportunities to customize services in the banking industry. Moreover, it is probably easier to use customization to create a sense of uniqueness and fulfilment of individual needs in banking.
– Take in Table 4 –
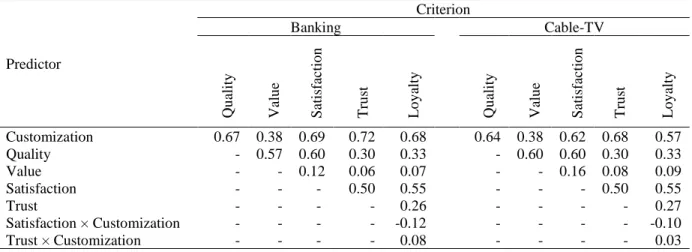
Table 5 shows the total impacts (direct plus indirect effects) between constructs (origins of the effects in rows and destinations in columns). We shall focus our comments on one focal construct: customer loyalty. The highest total effect on loyalty is the one originated by customization in both data sets (0.68 in banking and 0.57 in cable TV). Note that the total effect of customization is tributary of important indirect effects, since the direct effects from customization on loyalty are 0.20 and 0.12, respectively. Customer satisfaction (0.55) shows the second highest effect on customer loyalty for the banking and cable TV industries. Trust and perceived quality still show important but usually lower total effects on loyalty (between 0.26 and 0.33). Nevertheless, while the effects originated by trust are exclusively direct, the ones originated by quality are mostly indirect and mediated by satisfaction. Perceived value is the construct that shows the lowest total effect on loyalty (0.07 for banking and 0.09 for cable TV). The total effects on loyalty originated by the satisfaction × customization and trust × customization interactions are equal to the observed direct effects since no mediation exists in their paths to loyalty.
When comparing both industries we can again observe that results are rather consistent. In fact, the total effects on loyalty are generally of the same magnitude in both industries. The most significant difference between the two industries refers to the total effect of customization on loyalty. In fact, customization shows a significantly higher effect in banking industry.
We can conclude that in both industries the effect of customization on loyalty is mostly indirect, being mediated by perceived quality, satisfaction and customer trust. We can also conclude that the direct effect of customization on customer loyalty is moderated by customer satisfaction and trust (the latter one only in banking).
– Take in Table 5 –
Discussion and Implications
Point of departure of this research was the ambiguity in the current knowledge on the efficacy of service customization and the lack of empirical validation of the presumably favourable outcomes of customization,
as marketing researchers are just beginning to explore the effectiveness of customization strategies from a consumer perspective (Dellaert & Stremersch, 2005). Our study delivers empirical support for direct, indirect, and interaction effects of service customization on focal relationship marketing constructs, thereby providing important implications for marketing theory and practice.
Implications for marketing theory
In their proposition of a service-dominant logic of marketing, Vargo and Lusch (2004) postulate that the normative marketing goal should be customization, rather than standardization. Our paper adds to this in that it provides the empirical support for the effectiveness of customization. The fact that companies and marketing scholars alike perceive an “urge to personalize” (Vesanen & Raulas, 2006) can be regarded as very positive: It is a promising approach that leads to increased customer loyalty.
In this paper we have found strong empirical evidence supporting the focal hypothesis that service customization is an important co-creator of customer loyalty. Based on the theoretical model of customization outcomes and the supportive empirical findings, we can conclude that the effect of customization on loyalty is partially mediated by perceived service quality, customer satisfaction, and customer trust. In fact, we found customization an important predictor of perceived quality, satisfaction, trust, and customer loyalty in both studied industries. It is noteworthy that the total effect of customization on customer loyalty outweighs the total effect of quality. When Ostrom and Iacobucci (1995) find that service quality contributes somewhat more to the formation of customer satisfaction than customization, this could be because of the mediating effect of quality on the customization-satisfaction link.
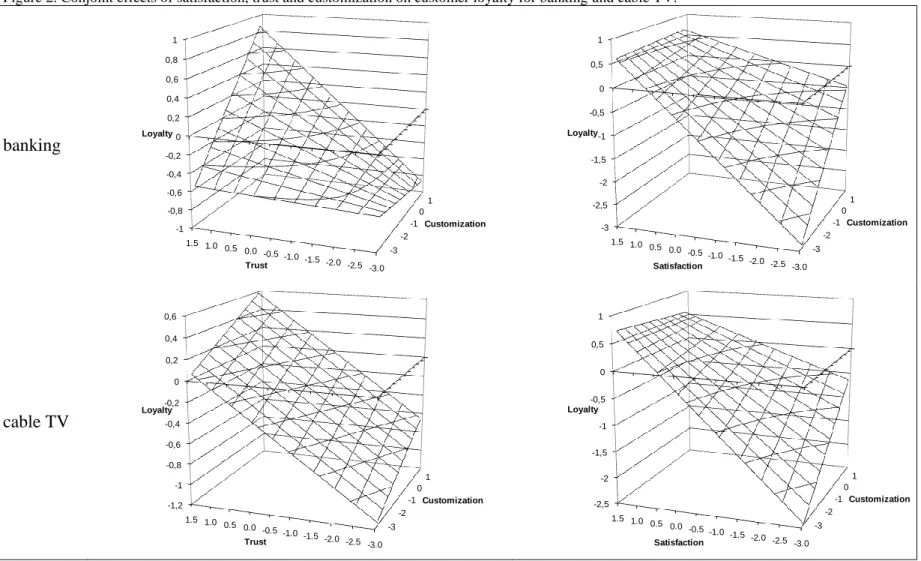
The probably most important finding of this study is that the effect of service customization on customer loyalty depends on the current relationship quality, i.e. the levels of customer satisfaction and trust. Service customization yields its highest efficacy when customer relationship quality is characterized by high level of trust, but only moderate or low levels of customer satisfaction. Figure 2 visualizes these moderating effects both for the banking industry (top line) and cable TV (bottom line). The left column of Figure 2 shows for both industries the predicted level of customer loyalty resulting from the levels of customer trust and service customization. For higher levels of trust, the lines representing the single effects of customization become steeper (in the banking industry), signifying an increased efficacy of customization. It is worthwhile to have a look at the isohypses of customer loyalty, which have a convex shape. Any increase in customer loyalty is most efficiently achieved by a joint increase in customer trust and customization, which means that the interaction of customer trust and customization is synergistic. The right column of Figure 2, which shows the predicted level of customer loyalty resulting from the levels of customer satisfaction and service customization, provides a different picture. For both industries it can be observed that at high levels of customer satisfaction, the lines representing the single effects of customization are flat, i.e. variations in customization do not imply variations in customer loyalty. For low levels of customer satisfaction, however, the single effect of customization becomes strong and positive. In this case, the isohypses of customer loyalty have a concave shape, meaning that any increase in customer loyalty is most efficiently achieved by either increasing customer satisfaction or customization. Thus, the interaction between customization and customer satisfaction is antagonistic.
– Take in Figure 2 –
The findings also provide a better understanding of the nature of the customization construct. They confirm that the construct customization is empirically different from seemingly very similar constructs like personalization or special treatment benefits. In contrast to personalization or special treatment benefits, which do not consistently (Surprenant and Solomon, 1987) or even not at all (Hennig-Thurau, Gwinner, & Gremler, 2002) increase customer satisfaction, customization has a consistently positive influence on customers’ evaluations of the service in terms of quality and satisfaction. As the three constructs of
customization, personalization, and special treatment benefits differ in their consequences, they cannot be the same construct.
Implications for marketing practice
If marketers offer customized services, they will be rewarded with higher customer loyalty. Service customization is thus indeed an actionable variable that a service provider can control and position its business strategically in order to retain customers (as assumed by Devaraj et al., 2006). Our findings also support the notion that service customization can mark a competitive advantage (Huffman & Kahn, 1998). The rationale of the competitive advantage through service customization is grounded in the stronger customer-firm relationships as characterized not only by the increased customer loyalty, but also a higher relationship quality.
Marketing decision makers can make use of the estimates of our model of service customization outcomes in order to compare the impact of customization with alternative relationship marketing instruments, such as e.g. loyalty programs (c.f. Meyer-Waarden, 2008), direct mailings (c.f. Verhoef, 2003), or customer clubs (c.f. Ang & Buttle, 2006).
Managers should take into account that the loyalty return of an investment in service customization is contingent on the current and intended level of customer-firm relationship quality, i.e. the constellation of customer satisfaction and customer trust. Table 6 helps to predict the efficacy of service customization as relationship marketing instrument contingent upon relationship quality. An investment in service customization may have significant impacts on loyalty for companies with high levels of trust and low customer satisfaction. If the overall relationship quality is already high, the marginal contribution of service customization can be expected to be lower due to ceiling effects. For a company with an established customization program facing low levels of trust, the investment in customer trust may be a preferable choice, for instance by means of pledges, in order to increase the effectiveness of service customization. Also, a company that offers low levels of trust and customization to its customers may choose to conjointly invest in these two dimensions or alternatively promote customer satisfaction, namely through improved perceived quality and value. Our results help managers to decide upon changing the allocation of resources designed to enhance customer satisfaction, trust, and loyalty among existing customers.
– Take in Table 6 –
Although service customization is most promising for companies that yield high customer trust, but moderate to low customer satisfaction, the strong total effect of service customization on customer loyalty suggests potential loyalty gains for other companies, too. In order to benefit from service customization effects, adequate service customization programs should be tested and implemented. Managers can and should make use of the fact that “new tools and management approaches have been introduced to enable marketers to serve the wants of individual customers better” (Simonson, 2005, p. 32). The development of such programs should take into account the current levels of customization, customer satisfaction and trust. This means that these strategic constructs, along with customer loyalty, should be tracked through observational and survey methods in order to assess the effects of service customization programs. When aiming at an optimal level of customization, companies should also take into account that a higher degree of customization implies that customer satisfaction and productivity are less likely compatible; i.e. companies face a higher trade-off between customer satisfaction and productivity (Anderson et al., 1997).
Not only do companies differ in the level of customer satisfaction and trust, but also entire industries. Industries with high levels of trust but low levels of satisfaction are likely to have higher loyalty returns from customization than other industries. Multi-industry conglomerates as well as consultancies specialized in customization programs have a genuine interest in identifying those industries that should be prioritized in terms of customization efforts. In order to identify promising industries, it would be valuable if national
customer satisfaction indices, such as ECSI or ACSI, also provided levels of trust per industry, in analogy to their provision of satisfaction values.
Limitations and Further Research
Some limitations of our research are worth noting. The research has been conducted in two service industries. Although results are very consistent between the two industries, the empirical model should be tested in other industries, too. We might expect that the relative importance of satisfaction, trust and customization is different in other markets. The relative importance of these loyalty determinants may depend on the level of regulation of the market, available information, switching barriers and range of possibilities in customizing the services provided. Therefore, the place of customization in the competitive mix may be greater or smaller than in other markets. Also the importance of the moderating effects may vary across industries.
Another limitation of our study is the use of a cross-sectional design. Cross-sectional research cannot fully capture the dynamic and interactive nature of many relationship variables. Moreover, customer loyalty represents behavioral intentions rather than effective behavior. In time, having a number of observations, we may follow a sample of customers, in order to understand the effects of customization in effective behaviors. Future research should also test the possible existence of nonlinear effects from the three considered antecedents on customer loyalty and consider the existence of different market segments with different motivations.
Furthermore, we only investigated one possible competitive advantage through service customization, namely increased customer loyalty. Other potential and favorable outcomes of service customization, like for instance the various forms of commitment, word of mouth or financial outcomes such as return on investment have been neglected. Empirically exploring additional outcomes of service customization may be an interesting point of departure for future research.
Finally, while we do provide an answer on the question whether a company should conduct service customization, we leave the question unanswered how this should be done. Pine, Peppers, and Rogers (1995, p. 103) argue that customers “do not want more choices. They want exactly what they want—when, where, and how they want it—and technology now makes it possible for companies to give it to them.”
References
Agustín, Clara and Jagdip Singh (2005), “Curvilinear Effects of Consumer Loyalty Determinants in Relational Exchanges,” Journal of Marketing Research, 42 (1), 96-108.
Aijo, Tiovo S. (1996), “The Theoretical and Philosophical Underpinnings of Relationship Marketing: Environmental Factors behind the Changing Marketing Paradigm,” European Journal of Marketing, 30 (2), 8-18.
Anderson, Eugene W. and Mary W. Sullivan (1993), “The Antecedents and Consequences of Customer Satisfaction for Firms,” Marketing Science, 12 (2), 125-143.
Anderson, Eugene W., Claes Fornell, and Roland T. Rust (1997). “Customer Satisfaction, Productivity, and Profitability: Differences between Goods and Services,” Marketing Science, 16 (2), 129-145.
Anderson, James C. and David W. Gerbing (1988), “Structural Equation Modeling in Practice: a Review and Recommended Two-Step Approach”, Psychological Bulletin, 103 (3), 411-23.
Ang, Lawrence and Francis Buttle (2006), “Customer Retention Management Processes,” European Journal of Marketing, 40 (1/2), 83-99.
Ball, Dwayne; Pedro Simões Coelho, and Alexandra Machás (2004), “The Role of Communication and Trust in Explaining Customer Loyalty: an Extension to the ECSI Model,” European Journal of Marketing, 38 (9/10), 1272-1293.
Ball, Dwayne; Pedro Simões Coelho and Manuel J. Vilares (2006), “Service Personalization and Loyalty,” Journal of Services Marketing, 20 (6), 391-403.
Bardakci, Ahmet and Jeryl Whitelock (2003), “Mass-Customisation in Marketing: the Consumer Perspective,” Journal of Consumer Marketing, 20 (5), 463-479.
Bardakci, Ahmet and Jeryl Whitelock (2004), “How "Ready" Are Customers for Mass Customisation? An Exploratory Investigation,” European Journal of Marketing, 38 (11/12), 1396-1416.
Berry, Leonard L. and Anantharanthan Parasuraman (1991), Marketing Services. NewYork, The Free Press.
Bettencourt, Lance A. and Kevin Gwinner (1996), “Customization of the Service Experience: the Role of the Frontline Employee,” International Journal of Service Industry Management, 7 (2), 3-20.
Bitner, Mary Jo, Bernard H. Booms and Mary Stanfield Tetreault (1990), “The Service Encounter: Diagnosing Favorable and Unfavorable Incidents,” Journal of Marketing, 54 (1), 71-84.
Boulding, William and Amna Kirmani (1993), “A Consumer-Side Experimental Examination of Signaling Theory: Do Consumers Perceive Warranties as Signals of Quality?” Journal of Consumer Research, 20 (1), 111-123.
Cassel, Claes and Jan A. Eklöf (2001), “Modelling customer satisfaction and loyalty on aggregate levels: Experience from the ECSI pilot study”, Total Quality Management, 12 (7-8), 834-841.
Chin, Wynne W.(1998), “The Partial Least Squares Approach to Structural Equation Modeling,” in Marcoulides, G. A. (ed.), Modern Methods for Business Research, chapter 10, NJ Lawrence Erlbaum Associates.
Chin, Wynne W., Barbara L. Marcolin, and Peter R. Newsted (2003), “A Partial Least Squares Latent Variable Modeling Approach for Measuring Interaction Effects: Results From a Monte Carlo Simulation Study and an Electronic-Mail Emotion/Adoption Study,” Information Systems Research, 14 (2), 189-217.
Coulter, Keith S. and Robin A. Coulter (2002), “Determinants of Trust in a Service Provider: the Moderating Role of Length of Relationship,” Journal of Services Marketing, 16 (1), 35-50.
Dellaert, Benedict G. C. and Stefan Stremersch (2005), “Marketing Mass Customized Products: Striking the Balance between Utility and Complexity,” Journal of Marketing Research, 42 (2), 219-227.
Devaraj, Sarv, Ming Fan, and Rajiv Kohli (2006), “Examination of Online Channel Preference: Using the Structure-Conduct-Outcome Framework,” Decision Support Systems, 42 (2), 1089-1103.
Doney, Patricia M. and Joseph P. Cannon (1997), “An Examination of the Nature of Trust in Buyer-Seller Relationships,” Journal of Marketing, 61 (2), 35-51.
Dwyer, F. Robert, Paul H. Schurr, and Sejo Oh (1987), “Developing Buyer-Seller Relationships,” Journal of Marketing, 51 (2), 11-27.
ECSI Technical Committee (1998), European Customer Satisfaction Index Foundation and Structure for Harmonized National Pilot Projects, ECSI.
Eisenhardt, Kathleen M. (1989), “Agency Theory: An Assessment and Review,” Academy of Management Review, 14 (1), 57-74. Ennew, Christine T. and Martin R. Binks (1996), “The Impact of Service Quality and Service Characteristics on Customer
Retention: Small Businesses and their Banks in the UK,” British Journal of Management, 7 (3), 219-230.
Fiore, Ann Marie, Seung-Eun Lee, and Grace Kunz (2004), “Individual Differences, Motivations, and Willingness to Use a Mass Customization Option for Fashion Products,” European Journal of Marketing, 38 (7), 835-849.
Fornell, Claes (1992), “A National Customer Satisfaction Barometer. The Swedish Experience,” Journal of Marketing, 56 (1), 6-21. Fornell, Claes and Fred L. Bookstein (1982), “Two Structural Models: LISREL and PLS Applied to Consumer Exit-Voice Theory,”
Journal of Marketing Research, 19 (4), 440-452.
Fornell, Claes and David F. Larcker (1981), “Evaluating Structural Equation Models with Unobservable Variables and Measurement Error,” Journal of Marketing Research, 18 (1), 39-50.
Fornell, Claes, Michael D. Johnson, Eugene W. Anderson, Jaesung Cha, and Barbara Everitt Bryant (1996), “The American Customer Satisfaction Index: Nature, Purpose, and Findings,” Journal of Marketing, 60 (4), 7-18.
Freeland, John G. (2003), The Ultimate CRM Handbook. New York, McGraw-Hill.
Ganesan, Shankar (1994), “Determinants of Long-Term Orientation in Buyer-Seller Relationships,” Journal of Marketing, 58 (2), 1-19.
Gardyn, Rebecca (2001), “Swap Meet,” American Demographics, 23 (7), 50-55.
Gordon, Mary Ellen, Kim McKeage, and Mark Alexander Fox (1998), “Relationship Marketing Effectiveness: The Role of Involvement,” Psychology & Marketing, 15 (5), 443-459.
Gutek, Barbara A. (1999), “The Social Psychology of Service Interactions,” Journal of Social Issues, 55 (3), 603-617.
Hart, Christopher W. L. (1995), “Mass Customization: Conceptual Underpinnings, Opportunities and Limits,” International Journal of Service Industry Management, 6 (2), 36-45.
Hauser, John R., Duncan I. Simester and Birger Wernerfelt (1994), “Customer Satisfaction Incentives,” Marketing Science, 13 (4), 327-350.
Heide, Jan B. and George John (1988), “The Role of Dependence Balancing in Safeguarding Transaction-specific Assets in Conventional Channels,” Journal of Marketing, 52 (1), 20-35.
Hennig-Thurau, Thorsten, Kevin P. Gwinner, and Dwayne D. Gremler (2002), “Understanding Relationship Marketing Outcomes: An Integration of Relational Benefits and Relationship Quality,” Journal of Service Research, 4 (3), 230-247.
Huffman, Cynthia, and Barbara E. Kahn (1998), “Variety for Sale: Mass Customization or Mass Confusion?” Journal of Retailing, 74 (4), 491-513.
Jackson, Barbara B. (1985). Winning and Keeping Industrial Customers. The Dynamics of Customer Relationships. Lexington, MA: Lexington Books.
Jensen, Michael and William Meckling (1976), “Theory of the Firm: Managerial Behavior, Agency Costs, and Ownership Structure,” Journal of Financial Economics, 3 (4), 305-360.
Jones, Michael A., David L. Mothersbaugh, and Sharon E. Beatty (2000), “Switching Barriers and Repurchase Intentions in Services,” Journal of Retailing, 76 (2), 259-274.
Kara, Ali and Erdener Kaynak (1997), “Markets of a Single Customer: Exploiting Conceptual Developments in Market Segmentation,” European Journal of Marketing, 31 (11/12), 873-895.
Kim, Jong Woo, Byung Hun Lee, Michael J. Shaw, Hsin-Lu Chang, and Matthew Nelson (2001), “Application of Decision-Tree Induction Techniques to Personalized Advertisements on Internet Storefronts,” International Journal of Electronic Commerce, 5 (3), 45-62.
Komiak, Sherrie Y. X. and Izak Benbasat (2007), “The Effects of Personalization and Familiarity on Trust and Adoption of Recommendation Agents”, MIS Quarterly, 30 (4), 941-960.
Kotha, Suresh (1995), “Mass Customization: Implementing the Emerging Paradigm for Competitive Advantage,” Strategic Management Journal, 16 (Summer), 21-42.
Kotler, Philip (1989), “From Mass Marketing to Mass Customization,” Planning Review, 17 (5), 10-13.
Koufaris, Marios and William Hampton-Sosa (2004), “The Development of Initial Trust in an Online Company by New Customers,” Information & Management, 41 (3), 377-397.
Kristensen, Kai, Anne Martensen and Lars Grønholdt (2000), “Customer Satisfaction Measurement at Post Denmark: Results of Application of the European Customer Satisfaction Index Methodology,” Total Quality Management, 11 (7), 1007-1015. Lee, Jonathan, Janghyuk Lee, and Lawrence Feick (2001), “The Impact of Switching Costs on the Customer Satisfaction-Loyalty
Link. Mobile Phone Service in France,” Journal of Services Marketing, 15 (1), 35-48.
Lemon, Katherine N., Tiffany Barnett White, and Russell S. Winer (2002), “Dynamic Customer Relationship Management: Incorporating Future Considerations into the Service Retention Decision,” Journal of Marketing, 66 (1), 1-14.
Levinthal, Daniel A. and Mark Fichman (1988), “Dynamics of Interorganizational Attachments: Auditor-Client Relationships,” Administrative Science Quarterly, 33 (3), 345-369.
Liechty, John, Venkatram Ramaswamy, and Steven H. Cohen (2001), “Choice Menus for Mass Customization: An Experimental Approach for Analyzing Customer Demand with an Application to a Web-Based Information Service,” Journal of Marketing Research, 38 (2), 183-196.
Mayer, Roger C., James H. Davis, F. and David Schoorman (1995), “An Integrative Model of Organizational Trust,” The Academy of Management Review, 20 (3), 709-734.
Meuter, Matthew L., Amy L. Ostrom, Robert I. Roundtree, and Mary Jo Bitner (2000), “Self-Service Technologies: Understanding Customer Satisfaction with Technology-Based Service Encounters,” Journal of Marketing, 64 (3), 50-64.
Meyer-Waarden, Lars (2008), “The Influence of Loyalty Programme Membership on Customer Purchase Behaviour,” European Journal of Marketing, 42 (1/2), 87-114.
Mittal, Banwari and Walfried M. Lassar (1996), “The Role of Personalization in Service Encounters,” Journal of Retailing, 72 (2), 95-109.
Morgan, Robert M. and Shelby D. Hunt (1994), “The Commitment-Trust Theory of Relationship Marketing,” Journal of Marketing, 58 (3), 20-38.
Moorman, Christine, Rohit Deshpande, and Gerald Zaltman (1993), “Factors Affecting Trust in Market Research Relationships,” Journal of Marketing, 57 (1), 81-101.
Murthy, B. P. S. and Sumit Sarkar (2003), “The Role of the Management Sciences in Research on Personalization,” Management Science, 49 (10), 1344-1362
Nunnally, Jum C. (1978). Psychometric Theory. New York. McGraw-Hill, 2nd ed.
Oliver, Richard L. (1999), “Whence Customer Loyalty?” Journal of Marketing, 63 (Special Issue), 33-44.
Ostrom, Amy and Dawn Iacobucci (1995), “Consumer Tradeoffs and Evaluation Of Services,” Journal of Marketing, 59 (1), 17-28. Parasuraman, Anantharanthan, Valarie A. Zeithaml, and Leonard L. Berry (1985), “A Conceptual Model of Service Quality and Its
Implications for Future Research,” Journal of Marketing, 49 (4), 41-50.
Pine, B. Joseph II (1993). Mass Customization: The New Frontier in Business Competition, Harvard Business School Press, Boston, MA.
Pine, B. Joseph II, Don Peppers, Martha Rogers (1995), “Do You Want to Keep Your Customers Forever?” Harvard Business Review, 73 (2), 103-114.
Rust, Roland T. and Katherine N. Lemon (2001), “E-service and the Customer,” International Journal of Electronic Commerce, 5 (3), 85-101.
Sharma, Neeru and Paul G. Patterson (2000), “Switching Costs, Alternative Attractiveness and Experience as Moderators of Relationship Commitment in Professional Consumer Services,” International Journal of Service Industry Management, 11 (5), 470-490.
Sheth, Jagdish N., Rajendra S. Sisodia, and Arun Sharma (2000), “The Antecedents and Consequences of Customer-Centric Marketing,” Journal of the Academy of Marketing Science, 28 (1), 55-66.
Simonson, Itamar (2005), “Determinants of Customers’ Responses to Customized Offers: Conceptual Framework and Research Propositions,” Journal of Marketing, 69 (1), 32-45.
Singh, Jagdip and Deepak Sirdeshmukh (2000), “Agency and Trust Mechanisms in Consumer Satisfaction and Loyalty Judgments,” Journal of the Academy of Marketing Science, 28 (1), 150-167.
Sirdeshmukh, Deepak, Jagdip Singh, and Barry Sabol (2002), “Consumer Trust, Value, and Loyalty in Relational Exchanges,” Journal of Marketing, 66 (1), 15-37.
Solomon, Michael R., Carol Surprenant, John A. Czepiel, and Evelyn G. Gutman (1985), “A Role Theory Perspective on Dyadic Interactions: the Service Encounter”, Journal of Marketing, 49 (1), 99-111.
Srinivasana, Srini S., Rolph Anderson, and Kishore Ponnavolu (2002), “Customer Loyalty in E-Commerce: an Exploration of Its Antecedents and Consequences,” Journal of Retailing, 78 (1), 41-50.
Surprenant, Carol F. and Michael R. Solomon (1987), “Predictability and Personalization in the Service Encounter,” Journal of Marketing, 51 (2), 86-96.
Tam, Kar Yan and Shuk Ying Ho (2005), “Web Personalization as a Persuasion Strategy: An Elaboration Likelihood Model Perspective,” Information Systems Research, 16 (3), 271–291.
Tian, Kelly Tepper, William O. Bearden, and Gary L. Hunter (2001), “Consumers’ Need for Uniqueness: Scale Development and Validation,” Journal of Consumer Research, 28 (1), 50-66.
Thibaut, John W. and Harold H. Kelley (1959), The Social Psychology of Groups. New York/London/Sydney: Wiley.
Vargo, Stephen L. and Robert F. Lusch (2004), “The Four Service Marketing Myths: Remnants of a Goods-Based, Manufacturing Model,” Journal of Service Research, 6 (4), 324-335.
Verhoef, Peter C. (2003), “Understanding the Effect of Customer Relationship Management Efforts on Customer Retention and Customer Share Development,” Journal of Marketing, 67 (4), 30-45.
Vesanen, Jari and Mika Raulas (2006), “Building Bridges for Personalization: A Process Model for Marketing,” Journal of Interactive Marketing, 20 (1), 5-20.
Vilares, Manuel J., Maria H. Almeida, and Pedro Simões Coelho (2008), Comparison of Maximum Likelihood and PLS estimators for structural equation modeling. A simulation with customer satisfaction data, in Vinzi, V.; Chin, W.; Henseler, J.; Wang, H. (eds.). Handbook of Computational Statistics - PLS and Marketing, Heidelberg/New York: Springer (in print).
Vilares, Manuel J. and Pedro Simões Coelho (2004), “The Employee-Customer Satisfaction Chain in the ECSI Model,” European Journal of Marketing, 37 (11/12), 1703-1722.
Zeithaml, Valarie A., Leonard L. Berry, and Anantharanthan Parasuraman (1996), “The Behavioral Consequences of Service Quality”, Journal of Marketing, 60 (1), 31-46.
Appendix I. Measurement model
Table AI. Indicators of the measurement model
Latent Variable Indicators
Customization x11 “My company” offers me products and services that satisfy my specific needs (totally disagree to totally agree)
x12 “My company” offers products and services that I couldn’t find in another company (totally disagree to totally agree)
x13 If I changed between companied I wouldn’t obtain products and services as customized as I have now (totally disagree to totally agree)
Quality y11 Quality of products and services (very low to very high)
y12 Reliability of products and services (very low to very high) y13 Diversity of products and services (very low to very high)
y14 Clearness and transparency of information provided (very low to very high) y15 Global quality of the company (very low to very high)
Value y21 Evaluation of price given quality (very low to very high) y22 Evaluation of quality given price (very low to very high)
Satisfaction y31 Overall satisfaction (very dissatisfied to very satisfied)
y32 Fulfilment of expectations (falls short of expectations to exceeds expectations) y33 Distance to an ideal company (very far from the ideal to very close to the ideal)
Trust y41 Overall, I have complete trust in “my company” (totally disagree to totally agree) y42 When “my company” suggests that I buy a new product it is because it is best for my
situation (totally disagree to totally agree)
y43 “My company” treats me in an honest way in every transaction (totally disagree to totally agree)
Loyalty y51 Probability to choose “my company” again when buying new product or service (very unlikely to very likely)
y52 Probability to recommend “my company” if a friend or a colleague asked for your advice (very unlikely to very likely)
Figure 1. Conceptual model. H1+ H4+ H2+ H3+ H5– H6+ Customer Satisfaction Perceived Value Perceived Quality Customization Customer Trust Customer Loyalty
Figure 2. Conjoint effects of satisfaction, trust and customization on customer loyalty for banking and cable TV. banking -3.0 -2.5 -2.0 -1.5 -1.0 -0.5 0.0 0.5 1.0 1.5 -1 -0,8 -0,6 -0,4 -0,2 0 0,2 0,4 0,6 0,8 1 -3 -2 -1 0 1 Trust Loyalty Customization -3.0 -2.5 -2.0 -1.5 -1.0 -0.5 0.0 0.5 1.0 1.5 -3 -2,5 -2 -1,5 -1 -0,5 0 0,5 1 -3 -2 -1 0 1 Satisfaction Loyalty Customization cable TV -3.0 -2.5 -2.0 -1.5 -1.0 -0.5 0.0 0.5 1.0 1.5 -1,2 -1 -0,8 -0,6 -0,4 -0,2 0 0,2 0,4 0,6 -3 -2 -1 0 1 Trust Loyalty Customization -3.0 -2.5 -2.0 -1.5 -1.0 -0.5 0.0 0.5 1.0 1.5 -2,5 -2 -1,5 -1 -0,5 0 0,5 1 -3 -2 -1 0 1 Satisfaction Loyalty Customization