v.4, n.2, p. 117-129, ago. 1997
AND SOME RESEARCH
OPPORTUNITIES
Invited Paper
Ronald H. Ballou
Department of Operations Research and Operations Management Weatherhead School of Management Case Western Reserve University Cleveland, Ohio U.S.A.
Abstract
Business logistics is defined and reasons are given as to why it is a vital area of management. Political and economic trends are highlighted to show that it is even increasing in importance. Current research in business logistics is discussed with a focus on the design of the logistics network as it is aided by computer modeling. Research opportunities are identified to both improve modeling for network design and better specify the information inputs to the design process.
Key words: business logistics, survey, logistics network design.
1. Introduction
upply chain management, physical distribution, materials management, and even rhocrematics are names that have been given to the field of business logistics. Regardless of the name, business logistics is a vital area of management within most firms, whether they are manufacturing or service firms. Logistics has been defined by the Council of Logistics Management as
...the process of planning, implementing, and controlling the efficient, cost-effective flow and storage of raw materials, in-process inventory, finished goods and related information from point of origin to point of consumption for the purpose of conforming to customer requirements.
The stated mission for business logistics is
...to get the right goods or services to the right place, at the right time, and in the desired condition, while making the greatest contribution to the firm.
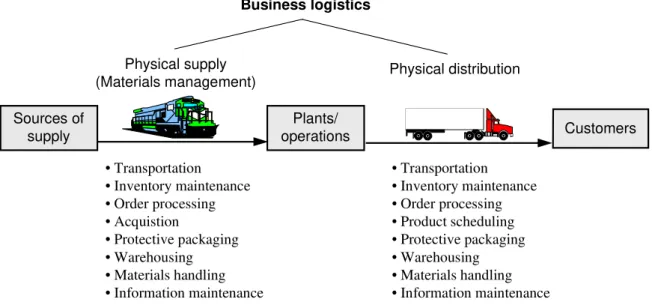
This mission is accomplished by careful management of those activities that significantly contribute to logistics customer service and that are in cost tradeoff with each other. The typical logistics activities are shown in Figure 1.
Physical distribution Physical supply
(Materials management)
Business logistics
Sources of supply
Plants/
operations Customers
• Transportation • Inventory maintenance • Order processing • Acquistion
• Protective packaging • Warehousing • Materials handling • Information maintenance
• Transportation • Inventory maintenance • Order processing • Product scheduling • Protective packaging • Warehousing • Materials handling • Information maintenance
Figure 1 - Typical Activities in a Firm’s Immediate Supply Chain
2. Importance of Business Logistics
ogistics is important because it creates valuevalue for customers and suppliers of the firm, and value for the firm’s stakeholders. Value in logistics is expressed in terms of time and
place. Products and services have little or no
value unless they are in the possession of customers when (time) and where (place) they wish to consume them. To many firms throughout the world, logistics has become an increasingly important value-adding process for a number of reasons.
2.1 Costs Are Significant
According to the International Monetary Fund, logistics costs average about 12 percent of the world’s gross domestic product. Examples of logistics costs within individual economies show variation. The United Kingdom has logistics costs of 16 percent of sales (MURPHY, 1972, p. 7). Japan has physical distribution costs of 26.5 percent of sales (KOBAYASHI, 1973, p. 9). Australia has estimated average physical distribution costs of 14.1 percent of sales (STEPHENSON, 1975). In the European
Economic Community, logistics costs were 21 percent on a value added basis (KEARNEY, 1987). In the United States, logistics costs for the typical firm are about 10.5 percent of sales (DAVIS & DRUMM, 1995). Depending on the particular industry, logistics costs may range from 4 percent of sales (pharmaceuticals) to over 30 percent of sales (food and food products). It has been noted that for many firms, after the cost of goods sold, logistics represents the highest cost of doing business.
The economic forces of change are further acting to alter logistics cost relationships and force careful replanning of logistics systems around the world. Trade barriers are falling as free trade is encouraged in countries that previously had strictly managed economies. Tariffs are being eliminated to allow the free flow of goods across political boundaries,
giving firms the opportunity to reposition their logistics networks for lower costs and higher customer service. Finally, the world economies seem to be on a wave of economic deregulation that will heighten competition. Since transportation is frequently a target for deregulation, logistics system costs will be affected.
2.2 Globalization of Industries
The trend is towards an integrated world economy. Firms are seeking, or have developed, global strategies where either their products are designed for a world market and they are produced wherever the low-cost raw materials, components, and labor can be found, or they simply produce locally and sell internationally. In either case, supply and distribution lines are stretched, as compared with the producer who wishes to manufacture and sell locally. Not only has the trend occurred naturally by firms seeking to cut costs or expand markets, but it is also being encouraged by political arrangements that promote trade. Examples are the formation of the European Economic Community (EC92), the signing of the North America Free Trade Agreement (NAFTA) between Canada, United States, and Mexico, and the creation of a new economic trade agreement among several countries of South America (MERCOSUL).
Globalization/internationalization of in-dustries everywhere will depend heavily on logistics performance and costs, as companies take more of a world view of their operations. As this happens, logistics takes on increased importance within the firm since logistics costs, especially the transportation component, become a significant part of the total cost structure. For example, if a firm seeks foreign suppliers for the materials entering its product or foreign locations to build its products, the motivation is to increase profit. Material and labor costs may be reduced, but logistics costs are likely to increase due to increased transportation and inventory costs. The tradeoff, as shown in Figure 2, may lead to higher profit by reducing materials, labor, and overhead costs at the expense of logistics costs and tariffs. Outsourcing adds value, but it requires more careful management of logistics costs and product flow times in the supply channel.
2.3 Logistics is important to strategy
Firms spend a great deal of time finding ways to differentiate their product offerings from those of their competitors. When management recognizes that logistics impacts on a significant portion of a firm’s costs and that the result of decisions made about the supply chain yields different levels of customer service, it is in a position to use this information effectively to penetrate new
markets, increase market share, and increase profits.
economies, and good product availability, it was at a disadvantage in being time responsive to customers. To overcome the disadvantage, the company developed a marketing strategy based primarily on logistics. Delivery time and its variability were at the heart of the strategy. First, a toll-free telephone number and 24-hour order taking were established so that customers could place their orders free of charge any
time of the day or night. Next, orders were filled the same day that they were received, even as late as 6:30PM. Finally, orders were shipped using an overnight delivery service such as FedEx. The result was that customers could place orders late in the day and receive them at their home or business by 10:30AM the next morning. The company was able to compete effectively on both price and service dimensions.
Profit G & A
Marketing
Logistics
Overhead
Materials
Labor
Tariffs
Overhead
Materials
Labor Logistics Marketing
G & A Profit Domestic sources Foreign sources
Figure 2 - Economic Benefit of Sourcing from Low-Cost Offshore Locations Rather then
from Higher-Cost Local Suppliers - Source: “International Logistics: Battleground of the
‘90s” (Chicago: A.T. Kearney, 1988)
2.4 Logistics Is Key to Customer Service
Research over the years has shown that logistics variables are dominant in the minds of customers when they evaluate the service offerings for a product; see STERLING & LAMBERT (1989), HARRINGTON & LAMBERT (1989), LALONDE & ZINSZER (1976), MARR (1994), BARITZ & ZISSMAN (1983), JACKSON et al.
(1986). Frequently, one-half of the customer service variables are logistics related and delivery time typically ranks the highest among all service variables. Since customers respond to a company’s service offerings with their patronage, revenues are a frequently determined by logistics variables.
2.5 Customers Increasingly Want Quick Customized Response
Customers have been increasingly sensitized to expect quick response to their
information on the Internet are examples of what customers might anticipate in the way of service from a wide range of product and service offerings. In addition, improved information technology and flexible manu-facturing systems have led the marketplace towards mass customization. Rather than
consumers having to accept the “one size fits all” philosophy in their purchases, suppliers are increasingly offering products that meet individual customer needs. This has placed growing demands on production and logistics systems to achieve ever higher performance levels.
3. Status of Logistics Research
ith the growing significance of logistics among the other activities of the firm, research has been conducted over a broad front to support and enhance logistics management. Research has ranged from quantitative modeling for decision making to philosophical works that set the tone for good logistics management. Within this range, one of the most important research areas has been the strategic planning of the logistics network. Network design involves establishing customer service levels, the deployment of inventories, the location of facilities, and the selection of the modes of transportation. It sets the structure that determines the overall level of logistics cost and customer service. Because it impacts on
a significant level of company costs and it affects the revenue-generating capabilities of the firm, logistics network design is typically of top management concern. Experience shows that good network redesign can save a company between 5 and 15 percent of its annual logistics costs.
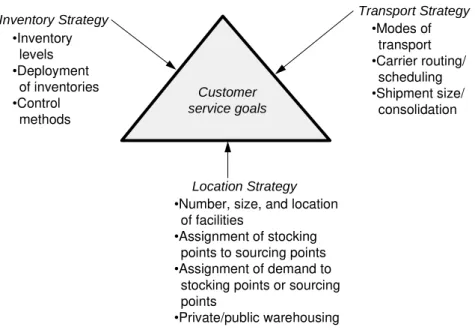
Logistics network design can be viewed as a triangle of logistics strategy (see Figure 3). Logistics customer service is the goal and the result of decisions made about the network design. Establishing the level of customer service to be achieved in turn defines the revenues to be generated through logistics activities. It also defines the combined effect of three structural variableslocation strategy, inventory strategy, and transportation strategy.
Customer service goals
•Modes of transport •Carrier routing/
scheduling •Shipment size/
consolidation
Transport Strategy
•Inventory levels •Deployment
of inventories •Control
methods
Inventory Strategy
•Number, size, and location of facilities
•Assignment of stocking points to sourcing points •Assignment of demand to
stocking points or sourcing points
•Private/public warehousing
Location Strategy
Figure 3 - The Triangle of Logistics Strategy
The three strategies are in tradeoff with each other. That is, a good location strategy is dependent on the manner in which inventories are managed and on the resulting inventory levels, and on the transportation service selected. Inventory levels are dependent on the number and location of facilities as well as the transportation service selected. And so the interdependence goes. Hence, a triangle of logistics strategy.
Logistics network design is based on three objectivescost minimization, capital minimization, and logistics customer service maximization. Not all of these objectives can be achieved simultaneously since they may be in conflict. For example, minimizing costs and simultaneously maximizing service are incompatible.
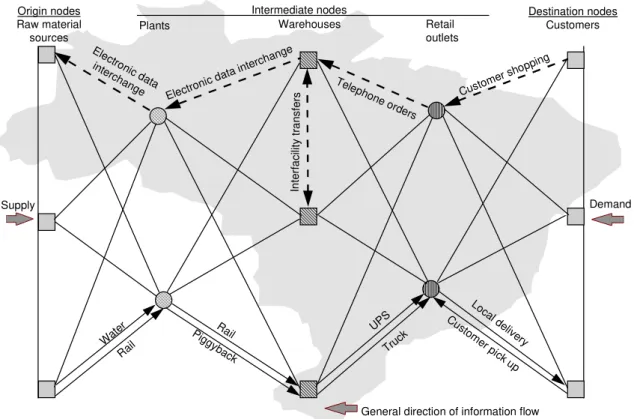
Research through the years, coupled with advancements in computer technology, has provided the capability to design logistics networks with the aid of mathematical modeling. This modeling is now so popular with consultants and managers that few networks are designed without the aid of such sophisticated tools (BALLOU & MASTERS, 1993, p. 83). The logistics network design problem is captured in the abstract diagram of Figure 4. The strategic questions revolve around locating the facilities intermediate to source and demand points, determining the modes of transportation, projecting the amount of aggregate inventory in the logistics system, and controlling the design impact on logistics customer service.
Supply Demand
Lo cal d
eliv ery Cu
stom er p
ick up
In
te
rf
a
c
ili
ty t
ra
n
s
fe
rs
UPS
Truc k
Wat
er Pig Rail
gyb ack
Rail
Electro nic data inte
rcha
nge Custome
r shopp ing
Destination nodes Customers Retail
outlets Warehouses
Origin nodes Raw material sources
Plants
Intermediate nodes
General direction of information flow
Electro nic dat
a interc hange
Tele phon
e orders
Figure 4 - An Abstract Diagram for a Logistics Network
Network models used commercially are generally of two types: mathematical programming and computer simulation. These models follow the two basic characteristics of the network planning
problemthe spatial and the temporal
3.1 Spatial Models
Spatial models have primarily been used to locate the facilities in the logistics network on a geographical plane. They answer such questions as: How many facilities are needed, where should they be located, and what size should they be? Logistics-related costs are minimized, or profits maximized, subject to geographical constraints on customer service and restrictions on facility capacities.
A survey of commercial-grade location model developers showed that deterministic approaches such as linear programming, mixed integer programming and heuristic methods were the methods of choice (BALLOU & MASTERS, 1993). Continuous location methods (e.g., center-of-gravity approaches) have been relegated to offering suggestions for possible locations within the deterministic algorithms. The reason for this would seem to be that the deterministic methods can handle most of the costs of location with a great deal of realism and also
that restrictions can be introduced that are not easily handled within the continuous framework. Much of the development in the last 20 years has focused on making location models more user-friendly, adding features that enhance communication, and adding programs that facilitate data conversion to model format. Extended solution capabili-ties, such as adding more echelons to the network and more facilities, source points, and customers to be analyzed, have resulted primarily from greater memory and computational speed of computers. Basic algorithmic development remains slow since the mid-1970s (for highlights on location model evolution in the last two decades, see GEOFFRION & POWERS (1995)), however, facility location remains an active area of research, probably because manage-ment continues to use these models and they help solve such an important problem to top management.
3.2 Temporal Models
When time becomes the important variable to be managed, as is the case when controlling inventories, choosing a trans-portation service, or scheduling product flow, computer simulation has been a good model choice. Such models permit the flow of product in the supply channel to be observed in simulated time. Complex product flow interactions among activities taking place between multiple echelons can be observed. Inventory levels, vehicle loading and shipping patterns, out-of-stock percentages and cost profiles are a few of the results obtained when the pattern of customer orders is placed on the simulated system. The extensive information detail for logistics channel simulators is generally not available in spatial models where products
are grouped, costs are averaged, and the time frame for analysis is from a month to a year.
4. Research Opportunities
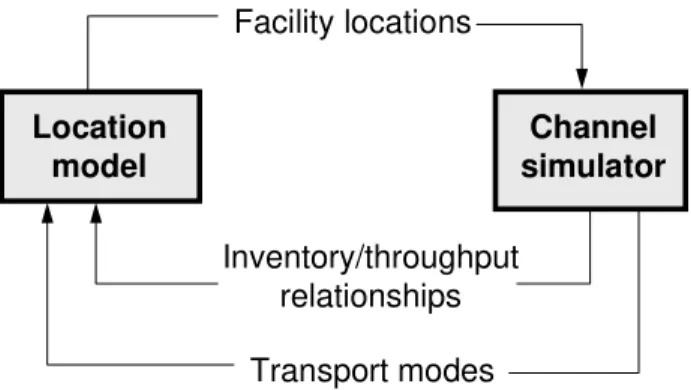
he spatial and temporal aspects of logistics network design have not been effectively merged into one solution platform, although it is possible to run such models separately and sequentially to converge on network solutions that satisfy both strategic and tactical dimensions. Neither a location model nor a channel simulator model by itself is a complete model for logistics network design. Location models rely on generalized inventory-throughput relationships and assumptions
about the methods of transportation used as inputs and give good results on location issues. On the other hand, channel simulators take facility locations as inputs and provide good results on inventory and transportation issues. The two models are inter-related, as shown in Figure 5. Research should be directed at bringing spatial and temporal dimensions together, probably within the location model framework since it is the most popular modeling platform.
Location
model simulatorChannel
Facility locations
Inventory/throughput relationships
Transport modes
Figure 5 - Inter-relationship Between Location and Channel Simulator Models
4.1 Logistics Customer Service
Perhaps the research needed most in logistics network design is to find methods for determining the relationship between the level of logistics customer service provided and the revenues generated by the firm. Current practice is to treat customer service as a constraint on network design and minimize costs subject to the constraint. However, the preferred practice is to maximize profit when both revenue and cost are variables, since the customer service level will be set at optimal based on economic factors. The network design can be quite different depending on the objective used, that is, profit maximization versus cost minimization.
Developing the revenue-logistics service relationship for a particular firm can be as difficult as determining the effectiveness of its advertising budget or other sales efforts. Some methods have been proposed, but none seems very satisfactory (BALLOU, 1992, pp. 94-96). For location models, the revenue-service relationship can be expressed as a price function where price declines as customers are farther from their sourcing points. For channel simulators, the appropriate variable might be customer order cycle time. Research could begin with the methods used for similar problems in marketing.
4.2 Inventory
Inventory represents a key economic factor in network design that forces consolidation of inventories into a small number of locations. There has been substantial research over the years on controlling individual product item inventory levels but relatively little about estimating inventory levels when there is more than one product item taken at a time. The practical concerns of network design require that many items be collected into product families and dealt with as an aggregate group. What is needed is to be able to estimate inventory levels as demand is assigned to facilities. The famous square-root rule (for a discussion of the square-square-root rule, see BALLOU (1992, pp. 447-449)) is a good, first approximation of inventory effects in network design which has been refined to include safety stock effects (BALLOU, 1981). However, these rules are
generally based on inventory control procedures formulated around the economic order concept. Estimating inventory levels based on other rules found in practice would be beneficial.
The relationship between inventory levels in facilities and the allocated demand to them is frequently nonlinear and concave. Since the solution platform for location models is typically linear or mixed integer programming, the nonlinear relationship causes computational difficulties. Better methods, besides decomposing the function into piecewise linear elements, are needed so that the inventory relationship can easily be incorporated into the computational process. Too often, the inventory consolidation effects of network design are computed outside of the solution process to avoid these computational difficulties.
4.3 Transportation
Two transportation problems arise in logistics network planning as a result of using mathematical programming to design the network. These are the handling of private trucking and the selection of transportation services.
When using a linear programming-based solution method for network planning, it is assumed that transportation between points on the network is one-way. For-hire transportation fits this assumption since rates are quoted between two specified points. However, when transportation involves more than one stop before the delivery vehicle returns to its depot, transportation costs may be in error. Since equivalent rates must be calculated for each transport leg from the multiple-stop routes, the stops (customers) on the route and the depot (facility) to which they are assigned
must be known. However, assigning customers to facilities is the result of the location analysis. Rates are a result of customer allocation and customer allocation depends on rates. Therefore, research needs to be conducted on combining transport routing and location-allocation analysis.
product volume flowing from a facility, the percentage (weights) of shipments by the various modes should change as the network
design is being calculated. This interdependence is an area for research in location models.
4.4 Location
The use of location modeling has been a dominant approach for logistics network design. At this point in time, the methodology which is based on linear programming concepts is well refined and quite robust in handling a wide range of practical network design problems. Problems having numerous product families, thousands of customers, hundreds of intermediate facilities, and 4 or more network echelons are routinely solved. Most of the relevant costs can be handled by the methodology. However, designers are always wanting to press the model’s limits which leaves opportunities for further research. Several of these are discussed below.
A problem not easily handled within the standard network model occurs when vendors, as opposed to plants, supply the network. Plants are usually represented by a location that can supply product up to its limit of capacity. In contrast, vendors supply only a portion of their total capacity to a particular firm’s network and ship to all intermediate facilities a percentage of that firm’s demand. In addition, a vendor may ship to the network from a number of locations. A network design involving many vendors generally takes place for retail
oriented companies. A network design problem occurs when optimization methodology will allocate to some vendors and not to others according to their costs and capacity limitations. The allocation results do not represent the actual flow patterns for the vendors. Adjustments are needed in the computational methodology.
Although logistics networks are designed primarily with the aid of mixed integer programming and heuristic (deterministic) procedures (BALLOU & MASTERS, 1993), there has been a resurgence of interest in continuous location methods such as the center-of-gravity approach to location. Users seem to like the feature that the continuous location model will give locational choices without preselection of candidate facilities, as is the case for deterministic methods. It is well known that it is difficult to obtain exact solutions to continuous models having multiple facilities and a rich environment of logistics costs and constraints. Currently, continuous location models provide candidate locations for deterministic models to further evaluate. Research might be directed at improving the continuous location models for commercial-grade use and integrating them into the deterministic methods for facility location.
4.5 Data Issues
Much can be said about the need for improved understanding of the data relationships that are presented to the network analyzers. Whereas a great deal of research has been conducted on the methods by which to design the network, very little attention has been given to data elements
network design, see BALLOU (1987) and BALLOU (1995)).
Transport rates can be presented to a network model as specific rates by particular mode between defined points in the network. For practical-size problems, this may involve millions of rates. Alternately, transport rate curves can be developed that can be used for estimating rates for various distances from a facility. These rate curves can be developed from a sample of the actual rates and are usually a function of distance alone. Although a linear relationship between rates and distance work well for the for-hire carriers, it is not clear that it is the best fit for small package shipments or full vehicle load rates. Non-uniformly applied discounts and tariffs potentially can distort the linear relationship. Research to find good rate relationships and project the error that is involved in such estimating procedures is needed (BALLOU, 1991).
Costs associated with facilities are available through accounting reports. For network analysis, the costs need to be separated into fixed, storage, and handling categories. Since the separation is arbitrary, the network design may be dramatically influenced by the cost allocation. For
example, while one analyst may view such costs as trash removal, fire protection, and telephone charges as variable with the volume flowing through the facility, others may see these as fixed costs. Of course, the number of facilities in a network may be greatly influenced by this arbitrary allocation of expenses. Expense allocation rules need to be tested to show just how they affect network design and developed to provide reasonable and consistent treatment of these facility expenses.
When thousands of customer locations are involved in the network design, it is practical to aggregate them into a smaller number of geographical clusters. This reduces the amount of data to be handled and the computational and computer memory requirements. Demand clustering can result in errors when estimating the transportation cost to customers, since the basis for transportation rates is the center of the clusters and not the actual location of each customer. Research has shown the number of clusters needed in a network design problem to control the transport costing error to a given percentage (BALLOU, 1994). More research is needed to find improved customer clustering algorithms to minimize the costing error.
5. Concluding Comments
usiness logistics is a vital area of management within most firms. Costs are a significant portion of sales, and logistics variables are often dominant in the company’s customer service mix. With trends that are occurring, such as growing international trade, increasing customers’ desire for quick customized response, and dismantling of trade barriers, a good logistics strategy has become ever more critical to maintaining a competitive edge and penetrating new markets.
References:
BALLOU, R.H.: “Information Considerations for Logistics Network Planning”. International Journal of Physical Distribution and Materials Management, Vol. 17, No. 7, pp. 3-14, 1987.
BALLOU, R.H.: “Logistics Network Design: Modeling and Informational Considerations”.
International Journal of Logistics Management,
Vol. 6, No. 2, pp. 39-54, 1995.
BALLOU, R.H.: “Estimating and Auditing Aggregate Inventory Levels at Multiple Stocking Points”. Journal of Operations Management,
Vol. 1, No. 3, pp. 143-153, February 1981.
BALLOU, R.H.: “Measuring Transport Costing Error in Customer Aggregation for Facility Location”. Transportation Journal, Vol. 33, No. 3, pp. 49-59, Spring 1994.
BALLOU,R.H.: “The Accuracy in Estimating Truck Class Rates for Logistical Planning”.
Transportation Research-A, Vol. 25A, No. 6, pp.
327-337, 1991.
BALLOU, R.H.: Business Logistics Management,
3rd edition, Prentice Hall, Englewood Cliffs, NJ, 1992.
BALLOU,R.H. & MASTERS, J.M.: “Commercial Software for Locating Warehouses and Other Facilities”. Journal of Business Logistics, Vol. 14, No. 2, pp. 71-107, 1993.
BARITZ, S.G. & ZISSMAN, L.: “Researching Customer Service: The Right Way”. Proceedings of The National Council of Physical Distribution Management, vol. II, New Orleans, pp. 608-619, October 25, 1983.
BOWERSOX, D.J.; HELFERICH, O.K.; GIMOUR, P.F.; MORGAN Jr. W., MARIEN, E.J.; LAWRENCE, M.L. & ROGERS, R.T.:
Dynamic Simulation of Physical Distribution Systems, East Lansing, MI: Division of Research, Graduate School of Business Administration, Michigan State University, 1972; PIPELINE MANAGER by Andersen Consulting.
DAVIS H.W. & DRUMM W.H.: “Physical Distribution Cost and Service 1995”. Annual Conference Proceedings, San Diego: Council of Logistics Management, p. 221, 1995.
GEOFFRION, A.M. & POWERS, R.F.: “Twenty Years of Strategic Distribution System Design: An Evolutionary Perspective”. Interfaces, Vol. 25, No. 5, pp. 105-127, September-October, 1995.
HARRINGTON, T.C. & LAMBERT, D.M.:
“Establishing Customer Service Strategies within the Marketing Mix: More Empirical Evidence”.
Journal of Business Logistics, Vol. 10, No. 2, pp. 44-60, 1989.
HESKETT, J.L.: “A Missing Link in Physical Distribution System Design”. Journal of Marketing, Vol. 30, pp. 37-41, October 1966.
JACKSON, D.W.; KEITH, J.E. & BURDICK, R.K.: “Examining the Relative Importance of Physical Distribution Service Elements”. Journal of Business Logistics, Vol. 7, No. 2, pp. 14-32, 1986.
KEARNEY, A.T. “Logistics Productivity: The Competitive Edge in Europe”. Chicago, 1987.
KOBAYASHI, I.: “Management of Physical Distribution Cost”. Proceedings of International Distribution Conference, Tokyo, p. 9, 1973.
LALONDE, B.J. & ZINSZER, P.H.: Customer
Service: Meaning and Measurement, Chicago:
National Council of Physical Distribution, 1976.
MARR, N.E.: “Do Managers Really Know What Service Their Customers Require?”. International Journal of Physical Distribution & Logistics Management, Vol. 24, No. 4, pp. 24-31, 1994.
MURPHY, G.J.: Transport and Distribution,
Business Books, London, p. 7, 1972.
RONEN, D.: “LSLLogistic System Design Simulation Model”. Proceedings of the Eighteenth Annual Transportation and Logistics
Educators Conference, Boston, pp. 35-47,
October 9, 1988.
STEPHENSON, A.R.: A Regional Survey of Physical Distribution Problems and Practice,
Productivity Promotion Council of Australia, pp. 7-10, 1975.
STERLING, J.U. & LAMBERT, D.M.: “Customer Service Research: Past, Present, and Future”.
LOGÍSTICA EMPRESARIAL — IMPORTÂNCIA E ALGUMAS
OPORTUNIDADES DE PESQUISA
Artigo Convidado
Resumo
Logística empresarial é definida e algumas razões são apontadas do porquê ela é uma área vital de administração. Tendências políticas e econômicas são evidenciadas para mostrar que ela está ainda crescendo em importância. A pesquisa atual em logística empresarial é discutida enfocando o projeto da rede logística e como ele é auxiliado por modelagem computacional. Oportunidades de pesquisa são identificadas para melhorar a modelagem do projeto da rede e melhor especificar as necessidades de informação para o processo de elaboração do projeto.