Jorge Miguel da Silva Calado
Licenciado em Engenharia Electrotécnica e de Computadores
A Framework for Students
Profile Detection
Dissertação para Obtenção do Grau de Mestre em Engenharia Electrotécnica e de Computadores
Orientador: Ricardo Gonçalves, Professor Associado com Agregação, FCT/UNL
Co-orientador: João Sarraipa, Professor Auxiliar Convidado, UNINOVA
Júri:
Presidente: Prof. Doutora Maria Helena Silva Fino
A Framework for Students Profile Detection
Copyright © Jorge Miguel da Silva Calado, Faculdade de Ciências e Tecnologia,
Universidade Nova de Lisboa.
A Faculdade de Ciências e Tecnologia e a Universidade Nova de Lisboa têm o direito,
perpétuo e sem limites geográficos, de arquivar e publicar esta dissertação através de
exemplares impressos reproduzidos em papel ou de forma digital, ou por qualquer outro
meio conhecido ou que venha a ser inventado, e de a divulgar através de repositórios
científicos e de admitir a sua cópia e distribuição com objectivos educacionais ou de
Acknowledgements
Thank you, Professor João Sarraipa, for the all the invaluable support, mentoring and guidance provided.
A word of appreciation is also due to Fernando Ferreira, Andreia Artifice, and Professor Ricardo Gonçalves for the assistance regarding this dissertation work and its integration in the ACACIA project, and to Educational Psychologist, Dra. Maria de Lourdes Mata, for the expertise given in the consultation of the developed framework.
I would also like to thank my friends, Daniel, Zé, Marta, Telma, Tiago, David, Teresa, Rita and André C., who volunteer as tributes to test and review this project, and to André S. who lent the webcam.
Abstract
Some of the biggest problems tackling Higher Education Institutions are students’ drop -out and academic disengagement. Physical or psychological disabilities, social-economic or academic marginalization, and emotional and affective problems, are some of the factors that can lead to it.
This problematic is worsened by the shortage of educational resources, that can bridge the communication gap between the faculty staff and the affective needs of these students.
This dissertation focus in the development of a framework, capable of collecting analytic data, from an array of emotions, affects and behaviours, acquired either by human observations, like a teacher in a classroom or a psychologist, or by electronic sensors and automatic analysis software, such as eye tracking devices, emotion detection through facial expression recognition software, automatic gait and posture detection, and others.
The framework establishes the guidance to compile the gathered data in an ontology, to enable the extraction of patterns outliers via machine learning, which assist the profiling of students in critical situations, like disengagement, attention deficit, drop-out, and other sociological issues.
Consequently, it is possible to set real-time alerts when these profiles conditions are detected, so that appropriate experts could verify the situation and employ effective procedures.
The goal is that, by providing insightful real-time cognitive data and facilitating the profiling of the students’ problems, a faster personalized response to help the student is enabled, allowing academic performance improvements.
Resumo
Alguns dos maiores problemas que assolam as Instituições de Ensino Superior são as desistências e a falta de motivação por parte dos estudantes. As incapacidades físicas ou psicológicas, marginalização académica ou socioeconómica, e problemas emocionais e afectivos, são alguns factores que podem contribuir para esses problemas.
Esta problemática é agravada pela falta de recursos educacionais, que consigam ligar as falhas na relação entre os professores e as necessidades afectivas destes estudantes.
Esta dissertação centra-se no desenvolvimento de uma plataforma, capaz de capturar dados analíticos, de uma selecção de emoções, afectos e comportamentos, adquiridos por observação humana, como por exemplo por um professor numa sala de aula ou por um psicólogo, ou por sensores electrónicos e software de análise automática, tais como dispositivos de eye tracking, software de detecção de emoções através de reconhecimento de expressões faciais, detecção automática do andar e da postura, entre outros.
A plataforma estabelece uma orientação para compilar a informação recolhida numa ontologia, para permitir a detecção de outliers dos padrões, através de técnicas de machine learning, para assistir à identificação de perfis de estudantes em situações críticas, tais como falta de motivação, falta de atenção, desistências e outros problemas sociológicos.
Consequentemente, é possível despoletar alertas em tempo real, quando estas condições dos perfis forem detectadas, para que os especialistas adequados possam verificar a situação e utilizar procedimentos eficientes.
O objectivo é, através da disponibilização de dados cognitivos em tempo real e da facilitação da detecção dos problemas dos estudantes, que seja possível uma resposta rápida e personalizada na ajuda ao estudante, possibilitando melhorias no desempenho escolar.
Contents Index
ACKNOWLEDGEMENTS ...V
ABSTRACT ... VII
RESUMO ... IX
CONTENTS INDEX ... XI
FIGURES INDEX ... XV
TABLES INDEX... XVII
LIST OF ABBREVIATIONS ... XIX
1 INTRODUCTION ... 1
1.1 DISSERTATION INTEGRATION –ACACIA ... 2
1.2 OBJECTIVES OF THE DISSERTATION ... 4
1.3 RESEARCH METHOD ... 4
1.3.1 Research Question ... 4
1.3.2 Hypothesis ... 4
1.4 DISSERTATION OUTLINE ... 5
1.5 ORIGINAL CONTRIBUTIONS ... 5
2 STATE OF THE ART ... 7
2.1 EMOTIONS ... 7
2.1.1 Components of Emotions ... 8
2.1.2 Emotion’s Recognition Devices ... 9
2.1.3 Human Observation and Coding of Emotions ... 9
2.2 EYE TRACKING ... 10
2.2.1 Commercial Eye Tracking Devices ...11
2.2.2 Emotion and Affect Analysis ...12
2.3 SKELETON BIOMETRICS USING KINECT AND EMOTIONAL STATE CORRELATION ... 13
2.4 FACIAL RECOGNITION SOFTWARE AND EMOTION RECOGNITION ... 14
2.4.1 Face Detection ...14
2.4.2 Facial Feature Extraction ...15
2.4.4 Example of an Algorithm... 15
2.4.5 Commercial Emotion Detection API’s and SDK’s ... 16
2.5 EXISTING TECHNOLOGIES FOR STUDENT’S MONITORING IN THE LEARNING ENVIRONMENT ... 19
3 STUDENT’S MONITORING KNOWLEDGE BASE ... 21
3.1 APPLICATION SCENARIO ... 21
3.1.1 Biometric Data Acquisition ... 22
3.1.2 Acquired Data Processing and Integrated Warning Platform ... 23
3.2 ONTOLOGY ... 24
3.2.1 Design ... 24
3.2.2 Affect, Behaviour, and Emotion Classes Properties... 27
3.2.3 Profiles ... 29
4 FRAMEWORK FOR STUDENT’S PROFILE DETECTION ... 31
4.1 FRAMEWORK DESIGN ... 31
4.2 ARCHITECTURE ... 33
4.2.1 Ontology ... 34
4.2.2 Knowledge Processor ... 36
4.2.3 Data Compiler Processor ... 38
4.2.4 GP3 Eye Tracker, Gazepoint Control and Eye Tracker Data Acquisition Processor…... ... 39
4.2.5 Webcam, Affectiva SDK and Emotions Data Acquisition Processor ... 41
4.2.6 Main GUI ... 41
4.2.7 Software Licenses and Hardware Requirements ... 43
4.2.8 Application Demonstration ... 43
5 PROOF-OF-CONCEPT PROTOTYPE ... 47
5.1 METHOD ... 47
5.1.1 Material ... 47
5.1.2 Participants ... 48
5.1.3 Apparatus ... 48
5.1.4 Procedure ... 49
5.1.5 Results ... 50
5.2 VALIDATION ... 54
6.1 FUTURE WORK ... 57
REFERENCES ... 59
ANNEX A – PAPER: AFFECTIVE COMPUTING TO ENHANCE EMOTIONAL
Figures Index
FIGURE 2-1 GABORS SELECTED BY ADABOOST FOR EACH EXPRESSION [41]. ... 16
FIGURE 3-1 SCENARIO FOR STUDENT AFFECTIVE MANAGEMENT ... 22
FIGURE 3-2 ONTOLOGY DIAGRAM ... 25
FIGURE 4-1 FRAMEWORK DIAGRAM ... 32
FIGURE 4-2 ARCHITECTURE DIAGRAM OF THE STUDENT’S PROFILE DETECTION PLATFORM ... 33
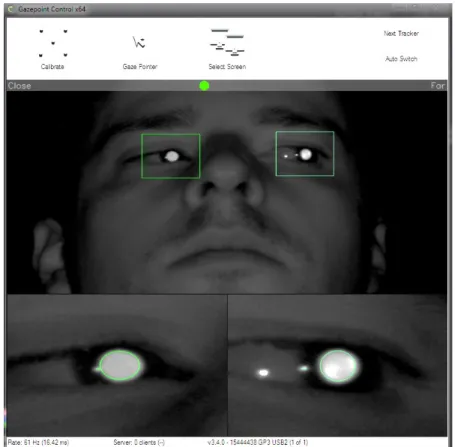
FIGURE 4-3 GAZEPOINT CONTROL ... 40
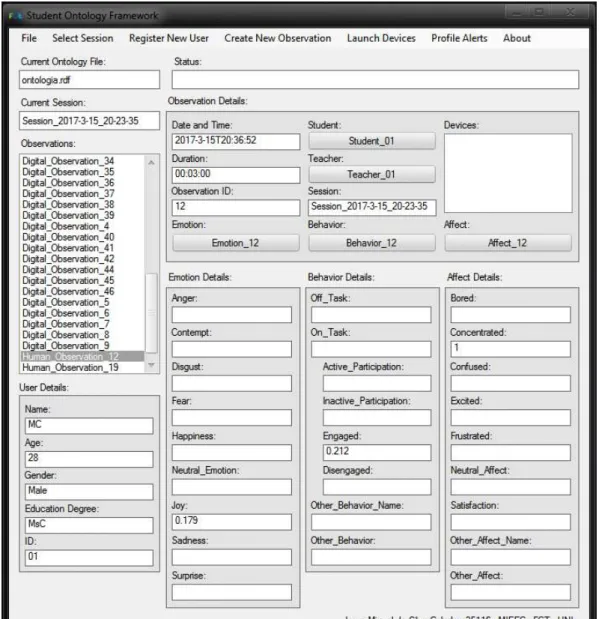
FIGURE 4-4 MAIN GUI ... 42
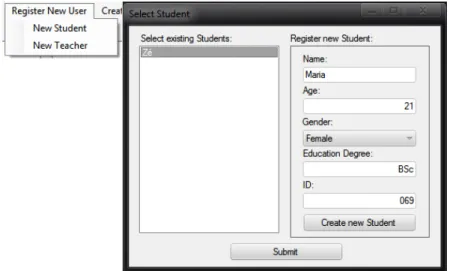
FIGURE 4-5 USER SELECTION/CREATION ... 44
FIGURE 4-6 SESSION SELECTION/CREATION ... 44
FIGURE 4-7 OBSERVATION SELECTION/CREATION ... 44
FIGURE 4-8 MANUAL REGISTRATION OF EMOTION, BEHAVIOUR AND AFFECT VALUES ... 45
FIGURE 4-9 DATA PROCESSOR MODULES ... 45
FIGURE 4-10 PROFILE ALERT ... 46
Tables Index
TABLE 2-1 LOW-COST EYE TRACKERS TECHNICAL SPECIFICATIONS AND FEATURES ... 11
TABLE 2-2 COMPARISON TABLE OF COMMERCIAL EMOTION DETECTION APIS AND SDKS ... 18
TABLE 3-1 PROPOSED PROFILE ALERT CONDITIONS ... 30
TABLE 5-1 EVALUATION OF PARTICIPANTS RESULTS ... 51
TABLE 5-2 AVERAGE VALUES MEASURED BY DIGITAL OBSERVATIONS ... 52
List of Abbreviations
3D – Three Dimensions
ACACIA – Apoyo, Refugio, Comunicación, Adaptación, Innovación y Enriquecimiento (Support, Refuge, Communication, Adaption, Innovation and Enrichment)
AdeLE – Adaptive e-Learning with Eye tracking API – Application Programming Interface
BROMP – Baker Rodrigo Ocumpaugh Monitoring Protocol
CADEP – Professional Educational Development and Supporting Centers
DSM-V – Diagnostic and Statistical Manual of Mental Disorders ECG – Electrocardiogram
EEG – Electroencephalogram EMG – Electromyography
EML or EmotionML – Emotional Markup Language GSR – Galvanic Skin Response
GUI – Graphical User Interface
HART – Human Affect Recording Tool HCI – Human Computer Interaction HEI – Higher Education Institutions HTTP – Hypertext Transfer Protocol
ICA – Index of Cognitive Activity
ICT – Information and Communication Technology IoT – Internet-of-Things
MSc – Master of Science
OWL – Web Ontology Language
POG – Point of Gaze
RDF – Resource Description Framework RDFS – RDF Schema
RGB – Red Green Blue
ROC – Receiver Operating Characteristic SDK – Software Development Kit SQL – Structured Query Language TCP – Transmission Control Protocol URI – Uniform Resource Identifier USB – Universal Serial Bus
1
Introduction
A growing problem in Higher Education Institutions (HEI) is the amount of student dropouts due to disabilities, emotional factors, and economic, social or academic marginalization. This is worsened by the lack of educational resources, among faculty staff, to meet the requirements affecting vulnerable students, and by the gap in communication among staff, educators and administrators.
The students’ cultural and social background is a strong influence in their educational
process, and can often lead to social exclusion and marginalization, in learning activities and community life, further reducing students’ will to learn and self-grow.
An adapted educational system which makes use of technology to aid teachers and students, allied with inclusive educational planning and policy-making, may help mitigate these problems.
In the recent decades, society shifted from a passive consumerism of information to an active producer and gatherer of knowledge, mainly due to the globalization of the Information and Communication Technologies (ICT). This shift in paradigm is more so evident in our education systems, where the integration and use of new technologies has been stimulated by governments worldwide [1].
In the United States, the National Education Technology Plan sets a series of recommendations for teachers, educators, faculty staff, researchers, policymakers, technology developers, community members and organizations, and learners and their families, in order to create a collaborative environment for technology enabled learning [2].
Technology-enabled environments can help improve the students learning procedure, facilitating the access to information and knowledge, adapting its content to the individual needs of each student, increasing the stimulus for learning, and easing the communication between the teacher and the learner, providing a scenario of equal opportunity for every student, open to a collaborative process.
This ICT integration in the learning environment has been accomplished in many ways, the most recognized being the virtual or online learning platforms, where numerous courses and degrees are available. Other examples are the use of electronic grade books, real-time feedback on teacher and student performance and learning games [4].
1.1
Dissertation Integration
–
ACACIA
The project ACACIA stands for Apoyo, Refugio, Comunicación, Adaptación, Innovación y Enriquecimiento (Support, Refuge, Communication, Adaption, Innovation and Enrichment) and is designed around the integration of experiences, resources, teams, problems and solutions in HEI.
The main goals of the project are the detection, prevention and eradication of several education problems in the HEI in South and Central America, such as school dropouts due to emotional factors, discrimination and marginalization by disparity or inequality, learning disabilities or communication gaps between involved members.
In order to achieve such goals, the intra- and inter-institutional cooperation in the development and production of educational and technological resources is needed. Using innovative technologies to complement educational processes, the development of social and emotional strategies for the population risking academic exclusion, is required. This is accomplished with new institutional organizations: the Professional Educational Development and Supporting Centers, named CADEP.
administrative staff of the institution, explore new teaching strategies and to utilize innovative information and communication technologies in didactic classes, stimulating the entrepreneurship between students and professors.
This dissertation work is integrated in the ACACIA project, more specifically in the Apoya module. This module has two components, the first one is technological and the second one is human.
The goal of the technological component is to implement an automated emotion detection system that allows to monitor and support students by providing automatic recommendations.
The human component seeks to educate, inform and divulge throughout the academic community, guidelines for the recognition and handling of persons in situations of exclusion (attention disorder, including disability, cultural differences, extreme emotional situations, etc.).
This module directly relates to all other development modules, providing valuable information to Empodera, Innova, Cultiva and Convoca. In the final design the module will be integrated in CADEP, and will communicate with Disemina. Disemina provides guidelines for the detection and execution of situations that may generate social exclusion attending the broadcasting actions to raise awareness, for apprehension and for the action.
Apoya has a set of tasks that are described as follows:
Task 1 – Automatic detection of affective states. The work focuses on the implementation of a system for detecting emotions, also defining a methodology for data collection and methodology for emotional labeling and system management.
Task 2 – Tracking and recommendations automation. This work deals with the automation of monitoring the student and the system that generates recommendations to help improve their academic level.
Task 3 – Promotion of multiculturalism and diversity. The objective of this task is to generate guidelines for the detection and recognition of people at risk of social exclusion, a guide for action (treatment, activities, visibility) and a system of courses to train university and technical personnel (teachers, administrative staff and technical supporters included).
1.2
Objectives of the Dissertation
The work presented in this dissertation focused in the creation and development of tasks 1 and 2. It begins with a study of the human emotions and their role in education systems, followed by possible application scenarios, the design, development and implementation of a framework, and respective aiding tools, that allow the gathering of students’ emotions and behaviours, and analyses the collected data to extrapolate suggestions and alerts, of problematic student profiles.
1.3
Research Method
The research method used in this dissertation follows the Classical Method, detailed in [5], with the resulting Research Question and Hypothesis:
1.3.1
Research Question
Can a technological solution capable of identifying users’ emotional state, which then through the help of the teachers be used to promote student’s motivation and consequently prevent school dropouts?
1.3.2
Hypothesis
1.4
Dissertation Outline
The outline of this dissertation document tries to follow the steps of the classical research method, beginning with a more theoretical overview and then shifting to a more practical one.
Chapter 1 – Introduction: In this introductory section, the motivation background and framework of the dissertation is presented, as well as the underlying
Research Question and the formulated Hypothesis;
Chapter 2 – State of the Art: In this section, a summary is made of the theory and technology available in the same research area, starting with an overview of the theories of Emotion and methods of observation, followed by an analysis of the eye tracking, gait recognition and facial expression detection technologies;
Chapter 3 –Students’ Monitoring Knowledge Base: This section presents the application scenario proposed, consisting of four case studies, and details the proposed ontology model, to serve as a knowledge base for the management of the students’ data;
Chapter 4 –Framework for Students’ Profile Detection: In this section, a
framework for monitoring and managing the students affects is proposed, and the architecture developed, for the implementation of such framework, is presented;
Chapter 5 – Proof-of-Concept Experiment: This section describes the method deployed and the implementation of the experiment, used to test the hypothesis. An analysis of the results is provided as well as the validation of the implemented work;
Chapter 6 – Conclusions: To finalize this document, the concluding remarks of the dissertation work are made, and the future work proposals are anticipated;
1.5
Original Contributions
Additionally, the application scenario, described in section 3.1, was developed in a collaborative process with the ACACIA project.
2
State of the Art
In this chapter, a review of the state of the art is made, regarding the main topics analysed in this dissertation. A general overview of the current understanding of emotions, and how influential they can be, is presented first, followed by a review of available contactless emotion detection systems and their usage, namely eye tracking, skeleton tracking and facial expression recognition.
2.1
Emotions
In our everyday life, emotions play a very important role in every action we make: in nonverbal communication, in the way we process information, in our attention, and our biases towards information [6]. This can all be influenced by our affective state, consciously or unconsciously [7].
Emotions are also one of the central keys in ensuring our survival, fear being one of the most common and recognizable emotion among us human and many other animals.
There is no scientific consensus on a single, clear definition of emotion, as many different theories use the term, either in a broader or narrower sense.
Sometimes the concepts of emotions, moods and feelings are confused and used interchangeably with no regard to their meaning variances.
In the narrow sense, an emotion is more commonly observed as a short, intensive, mental activity [8].
of time, is less intense, and is more consistent than emotions themselves, who can change rapidly.
It seems there is consensus, however, that some emotions (Anger, Fear, Sadness, Disgust and Enjoyment) are universal to all humans, despite the sociological or environmental background [10].
2.1.1
Components of Emotions
Scherer defines a core set of emotion components [11] that are commonly accepted, despite the lack of consensus on a model for what causes emotions, how they are classified, and how they are described (categorically or dimensionally).
Appraisals are the cognitive component that causes cognitive processes to evaluate events and situations in the genesis of emotions.
The physiological component accounts for the variation responses in the central and peripheral systems, and is responsible in the modulation of expressive features and in appearance changes (posture, skin colour).
Action tendencies are the behavioural component associated with the motor responses caused by appraisals.
The expression component covers the facial and vocal expressions, as well as body posture and gestures, generated by emotional responses.
Feelings are the subjective component, which are part of the complex phenomenon of the emotion.
Emotions Dimensions
Several models concur in defining emotions in different dimensions [12]–[14], as an attempt to conceptualize graphical representations of emotions’ taxonomies.
One of the more recent studies, proposes a factor structure with four dimensions, namely: - Valance, that ranges from Joy to Sadness (pleasant to unpleasant);
- Arousal, that ranges from Attention/Love to Anger/Hostile (passive to active energy);
- Dominance, that ranges from Interest/Self-Assurance to Fear/Anxiety (in control to lack of control);
2.1.2
Emotion’s
Recognition Devices
There are multiple platforms that make use of different bio-sensors, in order to analyse and determine a person emotional state. This is usually accomplished via invasive sensors like Electrocardiogram (ECG), Electroencephalogram (EEG), Electromyography (EMG), Galvanic Skin Response (GSR), Temperature and Respiration sensors.
Alternatively, some tools use facial recognition software to analyse basic and complex emotions. For example, the iMotions Platform (which also integrates other sensors data) uses two similar modules to achieve this. The first uses Affectiva’s AFFDEX algorithm, the second uses Emotient’s FACET algorithm, and both analyse facial expressions to determine human emotional reactions [15].
However, regarding an analysis environment, like a classroom, one fundamental problem can arise: If the student is aware that he/she is being monitored, his behaviour is going to reflect that, possibly leading to anxiety, insecurity, pretence or other states that disguise his regular emotional state, leading to inaccurate readings.
Thus, the need to conceal the measuring device from the student’s attention, or at least cause the smallest amount of discomfort and distraction, is desirable.
This means that, sensors that require contact with the user, can contribute to undesired disturbances in the measured emotions, as well as disrupt the performed activity, thus the choice of non-invasive technologies for this type of application.
2.1.3
Human Observation and Coding of Emotions
Usually two methods are used when assessing emotions analogically: either the person being analysed self-reports their belief of their current emotional state, or an independent trained observer reports the emotional changes observed.
While the self-evaluation of one’s current emotional state is subjective to the time it is made and by the emotional state itself, a biased observation can occur. On the other hand, an external observer can only register significant emotional changes, portrayed by the student, thus missing any internal feelings not expressed or possibly misread.
Baker Rodrigo Ocumpaugh Monitoring Protocol
The observations recorded using this method are often used to obtain ground truth labels for Educational Data Mining research.
Emotional Markup Language
Similar to BROMP observation method, an Emotional Markup Language (EmotionML or EML) [17] has been defined by the W3C Emotion Incubator Group, to serve as a general emotion representation language, usable in three different setups: the manual annotation of observed emotion data; automatic recognition of emotions; and in the generation of emotion related system responses.
2.2
Eye Tracking
An eye tracker is a device that measures the activity of a person’s eyes (position and movement), and is usually comprised of a head-mounted or a remote (desk mounted) apparatus.
Eye trackers are commonly composed by a light source (usually infrared or near-infrared) and one or more cameras pointed at the person eyes.
The use of an infrared light source is preferred due to the fact that it helps reduce the negative effects of ambient lighting conditions.
The light reflection on the cornea is then used to extrapolate the direction of the gaze, as it is the brightest spot in the pupil [18].
Other biometrics can also be measured by the eye tracker, such as:
- gaze fixation: the location where the gaze is maintained, for necessary amount of time for the eye to focus, when the visual input occurs;
- gaze duration: the amount of time for which a gaze is maintained; - scan path: the vectors set that represent the path of gaze;
- areas of interest: refers to designated gaze locations and the collected gaze statistics for each area;
- pupil size: variations occurring in the shape and diameter of the pupil; And various types of eye movements as well:
- smooth pursuit: the eye movement while following a moving object;
- vergence: the simultaneous movement of both eyes in opposite directions to obtain or maintain single binocular vision;
- vestibulo-ocular movements: reflex eye movement, in the opposing direction of the head movement, that preserves the image in the centre of the visual field.
2.2.1
Commercial Eye Tracking Devices
As eye tracking technology becomes cheaper over the years, solving acquisitions costs in under-developed markets, more applications are now possible as a result.
There are now many low-cost devices, such as the Visual Interaction’s myGaze tracker
(499€) [19], GazePoint’s GP3 tracker (461€) [20], The Eye Tribe’s Pro tracker (185€) [21], or
the Tobii’s EyeX controller (119€) [22]. These products announced features and specifications
are presented in Table 2-1.
Table 2-1 Low-cost eye trackers technical specifications and features
Company Visual Interaction
myGaze Gazepoint The Eye Tribe Tobbi Tech
Product myGaze Eye Tracker GP3 Eye Tracker EYE TRIBE TRACKER
PRO Tobii EyeX
Website http://www.mygaze .com/products/myg aze-eye-tracker/ http://www.gazept. com/product/gazep oint-gp3-eye-tracker/ https://theeyetribe. com/products/ http://www.tobii.co m/xperience/produc ts/
Prices €645.41 €461 €185 €119
Main Technical Specifications:
Sampling Rate 30Hz 60Hz 30Hz to 75Hz 60Hz
Gaze position
accuracy 0.5° 0.5° – 1° 0.5° – 1° N.A.
Precision 0.1° N.A. N.A. N.A.
Operating Distance 50cm - 75cm N.A. 45cm – 75cm 45-100cm Tracking
Range/Head motion (Width X Height at Distance):
32cm x 21cm at 60cm
25cm x 11cm at 65cm
50cm x 30cm at 65cm
40cm x 30cm at 65cm
Latency < 50ms N.A. < 16ms 15ms +/- 5ms
Tracking Technique Binocular N.A. Binocular N.A.
Calibration Mode 0/1/5 points 5 or 9 points 6, 9 or 12 points N.A.
Each tracker provides its own software and/or an API or SDK, to help analyse the metrics given by the trackers raw data.
The basic metrics include the 3D position of the eye and the Point of Gaze (POG). However, some trackers like the Eye Tribe don’t yet support the measurement of the pupil diameter due to the impossibility to evaluate the person distance to the sensor.
A pre-print, comparing the EyeLink 1000 with the Eye Tribe tracker, concluded that the velocity and trajectory of the saccadic movement cannot be accurately measured by the Eye Tribe tracker due to its lower frequency sampling [23].
Other devices like the myGaze (and possibly others) are not optimized for high resolution quantitative measurements of saccadic movements and fixations due to the camera’s low frame rate (30Hz).
In [24] the GazePoint GP3 proved to be unreliable in some users wearing glasses, also with small eye size persons, persons with glossy hair, or even direct sunlight. It was also concluded that the GP3 was not good for detecting character reading, but otherwise well suited for eye tracking studies.
The Gazepoint GP3 eye tracker was chosen to be used in this dissertation, because of the reported frame rate value of 60Hz, and because it was one of the few low-cost devices to report the pupil size.
2.2.2
Emotion and Affect Analysis
In the last decade, the potential of eye tracking has also been employed to detect emotional state and cognitive activity.
The EyeTracking, Inc. Workload Software uses a patented algorithm, the Index of Cognitive Activity (ICA), to analyse the pupillometry data and extract the cognitive activity signal.
The ICA measures pupil changes, filtering light reflexes that cause circular muscle activity, thus inferring the mental effort, thru radial muscles activity [25].
2.3
Skeleton Biometrics Using Kinect and Emotional State
Correlation
It is well known that human emotions can affect the person’s gait and locomotion [26]– [28].
In [29], 4 emotions were studied (anger, sadness, fear, happiness), and the resulting impact in locomotion was evaluated in intersegmental coordination patterns, amplitude of thigh elevation angles compared from those in neutral locomotion, intersegmental plane different orientations, and speed gait, concluding that emotions can be successfully recognized from the changes in locomotion.
In the recent years, the 3D mapping of the human body has been widely improved with the availability of low cost tracking devices (e.g. Microsoft Kinect).
Traditionally in computer vision, two distinct approaches can be used in the analysis of a person skeleton key points: marker-based and marker-less tracking.
While the use of markers, attached to the person’s body, and the use of multiple camera views, provides the more accurate results, a marker-less solution also yields reasonable performance values [30].
One marker-less solution is the use of different camera views to extract the person silhouette, so that a skeletal model can be fitted in. Another one can be achieved using
Microsoft’s Kinect 3D depth sensors, which use an infrared camera to gage the distance from
the camera to the tracking points.
Many scientific studies have demonstrated the feasibility of using the Kinect to measure spatial and gait parameters, such as walking speed, step length, gait symmetry among others [30]–[35].
In [35] the authors compared the measurement of walking speed, stride time and length against the well-established Vicon marker-based motion capture system, concluding that decent performance values can be achieved.
between upper body centroid and the centroids derived from different joints of upper and lower limbs, and feature selection and classification using Adaptive Neural Networks.
In [31] three classifiers were studied (Naïve Bayes, 1R, and C45), regarding their performance in gait recognition, concluding with 91% accuracy, using the Naïve Bayes classifier and requiring only 4 features to correctly identify a person: height, leg length, torso length and arm length.
2.4
Facial Recognition Software and Emotion Recognition
The human computer interaction has increased exponentially in the last decades, becoming more and more important in all activity sectors.
In order to improve these interactions, computers can now detect the user emotional state, which directly influences their actions and decision making.
This advance in computer vision was made possible by the evolution in automatic facial recognition systems and the developments in neural networks, in particular with the use of deep learning to make classifications and pattern analysis. Thus, emotion detection by facial expression recognition is now possible through image processing.
There are currently several algorithms based in the detection of image characteristics, that deliver, with reasonable accuracy, the analysis of the primary set of emotions (defined by Paul Ekman in the 1970s as anger, sadness, disgust, joy, surprise and fear [36], [37]), a few complex ones (neutral, contempt, puzzlement, confusion and frustration), and even some additional characteristics (valence, engagement, attention, expressiveness, negative and positive mood).
The majority of the algorithms analysed can be divided in three distinct stages: face acquisition, extraction of the desired facial features, and classification of the facial expression analysed.
2.4.1
Face Detection
Because pose angle and distance, scale changes and uneven illumination can be a problem, some algorithms require some sort of face normalization.
Some algorithms also process background separation and facial features separation before applying a face segmentation technique.
2.4.2
Facial Feature Extraction
For the Facial Feature Extraction process two distinct methods are used: Deformation Extraction and Motion Extraction.
Deformation extraction requires a baseline or a neutral face from which to compare against the facial actions, whereas Motion Extraction records the changes in facial expressions.
Several methods can to accomplish this feature extraction, such as neural networks, Gabor wavelets, differential images, 3D motion models, point distribution models, labelled graphs, feature tracking, parametric motion models, high gradient components, among others [39].
2.4.3
Emotion Classification
Usually two different approaches can be used in order to describe the identified emotion: facial affect detection and facial action unit detection [40].
The more common descriptors used in facial affect detection are the six basic emotions defined by Ekman (anger, sadness, disgust, joy, surprise and fear). For the facial action unit detection, one of the most popular methods for coding the facial actions is the Facial Action Coding System [37].
2.4.4
Example of an Algorithm
The study presented in [41], used a set of 313 sequences of images, with 640x480pixels in 8-bit grayscale. The face detection algorithm, a cascade of classifiers (each with a subset of Haar Basis functions), used scan patches of 24x24 pixels, classifying each as face or non-face. Between 2 and 200 subsets of filters were selected using a feature based on Adaboost. The best performance single-feature classifier was selected.
The facial expression classification was based on support vector machines (SVM). A combination approach, in which the Gabor Features chosen by Adaboost were used as a reduced representation for training SVM’s (AdaSVM’s) outperformed Adaboost by 3.8 percent points, and higher spatial frequency Gabors and higher resolution images, also improves performance.
White dots indicate locations of all selected Gabors. In figure Figure 2-1 each expression is a linear combination of the real part of the first 5 Adaboost features selected for that expression. Faces shown are a mean of 10 individuals.
Figure 2-1 Gabors selected by Adaboost for each expression [41].
2.4.5
Commercial Emotion Detection API
’
s and
SDK’s
Commercial emotion detection algorithms are difficult to obtain so, in order to make an overview, one must present the results provided by the companies.
iMotion is a biometric research laboratory where human behaviour is one of the major study areas. They developed an image processing platform, in cooperation with Emotient, capable of detecting human emotions, and connected this feature with other biometric sensors in order to improve the accuracy of their results. The company shares their findings to Affectiva which develops products based on iMotion’s developments [15].
Emotient’s product “FACET technology” intends to gain profound knowledge on human emotions reactions via facial expressions. The facial expression detection algorithm gives valence, action units and emotion channels. The company has since been bought by Apple. As such, information about this product is no longer disclosed.
Noldus FaceReader is a product able to do facial expressions analysis. The software had more than 10.000 images used for training and is capable of detecting the six basic facial expressions as well as neutral and contempt. It can also calculate gaze direction, head orientation and person traits. The software is used by more than 400 universities, research institutes and companies in many markets, such as consumer behaviour research, and psychology, among others [43].
nViso SA is a company that is also doing research in facial emotion recognition. The EmotionAdvisor is their main product and provides a scalable, robust and accurate artificial intelligence solution to measure emotional reactions. The company recently won the “IBM Bestseller Award 2015” during the “Success Made with Partners” conference, confirming the success combination between nVisio EmotionAdvisor and IBM Cloud Service [44].
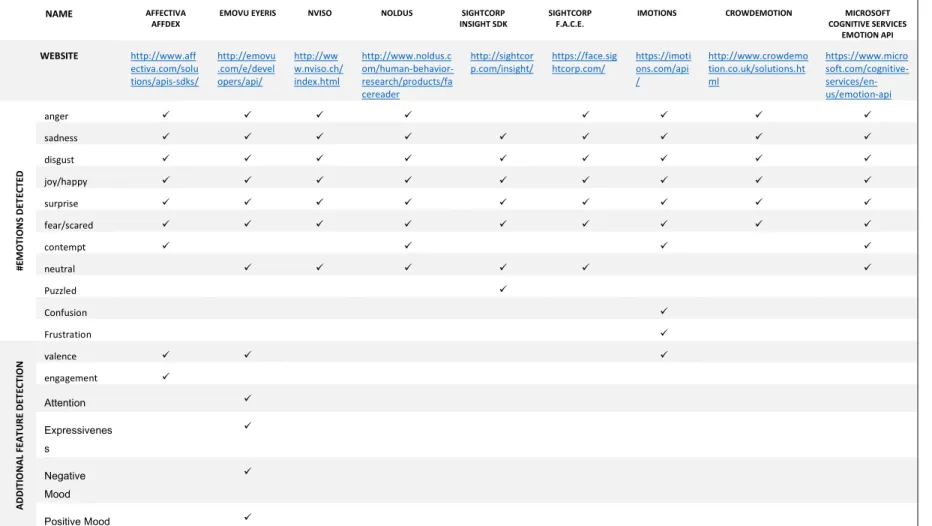
Table 2-2 Comparison Table of Commercial Emotion Detection APIs and SDKs
NAME AFFECTIVA AFFDEX
EMOVU EYERIS NVISO NOLDUS SIGHTCORP INSIGHT SDK
SIGHTCORP F.A.C.E.
IMOTIONS CROWDEMOTION MICROSOFT COGNITIVE SERVICES
EMOTION API
WEBSITE http://www.aff ectiva.com/solu tions/apis-sdks/ http://emovu .com/e/devel opers/api/ http://ww w.nviso.ch/ index.html http://www.noldus.c om/human-behavior-research/products/fa cereader http://sightcor p.com/insight/ https://face.sig htcorp.com/ https://imoti ons.com/api / http://www.crowdemo tion.co.uk/solutions.ht ml https://www.micro soft.com/cognitive- services/en-us/emotion-api #E M O T IO N S D E T E C T E D
anger
sadness
disgust
joy/happy
surprise
fear/scared
contempt
neutral
Puzzled
Confusion
Frustration
AD D IT IO N AL F E ATU R E D E T E C T IO
N valence
engagement
Attention
Expressivenes s Negative Mood
The different APIs detect different emotions. Table 2-2 provides a comparison between the software applications mentioned before and others less known. The table reveals the number of emotions that each application can recognize as well as some additional features.
The Affectiva SDK was chosen to be used in this dissertation, because of the higher number of emotional metrics reported, and because of it is free for individual research use.
2.5
Existing Technologies for Student
’s
Monitoring in the
Learning Environment
One of the biggest challenges that arise from the technology assisted learning environment, or e-learning, is the inability to create an emotional connection between the student and the teacher.
In order to assess the student level of understanding, a test needs to be performed afterwards. Contrasting with in-person learning, in which that appraisal can be done in real-time, by the teacher, enabling the detection of cognitive stress, comprehension difficulties, tiredness, among other problems [46].
By tracking eye and gaze position, fixation time and location, and blink rate, it is possible
to correlate these metrics to the student “level of attention, stress, relaxation, problem solving,
successfulness in learning, tiredness or emotions” [18].
The e5Learning platform uses pupil information, fixation duration and blink rate to recognize the user emotion, namely “high workload/non understanding” and “tiredness” [47].
Higher cognitive load has been correlated to occur when a student performs a search, with an increase in pupil size, and lower saccades and blinks. Pupil size is also larger, after highly arousing positive and negative stimuli, than after medium arousal with neutral stimuli [47].
One of the first projects to include this technology was “Adaptive e-Learning with Eye tracking” (AdeLE) [48], which analysed eye-movement patterns during learning and tried to link those patterns with cognitive processes.
In [49], the eye tracker is used to adapt presented content to the learner by following his topics of interest.
In [50], a empathic software agent interface was developed using an eye tracker, to infer the focus of attention and motivational status of the learner, responding with instructional behaviours and display of emotion.
The e5Learning learning environment recognizes basic emotion via an eye tracker, assessing “high workload”, “non-understanding” and “tiredness” situations in order to adapt content presentation in real-time [51].
3
Student’s Monitoring Knowledge Base
The prevention of HEI dropouts and other learning related problems, using a technological approach, is now possible with the multitude of emotion analysis systems available. Using the Internet of Things (IOT) paradigm, integrating several devices such as biomedical sensors, eye trackers and others, to collect information from the students, can support teachers in the identification and management of students’ emotional state, during classroom lessons.
In this chapter, a scenario for the monitoring of students’ behaviour and emotional state, using a technological support platform, is proposed, and an ontological model, designed to gather and manage student’s information as a knowledge base, is presented.
3.1
Application Scenario
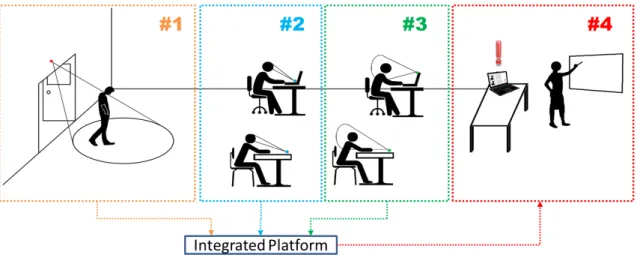
Figure 3-1 Scenario for student affective management
3.1.1
Biometric Data Acquisition
For this scenario three different capturing devices can be used: a Kinect, an Eye Tracker and a Camera, each described in the corresponding case study.
Case #1: Gait and Posture Analysis while entering or leaving the classroom.
This case study implementation will use a 3D motion capture device, composed by an RGB camera and an infrared depth sensor (i.e. the Kinect device), to track the student skeleton key points, in order to analyse its posture and gait, while entering and leaving the classroom.
It is expected with this observation, that a change in one student regular gait can be flagged as a signal for changes in determined emotional states.
Case #2: Eye Tracking while sitting at a desk.
This case study will use a remote Eye Tracking device, which is generally composed by an infrared light source, an infrared or near-infrared camera and an RGB camera. The Eye Tracker sits in the desk, directed at the student, and tracks head movements as well as eye movements (saccades, smooth pursuit, vergence and vestibulo-ocular movements, gaze fixations and eye blinks), and pupil’s size and dilation changes (proven to be an indicator of cognitive activity).
Case #3: Automatic Emotion Detection through Facial Expressions, while sitting at a desk.
This case study will use a regular RGB camera, pointed at the student’s face, in order to record the changes of the facial expressions.
An algorithm will detect and isolate the face, then extract the facial features collected, analyses the classified facial expressions, and determines the correspondent emotion or emotions.
Both eye tracking and facial expression emotion detection case studies can be deployed to a student using a computer, alongside with the sensorial device, or without the computer and just the device.
3.1.2
Acquired Data Processing and Integrated Warning
Platform
All the data recorded in the previous cases is to be collected and processed in real-time, and will be compiled creating an emotional map, that can be analysed to flag potential problematic situations of disengagement, attention disorder, learning difficulties, emotional stress, HEI dropouts, and possibly other situations.
Case #4: Integration Platform
3.2
Ontology
An ontology consists in a formal representation of concepts in a domain of discourse, called classes, the properties of this entities, and the relationships between them, called restrictions.
Alongside with the individual instances of classes, the ontology forms a knowledge database. Thus, it is used to manage all the knowledge of the proposed scenario.
The Web Ontology Language (OWL) [52] is a language schema, designed to represent this relational database, storing this concepts, their meaning, and how they relate to each other, in tables. It works as a layer above Resource Description Framework (RDF) [53] and RDF Schema (RDFS) [54], which in turn are a layer above Triples (the codification of semantic data in the form of subject–predicate–object) and Uniform Resource Identifiers (URIs).
Additionally, it allows reasoning over the ontology to infer implicit knowledge, even if it has not been specified.
3.2.1
Design
The ontology used was designed with Protégé 3.5 [55], [56], an older version that, although the lack of support for OWL 2 [57] and some outdated features, is much simpler to learn and to use. Additionally, it is always possible at any moment, to use it in newer versions, enabling it to all the existent capabilities. For the specific future usage of it, such evolution could be necessary.
Figure 3-2 is a diagram representation of the ontology model used to build the framework. The graphical representation used is based on a graphical representation tool of OWL ontologies, called VisioOWL [58].
Some classes have data type properties, represented in green, that help define each class individual.
Relationships and rules between classes are represented as object properties, in blue, and they provide the meaning between this classes.
There are six primary classes that represent the focus of the framework data input: User, Session, Observation, Affect, Emotion and Behaviour.
The proposed workflow of the data input in the framework follows the following principles:
– The first ontology individual to be created should to be of the class User, specifically a Student, given the inferred rule that any of the remaining primary classes require a relationship with at least one Student.
– The User class serves the purpose of storing the user personal details, and there can be two different types of Users: subclass Student and subclass Teacher, the Student being the target to be analysed by the framework, and the Teacher being a possible means of collecting observation data from a Student.
– Next a Session can be created, requiring at least one Student individual to be associated. It is also associated with one or more Observations individuals that are recorded during the Session duration, meaning that during one session, multiple observations can be recorded. This class represents a timeline in which the Student Observations were recorded, such as a classroom during a lecture, or a e-learning lecture.
– Then Observations can be made. This class requires exactly a Student and a Session to exist and that exactly one of each is associated with the observation. It is also required that, at least one of three classes (Affect, Behaviour or Emotion) and at the most one of each is associated.
Three types of Observations direct subclasses can be created: Human_Observation, Digital_Observation and Profiles.
Human_Observations represents the observations collected via the teacher or an expert input, and therefor require the link with exactly one Teacher individual.
Digital_Observations on the other hand, represents the observations collected via hardware or software devices that target the student.
– Finally, the triple twin classes, Affect, Behaviour and Emotion, each require to be connected to an existing Observations individual, and are the representation of the key input data, collected from either a digital device or a teacher, required to assess and profile the student.
Each of these classes have a set of defined data properties that are used to store the float values of the respective property, and it is required that at least one and at the most one of each exists for the respective class individual to be considered a valid input.
A more detailed explanation into each of these three twin classes and their properties is provided in 3.2.2.
3.2.2
Affect, Behaviour, and Emotion Classes Properties
It is important to note that, since there is no scientific consensus in the definitions of emotion and affect, with both terms being used, in some cases with the same connotation, with exchanging meaning, or with different purposes, in the presented work a clear distinction is made between emotion and affect: it is considered that an emotion is a person’s internal state of being, while affect is considered to be the body physical reaction to an emotion or emotional event.
The initial idea for affect and behaviour properties was to provide a similar tool to BROMP, Human Affect Recording Tool (HART) [16], which is a “momentary time sampling method in which trained, certified observers record students’ behaviour and affect individually”. BROMP utilizes several affect and behaviour coding schemes, related to the students’ engagement and their relationship with their learning environments, and its more common use is to obtain ground truth labels for Educational Data Mining research.
Just like the HART tool, the developed framework also allows to record these observations simultaneously, due to the apparent independency between affect and behaviour.
Affect Coding Scheme
Bored: when a student appears to feel tedious/lacking interest about the activity he/she is participating in.
Concentrated: the student is engaged, paying attention and focusing in a task.
Confused: when a student appears to have difficulty understanding a concept of a received information or an activity he/she needs to perform.
Excited: the student is in a restless or agitated state, in the execution of the current task. Frustrated: if a student feels distressed, annoyed or incapable to accomplish the assigned task.
Neutral_Affect: when the student shows no signs of affect that may influence his/her engagement in the current activity.
Satisfaction: the student shows enthusiasm in the execution of the current task, indicating a pleasurable experience.
Other_Affect: used to describe an affect not listed in this coding scheme.
Behaviour Coding Scheme
Off_Task: the student is not working on the activity assigned by the teacher. On_Task: the student is doing the task he/she is supposed to be doing.
Active_Participation: the student is actively involved in the activity, showing work in its execution. The student needs to be On_Task to be able to be in Active_Participation.
Inactive_Participation: the student is involved in the activity, but shows no clear signs of his/her contribution. The student needs to be On_Task to be able to be in Inactive_Participation.
Engaged: the student is willingly working/learning, despite any difficulties in doing so. For the student to be Engaged he/she needs to be On_Task and can also be either in Active_Participation or in Inactive_Participation.
Disengaged: despite participating in the task, the student shows a clear disconnection to it, is uninterested in its execution and/or is in unwillingly to learn from it. For the student to be Disengaged he/she needs to be On_Task and can also be either in Active_Participation or in Inactive_Participation.
Emotion Coding Scheme
The coding scheme used for emotions followed the range of emotions reported by the various softwares of automatic emotion recognition through facial expressions. Thus, and to ensure the framework remains compatible with any automatic emotion recognition software, the definition of usage, of each of the emotions categorised, is relegated to the provider of the referred emotions’ classification (either the specific software or the human observer).
The list of coded emotions is the following: Anger, Contempt, Disgust, Fear, Happiness, Joy, Neutral_Emotion, Sadness and Surprise.
3.2.3
Profiles
The four profile classes presented, named Attention_Disorder, Sociological_Issue, Drop_Out and Other_Profile, are intended to be used as the knowledge variables, representing the conditions necessary to trigger the respective profile alert.
The Other_Profile is a class open to expand the existing profiles to future work developed using this framework.
Attention_Disorder
Attention deficit hyperactivity disorder is usually regarded as having three main characteristics: hyperactivity, impulsivity and inattention. The fifth edition of the Diagnostic and Statistical Manual of Mental Disorders (DSM-V) defines it as a "a persistent pattern of inattention and/or hyperactivity-impulsivity that interferes with functioning or development" [59]. It also states that in adults (17 years and older) five or more symptoms (of the total 18 listed) are required to be observed for at least 6 months.
Sociological_Issue
Oppositional defiant disorder is defined by the DSM-V as "a pattern of angry/irritable
mood, argumentative/defiant behaviour, or vindictiveness” [59]. Again, at least four symptoms
from any of these categories (angry and irritable mood; argumentative and defiant behaviour; or vindictiveness) must be observed for at least 6 months.
Drop_Out
common sense. The same process was used for the sociological issues (which can cover a broad range of particular situations).
Proposed Profile Detection Conditions
Since the objective with these observations is to assist teachers and faculty staff with the
early detection of possible student’s problems, and not with the diagnosis of said problems, a set
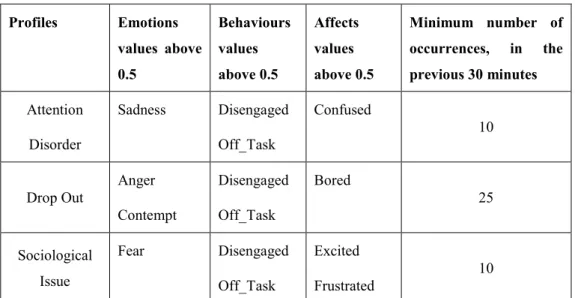
of conditions are proposed in Table 3-1, to serve as minimum requirements to create alerts, related to the possibility of the student having the described profiles.
Table 3-1 Proposed Profile Alert Conditions
Profiles Emotions
values above
0.5 Behaviours values above 0.5 Affects values above 0.5
Minimum number of
occurrences, in the
previous 30 minutes
Attention
Disorder
Sadness Disengaged
Off_Task Confused 10 Drop Out Anger Contempt Disengaged Off_Task Bored 25 Sociological Issue
Fear Disengaged
Off_Task
Excited
Frustrated
10
4
Framework
for Student’s Profile Detection
In this chapter, a framework is proposed, to streamline student’s data acquisition from an array of devices, to generate and manage a knowledge base, defined in section 3.2, intended to assist in the detection of profiles, related to student’s problems.
The architecture used for the implementation of the framework, as well as each module description, is also presented.
4.1
Framework Design
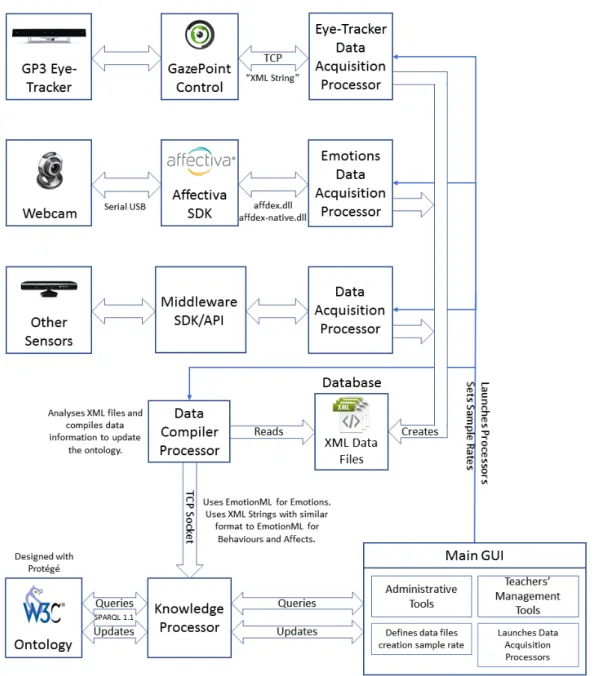
The proposed framework, illustrated in Figure 4-1, consists in a multi-level platform,
encompassing hardware sensors, their respective middleware, SDK’s or API’s, data processors,
an ontology, a file database and a graphical user interface (GUI).
The framework main goal is the storage standardization of the data, collected from the student, enabling the compatibility with any device, supporting multiple devices in real-time.
The secondary goal is to provide a platform that analyses and processes the collected information, extracting knowledge from the student data, to extrapolate possible profiles of
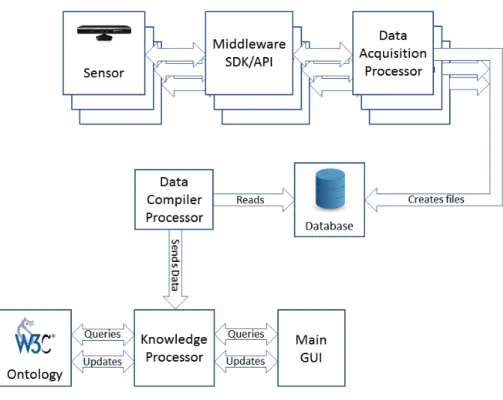
Figure 4-1 Framework Diagram
The first data entry point is through a sensor, collecting the student biometric data. Usually the sensor is accompanied by a custom software, an SDK or an API, that is used to connect to the sensor and convert its signals into biometric data.
This biometric data will then be processed in a Data Acquisition Processor, that compiles it into the appropriate format and saves it to files in a database.
A Data Compiler Processor will scan the database for new files and, for each file, compile the data average results into a single set of knowledge, which is sent to the Knowledge Processor.
The Knowledge Processor is responsible for the handling of all the knowledge being queried and updated into the Ontology, whether it comes from the Sensor-Data Compiler Processor chain, or from the second data entry point, the Main GUI. It is also responsible for the activation of the profiling alerts in the Main GUI.
The Main GUI presents the user (e.g. the teacher) with a set of tools to insert new information in the Ontology, to consult the existing knowledge and to manage the Data Processor’s settings.
4.2
Architecture
This section presents the architecture developed, as the proposed implementation of the framework described in section 4.1.
The conceptual model presented offers a structural overview of the system components and the behavioural relationship between them, as shown in Figure 4-2.
Unfortunately, due to timing constrains, the implementation of a module containing the case study #1, proposed in section 3.1.1, was not feasible, and will be an option for future work.
4.2.1
Ontology
For the implementation of the platform ontology, a variety of .Net C# library API’s were analysed: RDFSharp [61], OwlDotNetApi [62], LinqToRdf [63], OWL API .NET [64], and dotNetRDF [65].
A .Net C# library API was chosen to manage the ontology, contrary to the more traditional/common approach of using the Java framework Apache Jena [60], to keep all the coded programs in the same language, and to enable the seamless integration across applications and processes.
DotNetRDF was chosen because it provides almost the same functionalities as Jena (except OWL reasoning, for now), it is one of the most commonly used RDF/Triple Store libraries in C#, and it has the more detailed documentation of all.
The dotNetRDF API allows to manage, parse, read and write OWL and RDF files, as well as Graphs and Triple Stores, offers several engines for reasoning RDFS, Simple Knowledge Organization System (SKOS) [66], N3 Rules [67] and Triple Stores, and also several processors for SPARQL queries [68] and for SPARQL 1.1 updates [69], [70].
Two important functions were created to handle SPARQL queries (SparqlQuery) and SPARQL updates (SparqlUpdate), respectively.
Each with similar behaviour: receive the ontology graph and a command string containing the SPARQL query or update, as input parameters. The SparqlQuery then returns a string array with the query results and the SpaqlUpdate updates the ontology graph, while also saving it to a predefined RDF file.
Since many query and update commands are used more than once, all the commands used in the platform are set as constant strings or as static string returning functions with string(s) input(s), for commands that have fields with variable names. This allows the possibility to create an easy access library with these functions (OntoFunctions.cs).
SPARQL Query Example
PREFIX onto: <http://www.owl-ontologies.com/Ontology1480873742.owl#> PREFIX rdf: <http://www.w3.org/1999/02/22-rdf-syntax-ns#>
PREFIX rdfs: <http://www.w3.org/2000/01/rdf-schema#> PREFIX owl: <http://www.w3.org/2002/07/owl#>
PREFIX xsd: <http://www.w3.org/2001/XMLSchema#>
SELECT ?z WHERE {
?y rdfs:subClassOf* onto:Observations . ?x rdf:type ?y .
FILTER regex(str(?x),'Observation_Ind','i') . ?x onto:Has_Student ?z .
}
All query commands start with a set of prefixes for the namespaces used by the queries. Following the prefixes, most queries start with the “SELECT” statement, which serves a similar purpose to its Structured Query Language (SQL) counterpart: defining which variables are returned by the query (“?z” in this example).
The “WHERE” clause is where the values and variables being queried are defined.
In the example, the line “?y rdfs:subClassOf* onto:Observations .” is a triple, formed by a
subject, “?y”, a predicate, “rdfs:subClassOf*”, and an object, “onto:Observations”.
If any of the triple elements is a variable, it is preceded by a “?”.
As such, the query result of this line would be all the sub-classes of the class Observations, defined in the ontology used, and would be returned to the variable “y”.
The following line, “?x rdf:type ?y .”, would return all the individuals of each sub-class in
the variable “y”, to the variable “x”.
The “FILTER regex(str(?x),'Observation_Ind','i') .” would then filter the individuals in the
variable “x”, leaving only the individual with the name matching “Observation_Ind”, in the
variable “x”.
Finally, “?x onto:Has_Student ?z .” would return the Student individual, listed in the
Has_Student object property, of the “Observation_Ind” individual, to the variable “z”.
SPARQL Update Example
The insertion of new knowledge in the ontology is accomplished using SPARQL updates, such as the following example, which inserts a new student individual and the respective properties in the ontology:
PREFIX onto: <http://www.owl-ontologies.com/Ontology1480873742.owl#> PREFIX rdf: <http://www.w3.org/1999/02/22-rdf-syntax-ns#>
PREFIX rdfs: <http://www.w3.org/2000/01/rdf-schema#> PREFIX owl: <http://www.w3.org/2002/07/owl#>
PREFIX xsd: <http://www.w3.org/2001/XMLSchema#>
onto:Student_id rdf:type onto:Student .
onto:Student_id onto:Name "Name"^^xsd:string . onto:Student_id onto:Age "Age"^^xsd:int . "
onto:Student_id onto:Gender "Gender"^^xsd:string .
onto:Student_id onto:Education_Degree "Education_degree"^^xsd:string . onto:Student_id onto:Student_ID "Student_id"^^xsd:int .
}
Just like in a SPARQL query command, an update command also is preceded with the set prefixes to be used.
The “INSERT DATA” operation contains the triples to be added to the ontology graph. In this example, the Student individual triple is inserted first, followed by triples of the values of the data properties: Name (string), Age (integer), Gender (string), Education_Degree (string) and Student_ID (integer).
4.2.2
Knowledge Processor
The platform input data can be received from any type of sensorial device, through Transmission Control Protocol (TCP) socket communication.
TCP socket programming was chosen over Windows Communication Foundation, Hypertext Transfer Protocol (HTTP) Web Services and named pipes, due to the easiness of using asynchronous socket programming (using Microsoft .NET Framework 4.5), for client-server systems.
The TCP socket client-server communication follows the stated protocol:
The Data Compiler Processor must establish a TCP socket connection to the specified IP and port of the machine running the platform, which must be in the same LAN of the device.
After the connection is established successfully, a string with the following parameters must be sent: “Connect_Request”.
This prompts the platform Main GUI, to pop-up a window, asking the user (e.g. teacher) to select or create the observed student and the session in which to record the data to be received next.
![Figure 2-1 Gabors selected by Adaboost for each expression [41].](https://thumb-eu.123doks.com/thumbv2/123dok_br/16567558.737858/38.892.274.619.340.644/figure-gabors-selected-adaboost-expression.webp)