Cátia Isabel Martins Moreira
Licenciada em Engenharia Informática e de Computadores
A DSL for querying Building Data Streams of Energy,
Weather and Occupation Data
Dissertação para obtenção do Grau de Mestrado em Engenharia Informática
Orientador: Vasco Amaral, Prof. Auxiliar, Universidade Nova de Lisboa
Co-orientador: Paulo Carreira, Prof. Auxiliar, Instituto Superior Técnico
Setembro, 2014
Júri:
Presidente: Prof. Doutora Maria Armanda S. Rodrigues Grueau
Arguente: Prof. Doutor Rui Neves Silva
i
A DSL for querying Building Data Streams of Energy, Weather and Occupation Data © Copyright
Cátia Isabel Martins Moreira
i
Arriving at one goal is the starting point to another.
i
A
CKNOWLEDGEMENTS
First of all I would like to thanks to my parents for all their endless help and support, since I probably would not be at this stage of my career without their advice and encouragement.
To my boyfriend/colleague João Taborda with whom I always could discuss my implementation problems, who calmed me down when problems arose and to whom I must thank for helping me to complete this thesis. Thank you for accompanying me in this journey.
iii
R
ESUMO
O consumo supérfluo de energia é visto pela sociedade moderna como um problema Sócio- Económico e Ambiental dos dias atuais, agravada pelo aumento anual dos preços de energia. Também é de salientar que as pessoas, não proficientes em tecnologias, têm dificuldades em determinar onde é possível poupar, devido à ausência de mecanismos que sensibilizem para este problema.
Uma das preocupações do utilizador em relação à poupança de energia é a possibilidade de fazer a mesma atividade com todo o conforto e a mesma eficiência de trabalho. As técnicas mais utilizadas para controlar o consumo de energia baseiam-se em utilizar equipamentos menos dispendiosos, alterar o programa de funcionamento dos equipamentos para modos mais económicos ou desligar os aparelhos que estão a efetuar atividades desnecessárias. No entanto, não há um retorno de informação verdadeiramente contextual e informativa sobre as ações realizadas e, portanto, o utilizador não sabe o quanto é que essas técnicas influenciaram a sua fatura no final no mês.
A fim de dar algum controlo ao utilizador sobre o seu consumo doméstico de energia, sistemas de monitorização de energia foram desenvolvidos. Estes sistemas permitem o acesso à informação sobre o consumo e ajudam a perceber onde é que se está a desperdiçar energia, porém existem estudos que revelam a discrepância entre a informação fornecida por estes dispositivos e aquilo que os utilizadores realmente necessitam.
De forma a resolver o problema, esta tese tem o objetivo de oferecer uma linguagem especialmente desenhada (DSL) para interrogar os dados do consumo domestico. Esta linguagem foi desenvolvida com o intuito de expressar as preocupações do utilizador através de formulação de questões, sendo portanto, utilizável por não-programadores. O processo de desenvolvimento desta linguagem teve em conta a opinião de peritos e de utilizadores domésticos nas fases de conceção e validação. Estas opiniões foram obtidas através de reuniões e de um inquérito com o propósito de obter as informações mais significativas para os utilizadores.
v
A
BSTRACT
The superfluous consumption of energy is faced by the modern society as a Socio-Economical and Environmental problem of the present days. This situation is worsening given that it is becoming clear that the tendency is to increase energy price every year. It is also noticeable that people, not necessarily proficient in technology, are not able to know where savings can be achieved, due to the absence of accessible awareness mechanisms.
One of the home user concerns is to balance the need of reducing energy consumption, while producing the same activity with all the comfort and work efficiency. The common techniques to reduce the consumption are to use a less wasteful equipment, altering the equipment program to a more economical one or disconnecting appliances that are not necessary at the moment. However, there is no direct feedback from this performed actions, which leads to the situation where the user is not aware of the influence that these techniques have in the electrical bill.
With the intension to give some control over the home consumption, Energy Management Systems (EMS) were developed. These systems allow the access to the consumption information and help understanding the energy waste. However, some studies have proven that these systems have a clear mismatch between the information that is presented and the one the user finds useful for his daily life, leading to demotivation of use.
In order to create a solution more oriented towards the user’s demands, a specially tailored language (DSL) was implemented. This solution allows the user to acquire the information he considers useful, through the construction of questions about his energy consumption. The development of this language, following the Model Driven Development (MDD) approach, took into consideration the ideas of facility managers and home users in the phases of design and validation. These opinions were gathered through meetings with experts and a survey, which was conducted to the purpose of collecting statistics about what home users want to know.
vii
C
ONTENTS
Acknowledgements ... i
Resumo ... iii
Abstract ... v
Contents ... vii
List of Figures ... xi
List of Tables ... xiii
List of Listings ... xv
1 Introduction ... 1
1.1 Motivation ... 2
1.2 Objective and Problem Statement ... 3
1.3 Solution Overview ... 3
1.4 Expected Contributions ... 4
1.5 Document Organization ... 5
2 General Concepts ... 7
2.1 Energy Management Systems ... 7
2.2 Software Language Engineering ... 7
Model Driven Development ... 8
Domain Specific Languages ... 8
2.3 Data Stream Management System ... 9
3 State of the Art ... 11
3.1 Query Languages ... 11
Textual Query Languages ... 11
Non-Textual Query Languages ... 12
Comparison between the Query Languages ... 13
3.2 Existing Energy Reporting Solutions ... 14
House Monitoring Systems ... 15
House Appliances’ Monitoring System ... 16
Comparison of Energy Monitoring Systems ... 17
viii
4.1 Domain Specific Languages ... 21
Extensible Platform of Integrated Languages for model management (Epsilon) ... 21
A Tool for Multi-Paradigm Modeling (AToMPM) ... 23
Choice of the platform ... 24
4.2 Data Storage and Manipulation ... 24
Relational Database Management System ... 25
Data Stream Management System ... 25
5 EQuery Language ... 27
5.1 Domain Analysis ... 28
Analyzing the information provided by the EMS ... 28
Discussion of the gathered information with domain experts ... 29
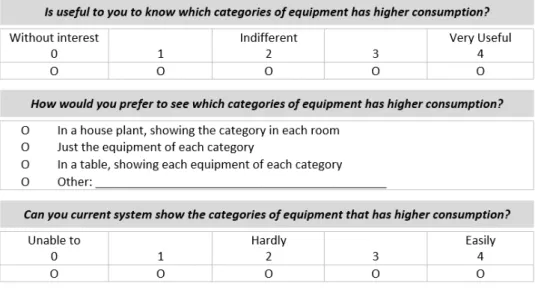
Understanding the home users’ real concerns ... 31
Categorization of the query elements ... 39
Definition of language models ... 40
5.2 Design ... 40
Definition of the abstract syntax... 40
Definition of the concrete syntax ... 41
Elements Incompatibilities ... 42
5.3 Implementation ... 43
Ecore and EMF Models ... 44
Well-formed Rules ... 44
Language Target Semantics ... 45
Language Architecture ... 50
6 EQuery Validation ... 53
6.1 Language Expressiveness ... 53
6.2 Usability Studies ... 55
Evaluation Process ... 55
Results Analysis ... 56
Discussion ... 60
7 Conclusion ... 61
7.1 Contributions ... 61
7.2 Future Work ... 62
8 References ... 63
9 Appendix... 67
ix
9.2 Features Model ... 77
9.3 Domain model ... 78
9.4 Language Metamodel ... 79
9.5 EMF ... 80
9.6 Epsilon Validation Language ... 85
9.7 Epsilon Generation Language ... 89
9.8 Entity Relationship Model ... 96
xi
L
IST OF
F
IGURES
Figure 1 – Solution Overview ... 4
Figure 2 – DSL implementation phases ... 8
Figure 3 – Natural Query Languages ... 12
Figure 4 – Non-Textual Query Languages ... 13
Figure 5 – House Monitoring Systems ... 15
Figure 6 –House Appliances’ Monitoring System ... 16
Figure 7 – Epsilon Architecture ... 22
Figure 8 – EQuery Language Overview ... 28
Figure 9 – Validation of “Which categories of equipment has higher consumption?” ... 32
Figure 10 – Prefered way for visualizing the results ... 34
Figure 11 – Relevant Questions for people who pays and do not pays the bill ... 34
Figure 12 – Relevant Questions for people with different types of household ... 35
Figure 13 – Relevant questions for the different age groups ... 35
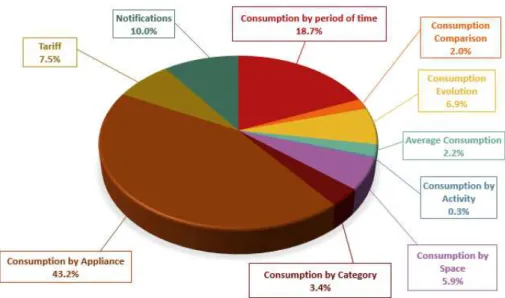
Figure 14 – Respondents concerns by area of information ... 37
Figure 15 – Respondents concerns by area of information ... 38
Figure 16 – Categorization of the query elements ... 39
Figure 17 – Fragment of the language metamodel ... 41
Figure 18 – Support Elements ... 41
Figure 19 – Query Elements ... 42
Figure 20 – Definition of the Higher Condition on the Ecore ... 44
Figure 21 – Conversion example from the concrete syntax to SQL code ... 46
Figure 22 – "What was the last year consumptions?" in the EQuery ... 46
Figure 23 –“Which areas have higher consumption?” in the EQuery ... 47
Figure 24 – “Which appliances have consumed more in the peak period?” in the EQuery ... 47
Figure 25 –“Which equipment are in stand-by mode?” in the EQuery ... 48
Figure 26 –“Which equipment may be damaged?” in the EQuery ... 49
Figure 27 –“What is the best tariff for my consumption?” in the EQuery ... 49
Figure 28 – “How much will I pay in the end of the month?” in the EQuery ... 50
Figure 29 –“Warning about equipment that are working when they are not needed?” in the EQuery ... 50
Figure 30 – Language Architecture ... 51
Figure 31 – Definition of a Notification in Esper ... 52
Figure 32 – EQuery Eclipse Editor ... 52
Figure 33 – Evaluation Procedure ... 55
Figure 34 – Concrete Syntax classification by the participants ... 58
Figure 35 – EQuery readability chart ... 59
Figure 36 – Online Survey for gathering the concerns about the energy consumption (Page 1) ... 67
Figure 37 – Online Survey for gathering the concerns about the energy consumption (Page 2) ... 68
xii
Figure 39 – Online Survey for gathering the concerns about the energy consumption (Page 4) ... 71
Figure 40 – Online Survey for gathering the concerns about the energy consumption (Page 5) ... 72
Figure 41 – Online Survey for gathering the concerns about the energy consumption (Page 6) ... 74
Figure 42 – Online Survey for gathering the concerns about the energy consumption (Page 7) ... 75
Figure 43 – Online Survey for gathering the concerns about the energy consumption (Page 8) ... 76
Figure 44 – Online Survey for gathering the concerns about the energy consumption (Page 9) ... 76
Figure 45 – Features Model ... 77
Figure 46 – Domain Model ... 78
Figure 47 – Ecore Model ... 79
Figure 48 – Structure Group entities in the MySQL database ... 96
Figure 49 – Support Group entities in the MySQL database ... 97
Figure 50 – Historic Group entities in the MySQL database ... 97
Figure 51 – Entity Relationship Model ... 98
Figure 52 – Usability Test (Part I. Page 1) ... 99
Figure 53 – Usability Test (Part I. Page 2) ... 100
Figure 54 – Usability Test (Part I. Page 3) ... 101
Figure 55 – Usability Test (Part II. Page 1) ... 102
Figure 56 – Usability Test (Part II. Page 2) ... 103
Figure 57 – Usability Test (Part II. Page 3) ... 104
Figure 58 – Usability Test (Part II. Page 4) ... 105
xiii
L
IST OF
T
ABLES
Table 1 – Table of comparison between DSMS and DBMS ... 9
Table 2 – Comparison of Query Languages (The symbol ○ indicates that the functionality is not available, the ◑ specifies that does not support it completely and the ● defines that is fully supported.) ... 14
Table 3 – Comparison of Energy Monitoring Systems ... 18
Table 4 – Areas of Information ... 29
Table 5 – Questions retrieved from the meetings with energy experts ... 30
Table 6 – Areas of Information after the Survey ... 36
Table 7 – Elements Incompatibilities ... 42
Table 8 – Language Expressiveness of the pre-established queries (The symbol ○ indicates that is unavailable and the ● that is available in the DSL.) ... 53
Table 9 – Information about the Usability Test subjects ... 57
Table 10 –Statistics from the participants’ effectiveness and efficiency, using EQuery Language in the tasks elaboration ... 58
Table 11 – Statistics from the participants’ effectiveness and efficiency, when using an Excel Spreadsheet to perform the given tasks ... 59
Table 12 – Participants withdraw statistics ... 59
xv
L
IST OF
L
ISTINGS
Listing 1 – Definition of the Higher Condition on the EMF ... 44
Listing 2 – EVL rule that states that the Information About action can only be used with the Tariff subject ... 45
Listing 3 – Formulation of a SQL query by the main.egl ... 45
Listing 4 – Function that defines the group by option in a SQL query ... 45
Listing 5 – "What was the last year consumptions?" in MySQL ... 46
Listing 6 –“Which areas have higher consumption?” in MySQL ... 47
Listing 7 –“Which appliances have consumed more in the peak period?” in MySQL ... 48
Listing 8 –“Which equipment are in stand-by mode?” in MySQL ... 48
Listing 9 –“Which equipment may be damaged?” in MySQL ... 49
Listing 10 –“What is the best tariff for my consumption?” in MySQL ... 49
Listing 11 –“How much will I pay in the end of the month?” in MySQL ... 50
Listing 12 –“Warning about equipment that are working when they are not needed?” in Esper ... 50
Listing 13 – Elements representation in the EMF file ... 80
Listing 14 – Definition of the validation rules in the EVL file. ... 85
Listing 15 – The EGL file with the SQL semantics ... 89
1
1
I
NTRODUCTION
In the last century the energy consumption has increased considerably, in straight correlation with the human activity and population growth. Consequently, this increase is contributing for the exhaustion of our fossil energy reserves, as well as for the degradation of the environment and global warming. Several discussions about this issue have taken place in the international political agenda, and legislation agreements (e.g. citation: Europe Directive 2012/27/EU on Energy Efficiency). In order to solve this problem, sustainable energy sources must be uncovered to replace the imminent worldwide petroleum exhaustion. Additionally, the human kind must invest on using energy in more efficient ways, without severely influence the civilization activities. Subsequently, and due to the increasing of prices every year, the community started to debate about what can be done in order to reduce the consumption, as well as the trade-offs between comfort and energy saving.
In order to start saving it is important to known where the reduction can be made. This problem occurs because the use of energy is harder to keep track, for instance, it is easier to compare two supermarket bills and understand where the money was spent and where it is possible to do some saving. This difference is based on what is possible to see, in the supermarket scenario it is possible to understand the reason that led to the reduction, whereas in the energy bill it is only possible to see the cutback, but not why it was done.
The other main concern, when energy saving is discussed, is the capability to do the same activity with all the comfort and the equivalent amount of work efficiency [1]. In fact, this is achievable, since the activities can be accomplished in a more economical way, by adding some preventive actions. Using a less wasteful equipment, changing the schedule of an activity, altering the equipment program to a more economical one or disconnecting appliances that are not necessary at the moment, are some precautions to take into account. Another way of saving energy is by focusing on the user and his energy consumption activities to detect everyday routines, since 80% of energy used is due to the habits and daily decisions [2] [3]. However, in order to do this preventive actions, more information is needed, such as the consumption of each equipment used in the activities, the type of activities and our every-day habits.
Introduction 1.1 Motivation
2
the price of energy [2]. Thus, it is necessary to know each equipment, their consumption and the daily routines, to understand how to waste less energy. For example, knowing that a particular light has a great influence on the final consumption or that the air conditioning is wasting energy. This type of information combined with simple techniques, such as using the blinds for letting the heat get in or for keep it out, or by merely turn off the unnecessary lights and equipment, will help the home user to reduce his energy bill. It has been proved that these procedures, implementable with minimum effort, are able to cut back the consumption by 40% [4]. As expected, the direct consequence of this reduction is that it not only helps to save money but it also helps the environment.
In overall, the energy consumption should be reduced, though this is difficult to do without the awareness of how much each equipment consumes. Therefore, knowing the routines, the equipment and the activities performed, is the ideal way to take an action in order to reduce the usage and the costs.
1.1
M
OTIVATION
According to Anderson and White [5], “Everyone understands money. Watts, kilowatts and especially kilowatt-hours will never be universally understood or accepted as units of energy consumption”. In fact, it is simpler to understand how much money was saved or what are the current spending, instead of, the amount of kilowatt-hours consumed in the last hour. Therefore, presenting the real-time consumption can encourage a changing of habits [1][5]. A clear example is that by discovering that using a certain type of light bulbs or that a specific equipment is consuming more than necessary, may led to adopt new routines [5] or on adding preventive actions.
In order for adjusting the daily use of energy, it is essential to distinguish and emphasize the different types of relevant information. To be more specific, it must be specified what is the most useful and influential information, to induce a change of habits and achieve minimum consumption in a balanced way. As a result, the information given can be divided into the following categories [5][6]:
Real-Time Information, where the value of actual consumption is indicated, allowing some exchanging to be done. For example, turning off lights in rooms that are not being used at the moment, or disconnect equipment that is in stand-by mode;
Historical Information, that helps knowing the previous actions and consumptions. This type of knowledge is valuable to detect routines and activities accountable for the major use of energy;
Predictable Information, when being aware of the future amount to pay or that pre-established goals will be achieved, is an encouragement. For example, seeing that in the end of the current month there will be a smaller amount to pay.
Comparative Information, where the progress is illustrated, such as the comparison between this month and the last. This category can also be used to promote competition, since it is also a way to reduce consumption [1].
Warning Information, to monitor the consumption and alert for risky situations. This kind of awareness is valuable when anomalies are detected, like having the electrical stove on, when nobody is home.
Chapter 1
Introduction 1.2 Objective and Problem Statement
3
these solutions have some flaws. The first one is the demotivation, seeing that the user starts losing his enthusiasm with time, neglecting the EMS and also their energy saving measures [7]. Another problem is the fact that these systems are built on the notion that “One Size Fits All” [8], which is incorrect because each user has different concerns. Therefore, although allowing the user to access his energy consumption information, there is however a restriction problem when there is the need to combine it in order to produce information that is adaptable to the user needs [3]. Thus, the ideal solution would be that people could express their own adequate questions in a flexible way.
In order to do that, it is necessary to offer a specially tailored language for questioning against the consumption data, but that at the same time usable by non-programmers [1]. Such languages, called Domain Specific Languages (DSL), are languages, usable by programmers and non-programmers, designed for precise domains, which in this context is the formulation of queries about the energy consumption. This language will offer the user the possibility to create his desirable query, with the advantages of using symbolic and graphical notations [9] to express their concerns, which is more expressive and easy to use, than General Purpose Languages (GPL) [9][10].
1.2
O
BJECTIVE AND
P
ROBLEM
S
TATEMENT
This thesis aims to create a DSL that allows the information about the consumption of energy to be queried. The idea of this DSL is for the users to consult the details that are more useful for them, as which room is consuming more energy, if there is inefficient equipment or which activity can be performed in a more economical form. In order to create these queries the combination of information is necessary, like the equipment information, the room configuration, the consumed energy for each equipment, the room occupation, and others. However the combination of all of these data may enable the possibility of several types of queries, so the first research interrogation is:
How can we categorize the questions?
With this first interrogation resolved, another problem arises, since the proposed solution has to be intuitive for the users without any programming knowledge to be able to combine different data. Therefore, the second research question is:
Can we create a DSL, expressive enough, which allows the users to create their own questions in terms of the domain of energy consumption to run against stored data?
1.3
S
OLUTION
O
VERVIEW
Introduction 1.4 Expected Contributions
4
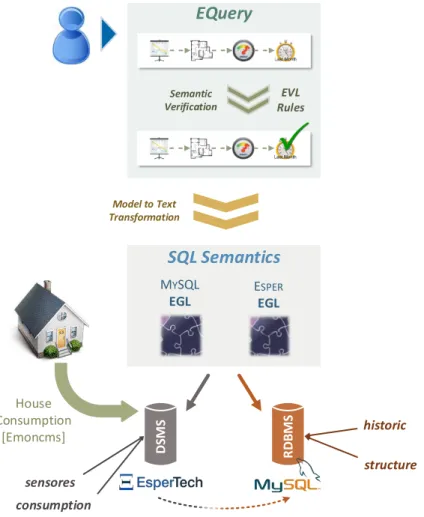
With the information about the elements necessary to construct a query, the next step was to identify the possible conflicts between elements, in other words, the elements than cannot be present in the same question or elements’ requirements. The final step was the language implementation, which included the conversion of the queries to the SQL semantics, and its validation with real users. In the end, we have a solution that allows the definition of queries, where the query is validated to remove inconsistencies, and then converted to the SQL semantics, being runnable against real-time and historic data.
D
S
MS
EQuery
SELECT FROM WHERE
SQL Semantics
R
D
B
MS
House Consumption
Semantic Verification
Model to Text Transformation
Figure 1 – Solution Overview
1.4
E
XPECTED
C
ONTRIBUTIONS
With the work and the research done in this domain, it is expected that the following contributions will be achieved:
Establish a form to categorize the questions, so that the language be able to run the queries expressed by the user;
Chapter 1
Introduction 1.5 Document Organization
5
1.5
D
OCUMENT
O
RGANIZATION
The remainder of this thesis is structured as follows:
General Concepts (Chapter 2) – Consists in a brief explanation about the concepts used in this thesis;
State of the Art (Chapter 3) – Represents an overview about the work that has been made in this domain;
Technology (Chapter 4) – References the technologies that are used in the solution.
EQuery Language (Chapter 5) – Presents the several steps necessary to the development of the proposed solution;
EQuery Validation (Chapter 6) – Explains the evalution process that was conducted.
Conclusion (Chapter 7) – Contains the conclusions aspects, contributions and future work for this dissertation.
References (Chapter 8)–The references used through this document.
Introduction 1.5 Document Organization
7
2
G
ENERAL
C
ONCEPTS
In this chapter it is presented a brief description of some concepts that are discussed throughout this document. These concepts are divided into three groups: Energy Management Systems, Software Language Engineering and Data Stream Management Systems.
2.1
E
NERGY
M
ANAGEMENT
S
YSTEMS
The use of electrical energy is important in our daily lives, since it allows us to perform a variety of actions. However, the use of energy also leads to the pursuit for ways to reduce it, not only for the costs associated, but also with the intention of saving the planet. Nowadays, when trying to moderate the consumption of energy, we have two options available, (1) preventive actions, such as turning off all the unnecessary equipment, reducing its intensity and resorting to the environment conditions; and (2) Energy Management Systems (EMS).
An Energy Management System (EMS) assists in the monitoring, controlling and enhancing the use of energy, promoting efficiency. This type of systems are also advantageous, since they can provide information from the measuring and monitoring, allowing more thoughtful decisions to be taken [11][12].
A more specific type of EMS is Building Management System (BMS), where it is possible to monitor and control equipment that requires a significant energy consumption. BMS is applied in office buildings, universities or factories, bringing benefits not only to the building owner, since they save money by keeping the same level of conditions.
2.2
S
OFTWARE
L
ANGUAGE
E
NGINEERING
General Concepts 2.2 Software Language Engineering
8
Model Driven Development
Model Driven Development (MDD) is a paradigm where the models are the main artifact in the development process [14]. Therefore, with MDD it is possible to separate the systems design from its implementation, since the representation can be accomplished regardless the details of implementation, such as specific platforms or programming techniques [9][15]. This approach has several models on different layers of abstraction that are used to describe the system, which raises the level of abstraction and hides complexity [14]. These layers are written in specific languages that can be transformed, by an interpreter or by a code generator, into executable code [9]. Some examples of these transformations are model-to-model (M2M) and model-to-text (M2T).
It has been proven that the usage of the MDD approach increases the developer productivity, which reduces the time to market, since it is a solution that can rapidly generate code [16][17]. Additionally, this approach has more quality and is less error-prone [18].
Domain Specific Languages
Domain Specific Languages (DSLs) are languages designed specifically for a domain, based on its concepts and features. Contrary to General Purpose Languages (GPLs), DSLs are focused in the domain of the problem and not in the computational solution, which makes them more expressive and easy to use [9][10]. Opting for the use of DSLs brings some benefits when comparing with GPLs. DSLs are more expressive, since the domain notions are used in the solution, resulting in better understanding by programmers and non-programmers [19][20]. Although sacrificing some flexibility, DSLs are more productive and reliable [9][15], reaching the market quicker, diminishing the maintenance cost and having more capability for optimization [21]. The DSLs are also recommended by their quality, due to the fact that they have less errors and more efficient code [9][13][22].
Domain Analysis
Meta-model Design
Implementation Validation
Figure 2 – DSL implementation phases
Chapter 2
General Concepts 2.3 Data Stream Management System
9
language with real users, it is possible to establish the parts that require more attention to detail and also, the improvements that can be achieved in the next iteration of the development process [13][23].
2.3
D
ATA
S
TREAM
M
ANAGEMENT
S
YSTEM
Applications that deal with continuous data are increasing in importance, such as stock market quotes, networking monitoring, telecommunications data management or sensor networks [24]. These applications use continuous data streams rather than finite stored data sets. This fact leads to the necessity of having long-running continuous queries as opposed to one-time queries [24], and since the traditional databases are ill-equipped to handle complex and numerous continuous queries over data streams, another type of Database Management System was necessary.
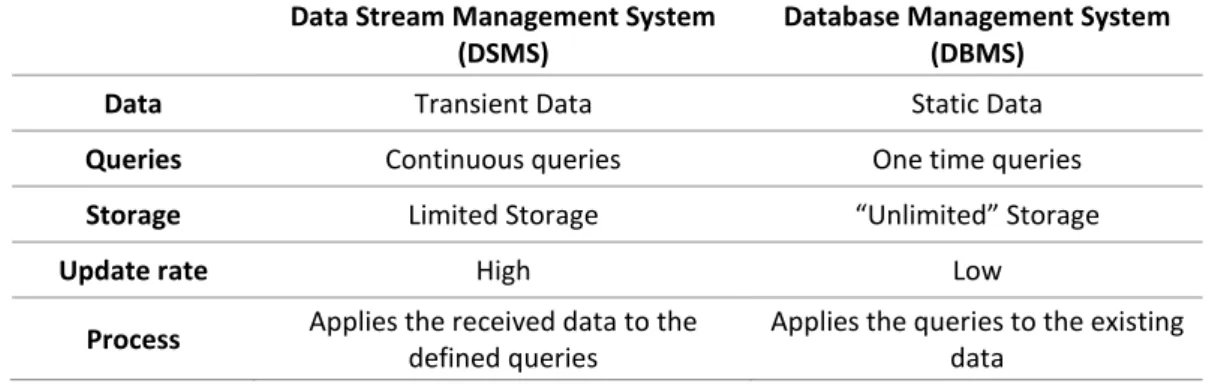
Data Stream Management System (DSMS) is similar to Database Management System (DBMS), but designed for working with transient data instead of static data. DSMS are valuable because they allow the data to be processed in real-time [25], which is essential when fast decisions are needed. For example, in home automation or in the stock market this type of decision is important, since the information provided by these systems expires quickly [26][25]. Another difference between DSMS and DBMS is the storage of data, since the DSMS are not meant for permanent storage, only for temporarily saving data that can be useful in historical queries [25]. The Table 1 summarizes these differences.
Table 1 – Table of comparison between DSMS and DBMS
Data Stream Management System (DSMS)
Database Management System (DBMS)
Data Transient Data Static Data
Queries Continuous queries One time queries
Storage Limited Storage “Unlimited” Storage
Update rate High Low
Process Applies the received data to the defined queries
Applies the queries to the existing data
General Concepts 2.3 Data Stream Management System
11
3
S
TATE OF THE
A
RT
This chapter describes the research done about the existing solutions in this domain, the Query Languages and the existing Energy Management Systems. The first section presents a brief description on the existing types of query languages, showing some existing tools that employ these languages. The second section mentions some of the current solutions for the resident to monitor his home consumption. A few of these systems already allows the user to understand his daily and monthly consumption or even to monitor each equipment independently.
3.1
Q
UERY
L
ANGUAGES
The objective of a query language is retrieving and combine information present in a database returning the expected result. Over the years, several query languages have been developed for this interaction and they can be classified in two categories, the Textual Query Languages and the Non-Textual Query Languages.
Textual Query Languages
This language type is divided between Natural Query Languages and Artificial Query Languages. The first one was developed with the purpose to be more simply used, removing the need for extensive training [27]. Artificial Query Language or Formal Query Languages, is the type of language that is more used when accessing a database.
3.1.1.1
Natural Query Languages
State of the Art 3.1 Query Languages
12
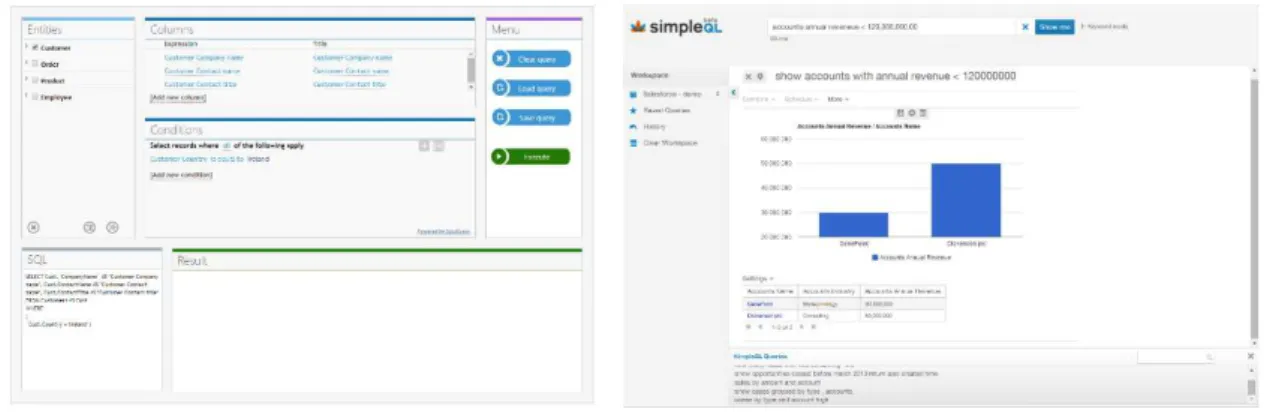
two examples of tools that use this kind of language. At the left side is presented the Easy Query1,
which offers an ad-hoc query builder for creating the requested query as a sentence. With this tool, the user has to go to Column and Condition tab and chosen the wanted data. The SQL and Result tab shows the query in text and query results. On the right we have the SimpleQL2, a tool designed
to simplify the data analysis. SimpleQL offers a web interface where the data can be queried through questions, being adaptable to every type of database.
Figure 3 – Natural Query Languages
3.1.1.2
Artificial Formal Query Languages
The Artificial Query Languages are the most common languages for performing an access to a database. The most familiar is the SQL (Structured Query Language) used for accessing relational databases, however much more languages are included in this category, like the OQL (Object Query Language) that is applied in object oriented databases. These type of languages have advantages, such as the formalism and the decrease of ambiguity. On other hand, the user has to learn the syntax and understand how the information is linked [28].
Included in this category is the XQuery3 and Java Object Oriented Querying4 (JOOQ). The XQuery is
used to query and transform data in the form of XML, while JOOQ is a software library in java that provides a Domain Specific Language (DSL) to construct queries.
Non-Textual Query Languages
Non-textual Query Languages are a type of languages that use Visual Query Language (VQL), for expressing the requested information. These type of languages are easier to learn and can be more efficient with non-expert users, but they can also improve the programmer’s productivity. A disadvantage of these languages is that they have less formalism than the textual ones.
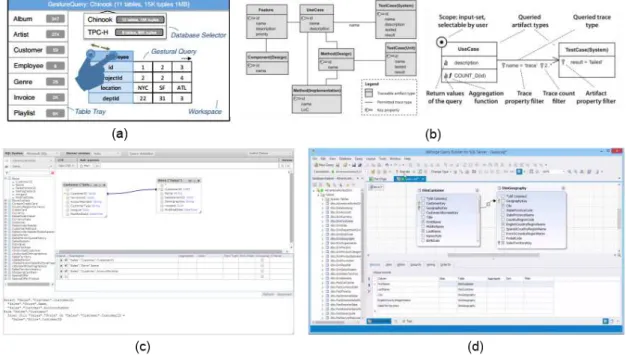
In the Figure 4 it is represented theGestureQuery and the Visual Trace Modeling Language (VTML). Gesture Query (Figure 4a) is a multi-touch interface for querying a database, allowing a rapid interaction and query refined, even by non-expert [30]. Its interface is composed by three parts, the list of tables, the database selector and the workspace, where the questions are formed. This tool allows the user to perform the following actions: (1) filter; (2) sorting; (3) preview; (4) group by and aggregate; (5) rearrange; (6) join and (7) union. Whereas the second one is a language that, according
1 http://devtools.korzh.com/easyquery
2 http://simpleql.com/
3 http://www.w3.org/XML/Query/
Chapter 3
State of the Art 3.1 Query Languages
13
to the authors, offers a relatively simple and intuitive way for querying the database. VTLM (Figure 4b) uses the standard UML class diagrams to model queries. The reason for this approach, is that it can be used by any organization familiar with UML and implemented with standard tools [31].
Figure 4 – Non-Textual Query Languages
Included in this category is the QBE (Query-by-Example) and the Hybrid Approach [28]. The QBE consists in providing to the user a table that he fills with the required commands and then the system creates the query, based on this table [32]. The Hybrid Approach is the more common and provides the option to create the query through a visual dashboard or text. The Figure 4 presents two tools that use this approach, Active Query Builder5 (Figure 4c) and dbForge Query Builder6 (Figure 4d).
These tools allow expert users to build SQL Queries in a visual form, offering also the ability to make SQL text editing.
Comparison between the Query Languages
From the Table 2, it is possible to perceive that the Natural Query Languages are the only ones adaptable to non-programmers, since this type of language was designed with the intent to be more simple and easier to use without being necessary to given extensive training. However, due to the language limitations, some education has to be given in order to understand the database notions and hidden constraints [27]
The Formal Query Languages are more difficult to use, because of query complexity and the necessity to understand the database structure [27][33], while the Visual Query Languages are more intuitive for a user, since it is easier to express the relations between objects. Nevertheless, they have limited expressiveness, since they are implemented to be simple and easy to use [33].
5 http://www.activequerybuilder.com
State of the Art 3.2 Existing Energy Reporting Solutions
14
Table 2 – Comparison of Query Languages (The symbol ○ indicates that the functionality is not available, the
◑
specifies that does not support it completely and the●
defines that is fully supported.)TEXTUAL QUERY LANGUAGES NON-TEXTUAL QUERY LANGUAGES
Natural Query Languages
Artificial Query
Languages Visual Hybrid
Easy
Query SimpleQL XQuery JOOQ
Gesture
Query VMTL
Active Query Builder DbForge Query Builder U S E R
Programmer
●
●
●
●
●
●
●
●
Non-Programmer
◑
◑
○
○
◑
○
○
○
Graphical Queries
●
●
○
○
●
●
●
●
Ad-hoc Queries
●
●
●
●
●
●
●
●
Continuous
Queries
○
○
○
○
○
○
○
○
Requires knowledge of
queries notions
●
●
●
●
●
●
●
●
In the above table several tools from different types of query languages were presented, each one of them having into account different goals. Although all of them permitting the creation of queries that can combine different information to generate new one, these languages are not able to deal with continuous data. Consequently, they are not the ideal ones to question the real-time data received from the electric current sensors.
3.2
E
XISTING
E
NERGY
R
EPORTING
S
OLUTIONS
A significant share of our daily activities in a modern society depends on energy to be successfully executed. In Europe, as stated in the Eurostat study of 2010 [34], the residential consumption represents up to 27% of the entire energy produced. However, this energy is not efficiently used because a large part of it can be wasted without the residents being aware of it. This fact represents a major problem for people, since they are paying for something that they are not maximizing its use, because they do not have a way to understand where the energy is being wasted in activities that are unnecessary. For this reason, there is a demand for systems that gather information about the household consumption, in order to decrease the waste and cost of the consumed energy.
Chapter 3
State of the Art 3.2 Existing Energy Reporting Solutions
15
House Monitoring Systems
House Monitoring Systems are designed to help the home users to keep track of their global energy consumption. These systems can provide different types of information, such as the consumption by month or the consumption preview. However, this group of systems, cannot help the user to completely understand where the consumption is higher, since they do not have the information distributed by appliances.
The following image presents six different systems for monitoring the domestic energy consumption. All of these systems are similar, since they have the same goal, therefore, the functionalities are identical between them.
Figure 5 – House Monitoring Systems
The Energy Detective (TED)7 is an EMS designed for helping reducing the bill (Figure 5a). TED offers
different applications for Residential or Commercial/Industrial use. This system provides the information about the current consumption in a wireless device, a webpage for monitoring and the possibility to define alerts to the mobile phone. The monitoring view allows the user to access the following information: (1) current consumption; (2) average of money spent by day; (3) money spent since midnight; (4) money spent that month and (5) bill projections.
Engage Efergy8 (Figure 5b) is a system for monitoring the use of energy, allowing the user to access
the data from his computer, smartphone or tablet. This platform allows the following actions: (1) checking the real-time usage; (2) setting a budget target; (3) consulting the current spending and (4) examining the energy consumption history.
GEO Minim9is a system that consists in a display that provides the information about the energy
consumption(Figure 5c). This system allows the home users to access the following information: (1) current consumption; (2) consumption by day, week or month; (3) daily target setting and (4) tariff indicator.
7 http://www.theenergydetective.com/
8 http://engage.efergy.com/
State of the Art 3.2 Existing Energy Reporting Solutions
16
Owl10is a UK company that provides two solution for energy monitoring, a simple (Figure 5d) and a
smart one. Both of this solutions offers the user information similar to the GEO Minim: (1) current consumption; (2) consumption by day, week or month; (3) consumption average by day, week or month; (4) tariff indicator and (5) budget settings.
Eco-Eye11is a system that allows users to check their energy consumption through a display device
(Figure 5e). This system offers the following information: (1) current consumption; (2) money spent by day, week, month or year and (3) target definition.
Current Cost12provides different types of displays (Figure 5f) for helping identifying the waste of
energy consumption. These displays offer the following knowledge: (1) current consumption and money spent and (2) money spent by day, week, or month.
House Appliances’ Monitoring System
These types of systems are similar to the previous ones, since they have the same purpose: inform the user about his energy consumption. Nevertheless, these systems are more suitable if the home user wants to understand which appliance have a higher usage of energy, instead of receiving information pertaining to his main consumption. The Figure 6 presents six systems of this kind.
Figure 6 –House Appliances’ Monitoring System
OpenEnergyMonitor13 is an open-source project for energy monitoring (Figure 6a). This system is
Arduino compatible and consists in four parts: (1) the emonTx, responsible for monitoring part; (2) the emonGLCD, a wireless display; (3) the emonBase, responsible for receiving the data from the emonTX and (4) the emoncms, a web-app for data visualization. The web-app allows the user to define the data feeds of the information that is being retrieved and create his dashboard with visualization of this feeds.
Cloggy14(Figure 6b)is a solution for home users to manage their energy consumption. This product
allows for the monitoring of the energy usage through a smart plug that also allows for the control
10 http://www.theowl.com/
11 http://www.eco-eye.com/
12 http://www.currentcost.com/products.html
13 http://openenergymonitor.org/emon/
Chapter 3
State of the Art 3.2 Existing Energy Reporting Solutions
17
of the connected appliances. The information offered by this system is viewable by a webpage, a smartphone or through a small monitor, being the following: (1) access to the current consumption; (2) average consumption; (3) consumption preview and (4) consumption by appliance.
Tendril15 is a company that offers systems to control the consumption of energy (Figure 6c). This
system allows the home user to keep track of his usage of energy through web applications, mobile application or though devices. With this system the user can access the following information: (1) real-time consumption; (2) yesterday’s consumption; (3) consumption by appliance; (4) consumption from the last day, month or year and (5) consumption preview.
The remote energy dynamics (re:dy)16 is a system offered by EDP (Energia de Portugal), the main
supplier of energy in Portugal (Figure 6d). This system allows the user to access his consumption through a smartphone or a webpage where the provided information is: (1) real time information about the current consumption; (2) chart base historic; (3) consumption by appliance and (4) recommend energy prices.
GEO Ensemble17(Figure 6e)like Geo Minim is a system that consists in a display that provides the
information about the energy consumption(Figure 5c). The Ensemble allows the user to access the knowledge already offered by the Minim, but also allows to access the information through a web-page or a mobile app and knowing the consumption by appliance. Thus, this system offers the following information: (1) current consumption; (2) consumption by day, week, month or year; (3) target setting; (4) tariff indicator and (5) consumption by appliance.
AlertMe Energy18 is a system for accessing the real-time consumption information from the
household (Figure 6f). As the previous, this system allows the following information: (1) current consumption; (2) consumption from day, night, evening and morning; (3) consumption prediction; (4) consumption by appliance and (5) monthly consumptions.
Comparison of Energy Monitoring Systems
Given the presented EMS, it is possible to assert that a home user has currently at his disposal a wide plethora of systems that can help him controlling his energy consumption. However, in order to better understand the information provided by these systems, the Table 3 was created to summarize the functionalities of each one.
15 http://www.tendrilinc.com/
16 https://energia.edp.pt/particulares/servicos/redy.aspx
17 http://www.greenenergyoptions.co.uk/
State of the Art 3.2 Existing Energy Reporting Solutions
18
Table 3 – Comparison of Energy Monitoring Systems
HOUSE MONITORING
SYSTEMS
HOUSE APPLIANCES’MONITORING
SYSTEM T E D E n g a g e E fe rg y G E O M ini m Owl Eco -E ye C u rr e n t C o st E m o n cm s C lo o g y T e n d ri l re :dy G E O E n se m b le Al er tMe E n e rg y Consumption
Current
●
●
●
●
●
●
●
●
●
●
●
●
Daily
●
●
●
●
●
●
●
○
●
○
●
●
Weekly
○
○
●
●
●
●
●
○
○
○
●
○
Monthly
●
●
●
●
●
●
●
●
●
●
●
●
Annual
○
○
○
○
●
○
●
○
●
○
○
○
Consumption Evolution
Daily
●
●
○
○
○
○
●
●
●
●
○
●
Weekly
●
○
○
○
○
○
●
●
○
○
○
○
Monthly
◑
●
○
○
○
○
●
●
●
●
○
●
Annual
●
●
○
○
○
○
●
●
●
●
○
○
Consumption Average
Daily
●
○
○
●
○
○
○
●
○
○
○
○
Weekly
○
○
○
●
○
○
○
○
○
○
○
○
Monthly
○
○
○
●
○
○
○
○
○
○
○
○
Consumption by
Space
○
○
○
○
○
○
○
○
●
○
○
○
Consumption by
Appliance
○
○
○
○
○
○
●
●
●
●
●
●
Tariff
The best
tariff
○
○
○
○
○
○
○
●
○
●
○
○
Bill preview
◑
○
○
○
○
○
○
●
◑
●
○
◑
Budget limit
○
●
●
●
●
○
○
●
●
○
●
○
Notification
◑
○
○
○
○
○
◑
●
○
●
○
○
The previous table shows the several types of information provided by the referred Energy Management Systems (EMS), which is divided in six categories:
Consumption: Implies that the marked EMS presents the different values of consumption (current, daily, weekly, monthly or annually). These values are presented in two different units, kwh and currency (€, £ or $);
Consumption Evolution: This category is applied when the EMS gives the possibility to observe the consumption values through a period of time;
Average Consumption: Marked when the EMS presents the average value of a period of time;
Spaces Consumption: States that the EMS offers information about the consumption of each space.
Chapter 3
State of the Art 3.3 Final Conclusions
19
Tariff: Used when the EMS provides information about the payable values. Notification: Whether the EMS gives alerts about the consumption.
Between all of these systems, the user can access different types of information, becoming more aware of his energy consumption. There are however two mains problems: the first one is how to choose the more appropriate system, and the other is to know if that system can answer the user’s needs.
From the previously described systems it is possible to observe that the most of them provide enough information about the Consumption. When we observe the Consumption Evolution, the House Monitoring Systems offer a smaller amount of solutions, compared with the House Appliances’ Monitoring Systems. If the user wants a solution that provides information about the Average Consumption, the number of choices is really limited. Another additional issue with the presented systems are the Notifications and the Space Consumption, since few of them provides these functionalities, which is a characteritic that should be expected in these types of systems [7]. Especially the Alert features since it helps to keep the user motivated.
It is possible to conclude that these systems already provide information that is helpful when pretending to control the energy consumption. However, as mentioned, these systems are based on the concept that “One Size Fits All” [8] and none of them allows the combination of information to retrieve new information. The only one that offers similar functionality is the Emoncms which allows to configure the data feeds, however this system requires some specific knowledge about the data that is being read and how to handle it.
3.3
F
INAL
C
ONCLUSIONS
In the two previous sections, there was an analysis of the available tools in for monitoring the energy consumption (Section 3.2) and for performing queries (Section 3.1). The Energy Monitoring Systems (EMS) are already a good option for who wants to understand their consumption and control the energy waste. However, these systems are created to be adaptable to all of the users, which makes it impossible for the user to retrieve personalize the want information. Additionally the studied EMS are ill-prepared for providing information about the equipment, area or category consumption, as well as a complete notification system with several types of warnings and also with motivation tips that could led to more savings. Another issue detected was that the majority of the EMS fail when the user wants to predict how much he will pay in the end of the month, since they only require the price per kWh, discarding that existence of tariffs with different prices per period.
On the study of the existing Query Language, it was ascertain that already exist some tools that are concerned with the usability by a non-programmer. Nevertheless, these languages have a higher degree of complexity due to the fact that they are used for general purposes, not being domain specific. Therefore, there is always the need to train the user with notion about the existing data and their relationship.
State of the Art 3.3 Final Conclusions
21
4
T
ECHNOLOGY
In this chapter it will be discussed the tools used in order to successfully develop the solution for the described problem. As a reminder, the problem that this thesis wants to solve is how to provide a language that allows users to create their own questions about the consumption of energy.
Therefore, two different types of tools will be present. Tools for the Domain Specific Language (DSL) implementation and Data Storage and Manipulation that will storage information and execute the queries.
4.1
D
OMAIN
S
PECIFIC
L
ANGUAGES
As mentioned in the section 2.2.2, the Domain Specific Languages are tailored for a specific problem, offering more maintainability, reliability and productivity, since the code size is reduced. This facts led to an increase of interest and to a rise of tools for its implementation.
Currently there are several tools that support the development of a DSL, being the most used the MetaEdit+19, the GME20, the AtomPM21 and the Epsilon22. However, due to the fact that the MetaEdit+
is commercial and that GME is platform dependent (runnable only on Microsoft Windows), the only tools considered were the AtomPM and the Epsilon.
Extensible Platform of Integrated Languages for model management
(Epsilon)
Epsilon is a platform composed by a family of task specific languages and tools, integrated in the Eclipse Generative Modeling Technologies (GMT) project. This tool offers an infrastructure that can
19 http://www.metacase.com/mep/
20 http://www.isis.vanderbilt.edu/Projects/gme/
21 http://syriani.cs.ua.edu/atompm/atompm.htm
Technology 4.1 Domain Specific Languages
22
operate with different modeling framework, such as the Eclipse Modeling Framework (EMF), Meta Data repository (MDF) and plain XML [35][36][37].
The Epsilon Object Language (EOL) is the main language of Epsilon, since the others are built from it. EOL is a language based on the Object Constraint Language (OCL), allowing model modification, conditional and loop statements, user interaction, and others [35][38]. Although EOL being used as a general purpose model management language [35], its main purpose is to be reused by the other task specific languages provided: Epsilon Generation Language (EGL) for model-to-text transformation; Epsilon Transformation Language (ETL) for model-to-model transformations; Epsilon Merging Language (EML) for merging model, Epsilon Validation Language (EVL) for model validation; Epsilon Wizard Language (EWL) for model refactoring; Epsilon Comparison Language (ECL) for model comparison and Epsilon Flock for model migration.
Figure 7 – Epsilon Architecture23
As illustrated in the Figure 7, all the task specific languages are built on top of the EOL and, in order to support all the different types of models, it was necessary to implement the Epsilon Model Connectivity (EMC) [39], that deals with all the several types of modelling technologies.
4.1.1.1
Task Specific Languages
This section will focus on the languages that will be needed in the solution. As mentioned in the previous section Epsilon supports different types of languages, where each one is responsible for particular assignments.
Epsilon Object Language (EOL) is an imperative programming language for creating, modifying and querying EMF models. It was also build with the intention to reuse OCL navigation mechanism, offering support for other languages in model access, model modifications or error streams. EOL is the core language in which all the other task specific languages were developed, such as ETL and EGL [39][38].
Epsilon Generation Language (EGL) is a specific language for transforming a model into text, being this text, executable code, reports, or images. As mentioned, EGL is built over the Epsilon Object Language and reuses its mechanism for controlling the program flow, navigation and model inspection. Since EGL is a template-based code generator, it has some ways to ease that generation. For instance, it includes a merging engine that preserves hand-written sections and a
Chapter 4
Technology 4.1 Domain Specific Languages
23
system that allows the text to be generated from different sources. It also provides a formatting algorithm for producing readable code and a mechanism for traceability of the text to the model [39][40].
Epsilon Transformation Language (ETL) is a task specific language for model transformation, built on top of EOL, with the purpose to define rules and execute schemes. From the EOL, it receives its imperative characteristic for dealing with more complex models. Instead of turning one model into another, ETL can transform an arbitrary number of inputs, into an arbitrary number of outputs in different modeling languages. In order to do so, ETL transformations are grouped in modules, where each module can contain any number of rules and operations. In addition to transformation rules, an ETL module can also specify blocks of EOL statements that can be executed before or after the transformation [39][35].
Epsilon Validation Language (EVL) main objectives are to evaluate constraints on metamodels, checking their intra and inter-model consistency and giving some quick forms to repair their inconsistencies. Epsilon Validation Language is also combined with EMF/GMF, thus the constraints evaluation can be done inside their editors, generating also error messages [39]
4.1.1.2
Tools
Epsilon different tools allows code generation, model transformation and others. One of this tools is EuGENia, responsible for the models needed for the GMF Editor (.gmfgraph, .gmftool and .gmfmap). EuGENia generates these models through an Ecore metamodel, lowering the complexity of GMF by offering a high-level form of making annotations.
4.1.1.3
EMF Support
Epsilon is not bound to the Eclipse Modeling Framework (EMF), however provides a strong support, by the implementation of a driver for the Epsilon Model Connectivity (EMC) layer. This driver allows for all types of EMF, such as reflective, generated and non-XMI models that are specified using XText or EMFText.
The EMF, as describe in its official page, is framework for modeling and code generation based on structured data model. The EMF produces a set of Java classes for the model, specified using a XMI. Models can also be specified using annotated Java, XML documents [41] or using an Ecore metamodel. In order to specify a graphically concrete syntax, for a model defined with EMF, the usage of tools like the Graphical Modeling Framework (GMF) is needed [42].
A Tool for Multi-Paradigm Modeling (AToMPM)
AToMPM, the successor of AToM3, is a tool that is being developed by several people, namely Eugene
Technology 4.2 Data Storage and Manipulation
24
Its designers considered it to be a modern and versatile way for develop all of the parts of the system with the most appropriate level of abstraction and formalism, since it can be modeled using a combination of UML Class Diagram and Statecharts. AToMPM is also a bootstrap, since it does all the modeling by itself.
This tool provides an interface where the actions like defining metamodels, establishing rules and executing transformations are made graphically, by the usage of mouse clicks or movements. However, it is also possible to use textual commands [43][44].
4.1.2.1
Modeling
AToMPM main functionality is modeling and metamodeling, thus a meta-metamodel is defined to be followed by the metamodels. This meta-metamodels can be an Entity Relationships Model or a basic version of UML Class Diagram [45][43]. In this tool, when a meta-model is defined it is automatically compiled, but in order for than to happen the parallelism between concrete syntax and abstract syntax is needed [45].
4.1.2.2
Transformations
AToMPM transformations are based in the Transformation Core (T-Core) framework developed by the same authors of AToMPM, with the purpose to combine or reuse transformations implemented in different languages. This type of framework was needed since there are many forms to execute transformations, besides, with this framework it is possible to plan transformations more suitable for the current task [47].
The transformations can be performed in two ways, release and debug. The first one, where the model is sent to the server, transformed and then returned to the client’s side; or the debug mode, where the transformation in done step-by-step or continuously in the client’s side [43].
Choice of the platform
The choice between the two presented platforms for the DSL development, Epsilon and AtomPM, was based on advantages that the tool could bring to the language development. In the end, the Epsilon tool was the one that was considered the most appropriated for implementing this thesis prototype, due to its several years of development and improvements, and also because of its great community. Opposing to the AtomPM that is a very recent tool with a reduced support community.
4.2
D
ATA
S
TORAGE AND
M
ANIPULATION
To complement the developed DSL, it was necessary to store relevant data, manage and query it. As mentioned, the proposed solution allows the users to query the real-time and historic data, therefore, there is a need to have a Data Stream Management System (DSMS) and a Relational Database Manage System (RDBMS) to handle these types of information.
Chapter 4
Technology 4.2 Data Storage and Manipulation
25
Relational Database Management System
RDBMS is Database Management System (DBMS) based on the relational model and was introduced by E. F. Codd in 1970. This type of system is used in this project for storing the structural and historic data, where the structural data is the characteristics of an equipment or of a space and the historic is about relevant details, as the energy consumption of which day.
For managing this information it was choose the MySQL24 platform. MySQL is a popular open-source
database that is mainly used in web applications. For the purpose of this thesis, was considered that the use of RDMS such as Oracle or MSSQL were excessively complex for the target objective. Therefore, MySQL appears as a viable alternative because it can be used in many platforms and supports the essential SQL commands for storing and retrieving information.
Data Stream Management System
For dealing with the real-time data, RDBMS are not the right approach, since they are used for manage static data and where complex queries are less frequent. DSMS as mentioned in the section 2.3, are systems designed for working with transient data and that perform continuous queries over the data. However, with the need for real-time process event in applications, several DSMS were developed:
STREAM25, AURORA26, Niagara27, TelegraphQC28 and PIPES29 were dissertation projects that
implement the notions of DSMS, but their development was dropped once the projects were concluded.
StreamBase30 and InfoStream31 are two types of platforms able to perform the necessary
functions, but they are proprietary systems and, because of that, they have a limited support from the community.
Given this reasons, we choose Esper32 to perform the customized queries over the real-time data.
Esper is an open source event stream processing (ESP) and Complex Event Processing (CEP) [48] available for Java as Esper, and for .NET as NEsper. In order for processing real-time event, Esper offers the Event Processing Language (EPL). EPL is a declarative language for perform filtering, aggregation and joins, that can be over sliding windows of multiple event series.
The Complex Event Processing from Esper is considered as a traditional database turned upside-down [48]. As mentioned in the Section 2.3, this type of databases do not perform a query against storage data, they store queries and run the data through it, being able to respond in real-time when the data match the query. Esper also provides a Relational Database Adapter for saving and joining real-time data, with historical data, contained in standard relational database using JDBC.
24 http://www.mysql.com/
25 http://www-db.stanford.edu/stream
26 http://cs.brown.edu/research/aurora/
27 http://research.cs.wisc.edu/niagara/
28 http://telegraph.cs.berkeley.edu/telegraphcq/
29 http://dbs.mathematik.uni-marburg.de/Home/Research/Projects/PIPES
30 http://www.streambase.com/
31 http://www-01.ibm.com/software/data/infosphere/streams/
Technology 4.2 Data Storage and Manipulation