António Afonso & Jorge Silva
Determinants of non-resident
government debt ownership
WP03/2016/DE/UECE _________________________________________________________ Department of Economics
W
ORKINGP
APERS ISSN 2183-18151
Determinants of non-resident government
debt ownership
*
António Afonso
$and Jorge Silva
2015
Abstract
We examine the determinants of non-resident government debt ownership, accounting for domestic and external factors and financial variables during the period 2000Q2-2014Q4, focussing on a small euro area open economy: Portugal. Our results show that better fiscal positions, higher systematic stress in Europe, and higher shares of MFI cross-border holdings of public debt, increase the share of non-resident held debt, and rising sovereign yields decrease that ratio.
Keywords: sovereign debt, central bank, financial markets, monetary and financial institutions, Portugal.
JEL: C22, E44, F34, G15, H63.
*
The opinions expressed are those of the authors and not necessarily those of the respective employers.
$
ISEG/UL - University of Lisbon, Department of Economics; UECE – Research Unit on Complexity and Economics. UECE is supported by Fundação para a Ciência e a Tecnologia (Portuguese Foundation for Science and Technology). email: aafonso@iseg.utl.pt.
ISEG/UL – University of Lisbon, email:jorgefariasilva@gmail.com.
2
1. Introduction
It is well accepted that the longer term macroeconomic implications of high external and public debt is a crucial issue for both public debt management and for the implementation of fiscal policies. For instance, Reinhart and Rogoff (2010) considered that there were particularly high external debt levels across Europe. Therefore, it is relevant to find the determinants of the weight of the public external debt on the public debt held by residents.
In addition, Al-Eyd and Berkmen (2013) considered that euro area financial markets remained fragmented in 2013 and retail interest rates in peripheral countries were far above those in the core. Therefore, fragmentation had prevented the flow of credit and damaged the transmission of monetary policy, and the ECB would have to undertake additional policy measures. In fact, Drifill (2015) reports that the ECB adopted a policy of quantitative easing early in 2015.
Reis (2013) considered that since 2000 Portugal became financially integrated with the rest of the euro area and net foreign borrowing rose, which left it particularly exposed to the economic and financial crisis of 2008-2009. After 2010, there was a sudden stop in capital flows, which plunged the country into a crash. Fears of solvency of the sovereign and banks put country at risk. If banks fail, government’s spending increases directly (bailout) or indirectly (recessionary economic impact).
Therefore, the aim of this study is to assess the decomposition of government debt ownership between resident and non-residents, with the focus in the case of a small open economy: Portugal. Specifically, we examine the variation of the ratio between public debt held by non-residents and public debt held by residents, accounting for both domestic and external factors, and financial variables during the period 2000Q2-2014Q4.
Our results show that: i) better fiscal positions increase the share of non-resident held debt; ii) systematic stress in Europe increased the weight of public external debt on total public debt; iii) a higher share of monetary and financial institutions (MFI) cross-border holdings of sovereign debt issued by the other euro area countries was correlated with higher share of the Portuguese public debt held by non-residents; iv) since 2009 the higher amount of external debt of the central bank went together with national MFIs holdings of Portuguese sovereign debt; v) a dummy crisis since 2009 flags the reduction of the share of non-resident held debt, and the same is true for rising 10-year yields.
3
2. Methodology and data
According to the European Commission, the financial conditions in the euro area were more fragmented in 2012 due to: i) retrenching cross-border interbank capital flows; ii) rising home bias in sovereign-bond holdings; iii) growing divergence of funding costs for banks and sovereigns. Therefore, fragmentation led to divergent bank lending volumes and bank-lending across the euro area.
On the other hand, there was financial integration in the period between the introduction of the euro in 1999 and the outbreak of the global financial crisis in 2009. In fact, the euro area banking sector recorded a process of integration, mostly in wholesale banking and capital markets. There are some possible indicators to quantify the financial integration/fragmentation of the euro area.1
During the period 2000Q-2001Q4 the debt-to-GDP ratio was below the threshold 60% underlying to the Stability and Growth Pact, and the debt held by non-residents (external debt) was lower than the public debt held by residents.
Along the period 2002Q1-2010Q1, the debt-to-GDP ratio increased above 60% via external debt, while the debt held by residents was stable. In the period 2010Q2-2011Q1, there was a reduction of the weight of public external debt. During this period, international creditors (MFIs) sold Portuguese sovereign debt in the secondary market and reduced purchases in the primary market. In addition, there were sovereign downgrades for Portuguese sovereign debt. Finally, during the economic and financial adjustment programme (EFAP) in the period 2011Q2-2014Q2 official debt increased.
[Figure 1]
Figure 2 details the evolution of the external debt during the period 1997-2014 as percentage of GDP by institutional sector. The share of other MFIs increased until 2010, decreasing afterwards due to: i) difficulty of access to international financial markets; ii) deleveraging measures underlying the EFAP. On the other hand, central bank’s share has increased, especially after 2009, following the support given to national financial institutions.
[Figure 2]
4
Figure 3 presents the ratio of non-resident held debt to resident held public debt, the dependent variable for our estimations.
[Figure 3]
Moreover, we include economic and financial variables in line with theory: Fundamentals: structural budget balance2
and potential output.3
Financial volatility: VIX as a proxy for global financial volatility and the Composite Indicator of Systematic Stress (CISS) as a measure of financial stress in Europe.
External debt of the national monetary authority and the ECB.
Financial fragmentation/integration: the share of MFIs cross-border holdings of sovereign debt securities issued by euro area.
Furthermore, we use control variables related with the economic growth, budget balance, interest rates and financial markets.
3. Empirical analysis
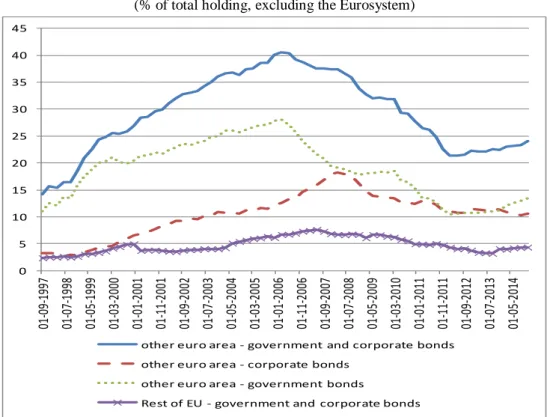
Figure 4 presents the share of MFIs cross-border holdings of debt securities issued by euro area and EU corporates and sovereigns. In our estimations we use as proxy of financial integration/fragmentation the cross-border holdings of other euro area – government bonds, i.e. sovereign debt issued by the other countries of the euro area.
[Figure 4]
The persistent low share of euro area MFI cross-border holdings was an element of some fragmentation of the euro area sovereign bond markets. According to the quantity-based indicator there was a continued fragmentation of the euro area sovereign bond market from 2006Q1 until 2012Q1. Still, there was stabilization in the cross-border holdings of government bonds in 2013 and a reversal towards reduced fragmentation in 2014.
Furthermore, there was an increase in financial stress in Europe in 2007-2008 and during the second semester of 2011. Subsequently, there was a reduction of financial stress and a minimum in 2013Q4.
2 Source: IMF database, 30 October 2015. 3
5
For our analysis, (1) identifies two sets of independent variables:
∆ (𝑝𝑢𝑏𝑙𝑖𝑐 𝑑𝑒𝑏𝑡𝑡 𝑛𝑜𝑛_𝑟𝑒𝑠𝑖𝑑𝑒𝑛𝑡𝑠 𝑝𝑢𝑏𝑙𝑖𝑐 𝑑𝑒𝑏𝑡𝑡 𝑟𝑒𝑠𝑖𝑑𝑒𝑛𝑡𝑠 )= 𝛽0+ 𝛽1𝑋𝑡 𝑑𝑜𝑚𝑒𝑠𝑡𝑖𝑐+ 𝛽 2𝑍𝑡 𝑒𝑥𝑡𝑒𝑟𝑛𝑎𝑙+ 𝑢 𝑡 (1)
where the dependent variable is the public external debt as percentage of the domestic public debt; 𝑋𝑡𝑑𝑜𝑚𝑒𝑠𝑡𝑖𝑐 includes domestic independent variables; and 𝑍
𝑡𝑒𝑥𝑡𝑒𝑟𝑛𝑎𝑙 is the set of external independent variables. Table 1 reports the main set of results.
[Table 1]
The following determinants are statistically significant:
Domestic factors: the structural budget balance, the external debt of the central bank, the openness degree due to the exports-to-GDP, and the current and capital account.4
External and financial factors – integration/fragmentation of the sovereign debt in the euro area, systematic stress in Europe and financial crisis since 2009. For instance, regression (4) shows that an increase in the structural budget balance (1p.p.) raised the dependent variable (3.49p.p.), i.e. international creditors increased their share of sovereign debt ownership when public finances improved. Moreover, when MFIs increased holdings of public debt (1p.p.) issued by the other euro area countries that concomitantly increased the weight of the Portuguese government debt held by non-residents (6.01p.p.). A raise of financial stress (0.1) meant an increase of the dependent variable (5.45p.p.), i.e. when there was higher financial stress, sovereign debt was perceived as a safe haven.
In addition, the increase of the external debt of the central bank since the economic and financial crisis of 2008-2009 was correlated with a decrease of the ratio of public debt held by non-residents over public debt held by residents (-3.66p.p.). On the other hand, an increase of the exports-to-GDP ratio had a negative impact on the share of the public debt held by non-residents.
Moreover, regression (6) shows that the effect of the variation of the Portuguese 10-year sovereign yield is statistically significant. A rise of the q-o-q variation (100 basis points) decreased the ratio of non-resident held-to-resident held government
6
debt (-7.4p.p.), which may hint at doubts from non-residents regarding the risk associated the rising yield.
We also analysed the role of potential output before the EFAP (2000Q2-2011Q1), which is marginally statistically significant in regression (8) (although not for the full period).
In addition, other determinants, for example, the VIX, the y-o-y growth rate of real GDP in Portugal and in the euro area, the difference of the growth rates, interest rates underlying liabilities and assets, 3 months Euribor, S&P500 and the budget balance proved not statistically significant.
4. Conclusions
We examined the determinants of non-resident government debt ownership, accounting for domestic and external factors and financial variables during the period 2000Q2-2014Q4, focussing on a small euro area open economy: Portugal.
Our results show that better fiscal positions increase the share of non-resident held debt. Moreover, higher systematic stress in Europe increased the weight of public external debt on total public debt and the same is true for the share of MFI cross-border holdings of sovereign debt issued by the other euro area countries.
Finally, during the 2009Q1-2011Q1 more external debt of the central bank went together with national MFIs increasing holdings period of Portuguese sovereign debt. The 2009 crisis reduced the share of non-resident held debt and the same is true for rising 10-year sovereign yields. After 2011Q1 there was a reduction of national MFIs holdings of public debt in favour of external debt from the international institutions.
7
5. References
Al-Eyd, A., & Berkmen, S. P. (2013, October). Fragmentation and Monetary Policy in the Euro Area. IMF, wp/13/208.
European Central Bank. (2014, April). Financial integration in Europe.
European Commission. (2012, Autumn). European Economic Forecast. pp. 34-36. Holló, D., Kremer, M., & Duca, M. L. (2012, March). CISS – A Composite Indicator of
Systemic Stress in the Financial System. European Central Bank.
Krugman, P., & Eggertsson, G. B. (2011, 2 14). Debt, Deleveraging, and the Liquidity Trap: A Fisher‐Minsky‐Koo approach.
Reinhart, C. M., & Rogoff, K. S. (2010, May). Growth in a Time of Debt. American Economic Review, pp. 573-578.
Reis, R. (2013, Spring). The Portuguese Slump and Crash and the Euro Crisis. Brookings Papers on Economic Activity, 46, pp. 143-193.
8
Figure 1 – Public debt: total, held by non-residents and by residents
(% of GDP)
Source: Banco de Portugal, Statistics Portugal, and own calculations.
Figure 2 – Gross external debt by institutional sector
(% of GDP)
Source: Banco de Portugal, Statistics Portugal, and own calculations.
0 20 40 60 80 100 120 140 01 -03 -2000 01 -12 -2000 01 -09 -2001 01 -06 -2002 01 -03 -2003 01 -12 -2003 01 -09 -2004 01 -06 -2005 01 -03 -2006 01 -12 -2006 01 -09 -2007 01 -06 -2008 01 -03 -2009 01 -12 -2009 01 -09 -2010 01 -06 -2011 01 -03 -2012 01 -12 -2012 01 -09 -2013 01 -06 -2014 01 -03 -2015
Total public debt Gross external public debt Public debt held by residents
0 20 40 60 80 100 120 01 -03 -1996 01 -08 -1996 01 -01 -1997 01 -06 -1997 01 -11 -1997 01 -04 -1998 01 -09 -1998 01 -02 -1999 01 -07 -1999 01 -12 -1999 01 -05 -2000 01 -10 -2000 01 -03 -2001 01 -08 -2001 01 -01 -2002 01 -06 -2002 01 -11 -2002 01 -04 -2003 01 -09 -2003 01 -02 -2004 01 -07 -2004 01 -12 -2004 01 -05 -2005 01 -10 -2005 01 -03 -2006 01 -08 -2006 01 -01 -2007 01 -06 -2007 01 -11 -2007 01 -04 -2008 01 -09 -2008 01 -02 -2009 01 -07 -2009 01 -12 -2009 01 -05 -2010 01 -10 -2010 01 -03 -2011 01 -08 -2011 01 -01 -2012 01 -06 -2012 01 -11 -2012 01 -04 -2013 01 -09 -2013 01 -02 -2014 01 -07 -2014 01 -12 -2014
9
Figure 3 – Ratio between public debt held by non-residents and public debt held by residents
(percentage)
Source: Banco de Portugal, Statistics Portugal, and own calculations.
Figure 4 – Share of MFIs cross-border holdings of debt securities issued by euro area and EU corporates and sovereigns
(% of total holding, excluding the Eurosystem)
Source: ECB. 0 50 100 150 200 250 300 350 400 450 01 -03 -2000 01 -10 -2000 01 -05 -2001 01 -12 -2001 01 -07 -2002 01 -02 -2003 01 -09 -2003 01 -04 -2004 01 -11 -2004 01 -06 -2005 01 -01 -2006 01 -08 -2006 01 -03 -2007 01 -10 -2007 01 -05 -2008 01 -12 -2008 01 -07 -2009 01 -02 -2010 01 -09 -2010 01 -04 -2011 01 -11 -2011 01 -06 -2012 01 -01 -2013 01 -08 -2013 01 -03 -2014 01 -10 -2014
Ratio between public debt held by non-residents and public debt held by residents
0 5 10 15 20 25 30 35 40 45 01 -09 -1997 01 -07 -1998 01 -05 -1999 01 -03 -2000 01 -01 -2001 01 -11 -2001 01 -09 -2002 01 -07 -2003 01 -05 -2004 01 -03 -2005 01 -01 -2006 01 -11 -2006 01 -09 -2007 01 -07 -2008 01 -05 -2009 01 -03 -2010 01 -01 -2011 01 -11 -2011 01 -09 -2012 01 -07 -2013 01 -05 -2014
other euro area - government and corporate bonds other euro area - corporate bonds
other euro area - government bonds
10
Table 1 – Estimations of the q-o-q quarterly change of the ratio between public debt held by non-residents and public debt held by residents
(percentage points)
Notes: t-statistics in brackets. *, **, *** denote significance at 10, 5 and 1% levels. Heteroskedasticity and Autocorrelation Consistent Covariance (HAC) or Newey-West estimator. Regressions were estimated by OLS.
Variable (1) (2) (3) (4) (5) (6) (7) (8)
constant 27,58*** 26,17*** 25,81*** 24,48*** 24,49*** 18,65** -0,41 40,87*** (4,4) (4,1) (4,2) (3,7) (3,7) (2,4) (-0,1) (3,1)
yoy potential output 3,51 -4,39**
(1,3) (-2,2) Structural budget balance 4,65*** 3,87*** 3,69*** 3,49*** 3,52*** 2,46* 5,37***
(3,6) (3,2) (3) (2,7) (2,7) (1,7) (2,7)
∆ cross holdings of government bonds 10,8** 4,47* 8,34*** 6,01** 5,76** 4,24* 7,61***
(2,2) (1,8) (2,9) (2,5) (2,3) (1,8) (2,8)
∆ CISS 66,34** 54,49** 52,3** 64,16**
(2,5) (2,5) (2,1) (2,5)
∆ external debt central bank -2,58* 0,47 0,47
(-1,8) (0,4) (0,4)
(∆ external debt central bank)*dummy_crisis -3,47*** -3,66*** -4,14** -4,01** -5,99*** -4,15*** (-2,9) (-2,7) (-2,3) (-2,2) (-10,4) (-5,4) Δ exports as % of GDP -7,69*** -6,21*** -5,46*** -5,44*** -3,89** -7,11***
(-3,4) (-3,4) (-3) (-2,9) (-2,2) (-2,8)
Δ current and capital account as % of GDP 1,39* 1,62*
(1,9) (2)
Δ Portuguese sovereign yield 10 years -7,42**
(-2,4)
R-square 0,33 0,62 0,57 0,62 0,62 0,65 0,56 0,72
Durbin-Watson 1,98 2,06 2,18 2,03 2,02 2,19 1,95 2,33
Observations 59 59 59 59 59 59 44 44