Combined Master Thesis
Board composition and capital structure choice
Vic Mens1
MSc. Financial Economics / MSc. Finance December 2018
Supervisor: João Amaro de Matos (Nova SBE), Pomme Theunissen (Maastricht university)
ABSTRACT
The present study addresses how and the extent to which the composition of the board impacts the capital structure choices made by a firm. In particular, the fraction of independent directors, the degree of gender- and nationality diversity, board size, and CEO duality have been analysed. By using a unique panel dataset, this study shows that firms that have a stronger presence of female directors on the board issue more equity as compared to debt. In particular, the results show that when the presence of female directors in the board is at least 30%, firms (1) hold less internal capital as compared to short-term debt and (2) hold more external equity as compared to long-term debt. The results also provide evidence that firms with a larger fraction of independent directors on the board, a larger board size, or CEO who also holds the position of the chairman, use more risky financing sources in their capital structure. On the contrary, firms that have a more nationality diverse board tend to be less levered, and in particular use less long-term debt. Overall, this study echoes the findings in previous studies that certain board attributes should not be ignored in capital structure models.
Keywords: Board of directors, board composition, gender diversity, capital structure
Table of Contents
LIST OF TABLES 3
1. INTRODUCTION 4
2. LITERATURE REVIEW 6
2.1 The irrelevance theorem 7
2.2 Pecking order theory 9
2.3 Market timing theory 10
2.4 The board of directors 11
2.5 Hypotheses development 14
3. DATA AND METHODOLOGY 17
3.1 Dependent variables 19 3.2 Independent variables 19 3.3 Control variables 20 4. RESULTS 25 4.1 Descriptive statistics 25 4.2 Research results 28
4.2.1 Results for leverage 30
4.2.2 Research results per financing source 32
4.2.3 Research results for the relative use per financing source 35
5. ROBUSTNESS 38
5.1 Robustness for market values 39
5.2 Cross-sectional results 39
5.3 Separation of indices 41
6. DISCUSSION 43
6.1 Main analysis 43
6.2 Limitations and suggestions for future research 46
7. CONCLUSION 48
List of Tables
Table I: Descriptive statistics 24
Table II: Correlation Matrix 26
Table III: Panel data regression results of leverage (book values) 28
Table IV: Panel data regression results of capital structure (book values) 30
Table V: Panel data regression results of financing mix 34
Table VI: Panel data regression results of leverage (market values) 37
Table VII: Panel data regression results of leverage decomposed by index 39
Table A.III: Descriptive statistics decomposed by Index 53
Table A.IV: Variance inflation factors (VIF) 53
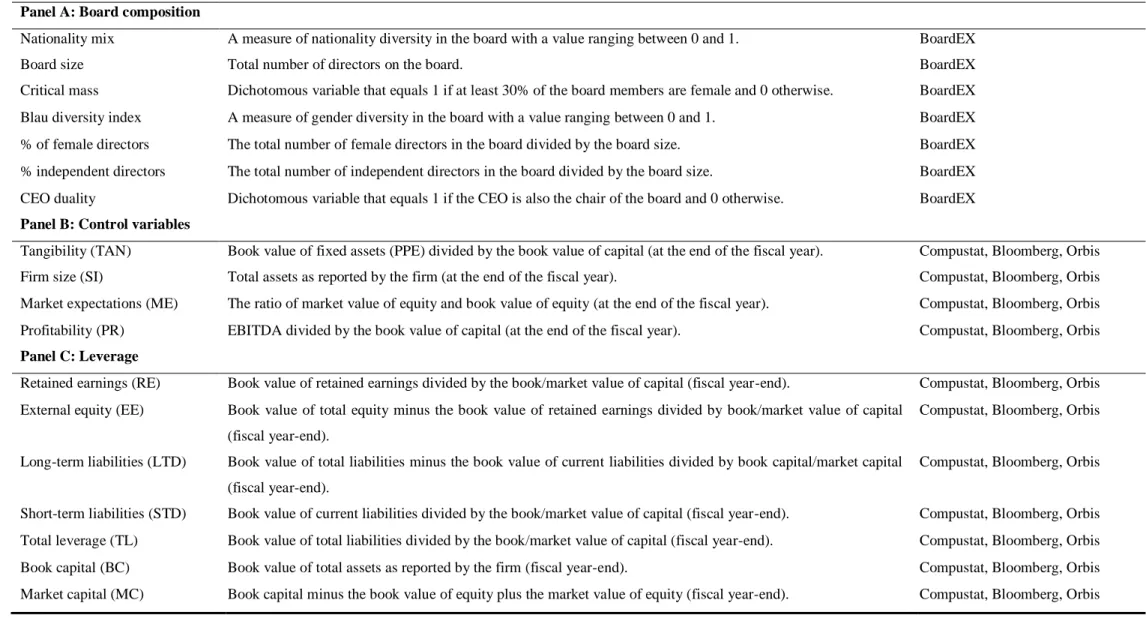
Table A.I: Variables description 54
Table A.II: Descriptive statistics decomposed by year 55
(continued) Table A.II: Descriptive statistics decomposed by year 56
Table A.V: Panel data regression results of capital structure (market values) 57
Table A.VI: Panel data regression results decomposed by index 58
Table A.VI: Cross-sectional regression results 59
1. Introduction
In recent years, firms have come under increasing pressure to reform the composition of the board of directors. In particular, the call to firms to promote gender equality within the board is one of the most prominent areas of attention. California is on the forefront of regulating gender equality in the United States, as it is the first state that mandates a gender quota for female directors on corporate boards2. In 2018, the Governor of California passed a law that
requires any publicly held firm headquartered in California to hold a representative number of female directors on its board by the end of 2019. In Europe, the push for gender diversity already set foot in 2008, when Norway mandated public limited firms that at least 40% of both genders must be represented on their boards (Storvik & Teigen, 2010). Following this example, Iceland enacted a corporate gender quota in 2013, and at this moment the United Kingdom and the Netherlands are contemplating the same (Dobson & Rastad, 2018). Despite that there are certain ethical arguments for the increased regulatory focus on the composition of the board, most arguments are of an economic nature (Campbell, 2008).
First, it must be elucidated that the board of directors has, inter alia, the responsibility to oversee the activities and the performance of the firm and has the jurisdiction to sanction or replace executive directors (carter et al., 2010). Therefore, it is argued that when the board is composed in such a that it effectively fulfils its duties, corporate governance and consequently firm performance could be improved (Adams & Ferreira, 2009). Over the past decade the inherent role of the board of directors has received considerable interest, resulting in a recent trend of research into the impact of different board composition attributes. For example, there have been studies that test the association between the fraction of female board directors and firm performance (e.g. Adams & Ferreira; Gordini and Rancati, 2017); studies that establish whether board independence reduces earnings management (e.g. Hutchinson et al., 2015; Sultana, 2015); and studies that consider the economic consequences of CEO duality3 (e.g.
Adams et al., 2005; Tang, 2017).
This study contributes to this growing body of literature by testing whether the composition of the board of directors influences the capital structure of firms. Given that the decision-making
2 The legislation, formally referred to as the senate Bill No. 826, concerns publicly held corporations
on capital structure is influenced by the management team and the board has the responsibility to align the actions of the managers with the interests of the shareholders (Myers, 2001), I expect to find a relationship between the board of directors’ composition and the capital structure of firms. The contribution of this study is threefold. First, this study relies on a very recent dataset with board-specific information collected over the period of 2010 to 2017, while the majority of the research builds on a sample from before 2010 (e.g. Adams & Ferreira, 2009; Alves et al., 2015). Since the regulatory attention on the unequal distribution of board members has increased considerably in recent years, the present study offers a better insight into the current situation. Second, this study brings the research on board composition to the next level by incorporating several board-specific attributes that are, as per my knowledge, not been examined before in the current context. For example, apart from the inclusion of a wide range of gender-related measures that account for the impact of gender diversity, the present study controls for nationality diversity, a factor that is often ignored due to data limitations. Finally, being one of the first to congregate the pecking order theory with the study on board composition, this study paves the way for further extensive research.
To examine the association between the board of directors’ composition and capital structure, this study will build on the assumptions of the pecking order theory (Myers & Majluf, 1984). In short, this theory argues that information asymmetries between managers and outside investors inflate the costs of external financing and restrict firms the access to capital markets. Since managers know more about the future prospects of the firm, outside investors will be cautious when a firm issues external capital and will demand higher returns as the degree of information asymmetry increases. Given this, the theory predicts that because information asymmetries between managers and outside investors are more severe for riskier securities, firms prefer to finance with internal capital4, and if external financing is needed, primarily with
(short-term) debt rather than with external equity in order to avoid issuing securities at high costs.
Nevertheless, according to Alves et al. (2015) firms become more inclined to issue external capital, and in particular the riskier securities when information asymmetries are being moderated. In the vein of Amaro de Matos & Mergulhão (2018), the present study conjectures that when the board of directors is composed in such a way that it effectively reduces
information asymmetries between the management and outside investors, one could see a shift in the use of financing sources. By using a unique panel dataset that captures a wide range of board-specific characteristics for 504 firms over a period of 10 years, this study addresses how and the extent to which the composition of the board affects the capital structure choices made by a firm. The focus of this study will be on, but not limited to, the role of gender diversity in the board. In particular, the fraction of independent directors, the degree of gender- and nationality diversity, board size, and CEO duality will be analysed.
After controlling for a wide-range of control variables, I find that firms that have a stronger presence of female on the board tend to issue more equity as compared to debt. In particular, the results show that when the presence of female directors gets more substantial5, firms tend
to (1) use less internal capital as compared to short-term debt and (2) hold more external equity as compared to long-term debt. However, this study also reveals that when boards are getting more heterogeneous, firm tend to rely more on safer financing sources such as internal capital. Overall, the results contribute well to the fierce debate about how and whether the composition of corporate boards needs be reformed. At the very least, the empirical results question the recent trend in one-size-fits-all rule-based reform proposals such as strict gender quotas.
This study is organized as follows. Section 2 elucidates the theoretical foundation and existing literature on capital structure and discusses the influence of board composition as found in previous studies. In addition, I will state the research hypotheses that will serve as a guidance throughout this paper. Section 3 deals with the methodology and research design and Section 4 presents the empirical results. In Section 5 several robustness checks are performed and in Section 6 the results and implications are discussed in depth. The main conclusions are summarized in Section 7.
2. Literature Review
The literature on capital structure theory is generally separated in two main streams of thought: (i) the trade-off theory and (ii) pecking-order theory. The theoretical framework of both theories can be used to predict the associations between firm characteristics and the financing choices
made by the firm (Amaro de Matos, 2001). Complementary to both the trade off- and the pecking order-theory is the agency theory. The latter is often used to explain the deviations from the main predictions and provides rationale for the influence of the board composition on financial decision-making (Van der Walt & Ingley, 2003). This section attempts to shed light on the main capital structure theories and reviews the empirical evidence as found in previous studies. In addition, this section elaborates on the association between capital structure and board composition from a theoretical and empirical perspective. Accordingly, the research hypotheses will be stated.
2.1 The irrelevance theorem
Modern thinking on capital structure theory has been originated from the seminal paper of Modigliani & Miller (1958). The authors created a framework through which they explained how the capital structure of a firm is related to the value of a firm. This framework is often cited as the irrelevance theorem and will therefore be named accordingly. The irrelevance theorem states that in a world of perfect capital markets (i.e. in the absence of arbitrage opportunities, taxes, trading costs and bankruptcy costs), the capital structure is irrelevant to the value of a firm. Modigliani & Miller (1958) rationalized this proposition by illustrating that the value of a firm should be equal to the present value of the total expected future cash flows that are generated by the assets of the firm. As such, choosing a certain amount of debt and equity to finance these assets will divide the future cash flows among debt and equity investors but will not alter the total cash flows that are generated by the assets itself (Frank & Goyal, 2009). Since the value of a firm depends solely on the expected future cash flows, the financing mix is irrelevant to the value of the firm. Although theoretically intuitive, the underlying assumptions of the irrelevance theorem do not hold in the real world. Nevertheless, the fundamental ideas were revolutionary and served as a basis for extensive future research on capital structure.
2.3 Trade-off theory
The trade-off theory posits that when market imperfections such as corporate taxes are included in the model, there exists an optimal level of leverage that maximizes the difference between the benefits and costs of debt financing. The benefits of debt are typically linked to the capitalization of tax shields that result from the interest payments to debt holders. In short, since interest is tax deductible, the total cash flows available to debt and equity holders will increase when debt is used in favour of equity. As a result, the total firm value increases when the
fraction of debt in the capital structure increases. However, this does not imply that the optimal capital structure consists out of 100% debt financing. Strictly speaking, the use of leverage comes at a cost. In general, the costs related to debt are commonly referred to as financial distress costs and include the costs of bankruptcy (e.g. Kraus & Litzenberger, 1973; Fama & French, 2002), transaction costs (e.g. Frank & Goyal, 2009) and agency costs (e.g. Jensen & Meckling, 1976). Therefore, when an increasing amount of debt is used in the capital structure, not only the present value of the tax shields will increase but also the present value of the financial distress costs. As such, the optimal level of leverage is reached when the marginal increase in the costs of debt will equal the marginal increase in the benefits of debt.
Notwithstanding the fact that distress costs play a major role in the trade-off between debt and equity funding, also agency costs that arise from the conflicts in interest between debt- and equity holders need to be considered in the trade-off model. Under the assumption that both the capital providers and the managers of a firm are utility maximisers, there is good reason to believe that managers will use their discretionary power on the firm’s investment process for personal benefits. Regarding the investment decisions of a firm, it must be mentioned that whilst bondholders are entitled to a predefined claim of the future cash flows of a firm, equity holders are left with the residuals. As stated by Merton (1973), equity can be seen as a call option with an appreciation in value as the upward potential of the underlying asset increases. The shift to more risky investments can cause the expected payoff to equity holders to increase at the cost of the debt holders. However, rational debt holders can limit the divergence in interests by establishing protection mechanisms in the form of debt contracts (e.g. debt covenants) and by taking monitoring measures to control the actions of the management (Jensen & Meckling, 1976). Moreover, debt holders will require a higher rate of return on debt capital to compensate for the potential excessive risk taking by the management. As such, the notion that the costs associated with agency problems typically increase with the amount of debt in the capital structure could explain why the actual levels of leverage that are observed in a firm’s capital structure tend to be lower than optimal (Morrelec, 2004).
A plethora of evidence for the trade-off theory is found in existing literature but competing voices criticize the importance of the input variables. With respect to the role of taxation benefits, Fama & French (1998) and Graham (2000) recognize the importance of the tax shields but find no evidence that this tax effect is of great importance for a firm’s capital structure.
structure determinant (Jensen & Meckling, 1976; Myers, 1984). With contrasting results, Miller (1977) discussed the relevance of taxation benefits versus the costs associated with bankruptcy. The author claims that the costs of bankruptcy are disproportionately small relative to the tax savings that stem from the use debt. The argument to lower the debt appetite significantly based on expected bankruptcy costs is therefore to be rejected in his view. Morellec et al. (2012) developed a model which examined the importance of agency conflicts in the capital structure choice of a firm. According to the study, board independence and insider ownership are effective mechanisms to reduce the conflicts of interests between shareholders and the board of directors and therefore reduce agency costs. Contrarily, CEO power and CEO tenor are positively related to agency costs. Based on their model, there appears to be a strong relation between the capital structure choice of a firm and the presence of agency problems. Notably, firms which are highly sensitive to agency problems tend to issue less debt and restructure less frequently than firms which are less sensitive to agency problems.
2.2 Pecking order theory
The pecking order theory popularized by Myers & Majluf (1984), postulates that there is a preferred order in which funding sources should be used. The theory is based on the notion that there exists a certain degree of information asymmetry between outside investors and firm insiders which inflates the costs of external financing. As such, the pecking order theory presents a model that helps to minimize the financing costs that result from asymmetric information problems. Within the model, there are three sources of funding available: retained earnings, equity, and debt. First, retained earnings are not associated with asymmetric information problems since it is internal capital. As a result, this will be the first source of capital to be used when funding is needed. When a firm needs to enter the capital markets for external financing, either debt or equity can be issued. Debt securities are strictly less risky than equity since it comes with a prioritized claim on the cash flows of the firm and/ or carry collateral (Shleifer & Vishny, 1997). Equity holders are only entitled to the residual claim and are therefore subject to serious adverse selection problems. Therefore, the issuance of debt should be preferred over equity.
The idea behind the pecking order theory is that the management of a firm has more information about the expected cash flows of a company than outside investors and is therefore better able to give an appropriate valuation of the firm (Myers & Majluf, 1984). If the management decides
to sell equity to raise funding instead of debt, rational investors will question why this source of funding is used. According to the adverse selection theory, managers will only issue equity if they believe that the current market value of the firm is overvalued (Myers & Majluf, 1984). On the contrary, if the management believes that the firm is undervalued, it will refuse to give up on the expected future cash flows against a discount and will turn to the debt market to raise funding. Under the consideration that investors are rational and aware of this problem, a higher adverse selection premium is demanded for equity than for debt. The relative increase in financing costs when equity is used instead of debt forms the second financing order consideration. Accordingly, if internal capital is not available, funding must be raised from debt capital. Here we must make a distinction in the seniority of payments between senior debt and junior debt and will prefer senior debt over junior debt since the former is less sensitive to asymmetric information. Moreover, we must make a distinction with regard to the tenor of the debt security. Since the level of information asymmetry is limited for short-term debt relatively to long-term debt, shorter tenors should be preferred. The least preferred source of funding that should be considered is the issuance of equity and should only be used if the firm has reached its debt capacity limit (Fama & French, 2005).
It has become clear that information asymmetry problems and agency costs are key determinants in explaining capital structure choices made by firms. Although there is supporting evidence for several predictions of the pecking order theory (Frank & Goyal, 2003), it does not capture all the variation in the capital structure choices made by firms (e.g. Fama & French, 2002; Lemmon & Zenders, 2010).
2.3 Market timing theory
Notwithstanding the fact that the aforementioned theories are the main streams of thought in the realm of capital structuring, the market-timing theory is getting clear attention in recent literature. Baker & Wurgler (2002) argue that the capital structure of a firm is the result of managers attempt to align the firm’s funding needs with the conditions on the equity market. In this practise, the firm tends to issue equity when the market capitalization of the firm is considered to be overvalued and will repurchase equity from the market when the shares are considered to be undervalued (Baker & Wurgler, 2002). Clearly, in a world of perfect capital markets as described in Modigliani & Miller (1958) this line of thought is invalid since current market values should reflect the correct price at any time. However, Taggart (1977), Baker &
Wurgler (2002), and Alti (2006) find that the finance decisions of firms are often dependent on the book-to-market ratio of the firm’s equity. As such, if this book-to-market ratio is relatively high, firms tend to issue more equity as compared to debt. Furthermore, Graham & Harvey (2001) show that the majority of CFO’s admit that market timing plays a significant role in financial decision making.
Evidently, there is no concession or universally accepted theory that explains the capital structure choices made by firms. Study that shows which characteristics drive capital structure decisions is extensive but lacks consistency and is incomplete. A new line of research attempts to fill this gap by linking capital structure theory to corporate governance. Overall, literature evinces that corporate governance features should be present in capital structure models (Alves et al., 2015). I will discuss this stream of literature in detail in the following paragraph.
2.4 The board of directors
The initial study on capital structure determinants is mainly focussed on financial and economic factors. However, it has become clear that softer variables such as culture, gender, and corporate governance play an important role in explaining financial decision-making (e.g. Hersch & Farrell, 2005; Adams & Ferreira, 2009; Aggarwal & Goodell, 2014). In particular, the agency theory provides good rationale for the association between the composition of the board and the capital structure choices made by firms. Following the agency theory, it is evident that the separation of ownership and control within firms could lead to strong conflicts of interests between shareholders and managers, conceptualized by the term agency problems. An important mechanism to reduce these agency problems and to align the interests of the managers with the interests of the shareholders is the board of directors. Fama & Jensen (1983) describe the role of the board of directors as a decision control system that serves on behalf of the shareholders and helps to ensure that the managers act in the best interests of the owners. In general, the board has the responsibility to oversee the activities and the performance of the firm but has also the jurisdiction to sanction or replace executive directors. The composition of the board is traditionally divided between the CEO, the chairman, executive directors, and non-executive (independent) directors. However, in the context of corporate governance, board composition is defined in a wider sense and refers to the combination of individual characteristics, attributes and roles of the board members (Van der Walt & Ingley, 2003). The extensive amount of literature that is devoted to the composition of the board usually relies
upon the premise that monitoring by the board can improve the quality of managers’ decisions and subsequently, improve corporate performance (Yermack, 1996). However, evidently not all boards are composed in the same way and not all boards are equally effective in monitoring the management and in protecting the interests of the shareholders. Since the concept of agency problems has been a perennial subject in capital structure theory, it can be argued that the effectiveness of the board has a direct influence on the capital structure choices made by a firm. In particular, through the lens of the pecking order-theory and in conjunction with the agency theory, predictions can be made about the associations between the composition of the board and capital structure.
2.4.1 Review of empirical findings
A main issue regarding the effectiveness of the board of directors is the level of board independence (Van der Walt & Ingley, 2003). Theory articulates that independent directors are better able to monitor the management team and hold the potential to improve the corporate performance by giving more objective advice and counsel (Brennan & McDermott, 2004). In particular, independent directors have no executive responsibilities in the firm and can therefore better act in the interests of the shareholders. Alves et al. (2015) examined the association between the percentage of independent board members and firm’s capital structure. The results provide evidence that board independence is positively related to the use of external financing sources and especially to the use of long-term debt, supporting the conviction that independent directors have a positive effect on reducing agency costs. In addition, Fosberg (2004) finds that when the CEO of a firm is not the same person as the chairman of the firm, agency costs are limited, and higher levels of leverage are used. This result is in line with Fama & Jensen (1983) and supports the notion that the separation of management and control improves the functioning of the board.
Regarding the relation between board size and board effectiveness, the results in previous literature are dispersed. The optimal size of a board can be seen as a trade-off process: it needs to be large enough to provide the firm with the right resources and information, but still must be small enough to promote cohesion and efficiency. Conyon & Peck (1998) find that a large board size may hinder the effectiveness of the management, which results in a decrease in financial performance. As such, the enlargement of boards is argued to increase problems related to information asymmetries and corporate decision-making. In line with this result,
making qualities and documents that board size and firm performance are inversely related. The intuition is that the costs arising from slow decision-making, poor communication and potential director free-riding outweigh the potential benefits from a greater monitoring capacity as the board size increases (Lipton & Lorsch, 1992). Contradicting however is the study from Coles et al. (2008) on the relation between firm value and board structure. The results show that firm performance is positively related to board size, typically driven by the number of independent directors. The notion is that complex firms have greater advisory requirements and are more susceptible to environmental uncertainties, so that independent directors add significant value to the effectiveness of the board.
Besides the aforementioned factors, a multitude of studies have evaluated whether individual characteristics such as gender have an impact on board effectiveness and subsequently on corporate decision-making. Closely related to the present study, Alves et al. (2015) examined the relation between the extent of female directors in the board and the firm’s capital structure. The authors report that firms with a higher fraction of female directors on the board tend to use more external equity as compared to debt financing. Moreover, firms with more gender diverse boards appear to rely more on long-term financing sources than their gender homogeneous counterparts. However, Faccio et al. (2016) document that firms that have a female CEO or have female owners use less risky financing instruments and tend to rely more on internal capital and short-term debt. Adams & Ferreira (2009) provide evidence that gender diversity in the board positively relates to board effectiveness, especially for firms with weak governance structures. The authors report that female directors have a better attendance record in board meetings than men and show that increasing the extent of female directors’ results in less attendance problems. As a result, boards are expected to monitor the executive team better when the extent of female directors increases. Gordini & Rancati (2017) examined the relation between firm performance and board gender diversity for Italian listed companies. Results show that the percentage of women on the board has a positive impact on firm performance whilst the presence of one woman on the board on itself does not have a significant effect. This result is closely related to the critical mass theory which claims that a representation of at least 30% of female board members will be associated with better firm performance than for male dominated boards (Joecks et al., 2012). This result is confirmed by the study Torchia et al. (2011) who argue that the presence of three women in the boardroom will significantly improve firm performance.
Nevertheless, the existing body of literature leaves substantial gaps in understanding the impacts of the composition of the board. Although most of the research builds upon the argument that board effectiveness improves the quality of managers’ decisions, several researchers relate the impact of board composition to the signalling theory. For example, Certo et al. (2001) argue that the board operates as a signal mechanism to the market, meaning that when boards consist out of more independent directors, investors may gain greater confidence in the firm's potential. Kaur & Singh (2017) support this argument and provide evidence that board diversity is perceived as a positive quality signal and enhances the reputation of the firm. Petersen & Vredenburg (2009) conducted study on the link between corporate social responsibility (CSR) and corporate financial performance. Although not directly related to the present study, this research provides further insights in how certain variables could act as a signalling mechanism to the market. Of particular interest, the authors argue that CSR-oriented firms appear to signal to the market that they are a secure investment, which could lead to better access to the capital markets and as a result, to better financial performance.
2.5 Hypotheses development
According to the irrelevance theorem of Modigliani & Miller (1958), managers should exploit any investment opportunity if the rate of return is larger is than the cost of capital. Consequently, characteristics of board members should not have an impact on investment and/ or capital structure choices. However, a plethora of empirical evidence has demonstrated the contrary. As previously discussed, it is clear that information asymmetry problems and agency costs are key determinants in explaining capital structure choices made by firms. In particular, the pecking order theory conjectures that information asymmetries between managers and outside investors inflate the costs of external financing and restrict firms the access to capital markets. As such, the theory predicts that since information asymmetry is more severe for riskier securities, firms prefer to finance with internal capital, and if outside financing is needed, primarily with (short-term) debt rather than with external equity. Nevertheless, according to Alves et al. (2015) firms become more inclined to issue external capital, and in particular the riskier securities, when information asymmetries are being moderated. As a result, a board of directors composed in such a way that it effectively reduces information asymmetry problems should make it easier and less costly for the firm to issue external equity and (long-term) debt. This research complements on the pecking order theory and examines the extent to which board-specific
factors such as board diversity, board size and leadership structure affect the capital structure choices made by a firm.
First, the relation between board independence and agency costs has received strong attention from researchers (e.g. Brennan & McDermott, 2004; Alves et al., 2015). In line with the results that are previously discussed, independent board members hold the potential to decrease the level of information asymmetry between managers and capital providers. Following the pecking order theory, a more independent board is expected to face lower costs of external financing, and thus, firms with higher levels of independent board members should have better and cheaper access to external capital. Throughout this study I will classify the riskiness of (external) securities in accordance to the pecking order theory. As such, a financing source is regarded to be ‘safe’ when its valuation is independent of the disclosure of managers’ inside information (Shyam-Sunder & Myers, 1999). As previously mentioned, this will lead to the classification of four financing sources in which external equity capital is considered to be the riskiest financing source and internal equity to be the safest. Subsequently, long-term debt capital is riskier than short-term debt capital but less risky than external equity. With respect to the aforementioned arguments and clarifications, I predict the following hypothesis:
H1a: The higher the fraction of independent board members, the higher the fraction of risky securities in the firm’s capital structure.
With respect to board diversity, there are several studies that emphasize on the benefits of gender diversity in the boardroom. Adams & Ferreira (2009) report that gender diverse boards are better in monitoring executive directors and show that women have a better attendance rate in board meetings than men. Moreover, the authors document that diverse boards are more likely to hold the CEO accountable for disappointing stock performance. As such, it could be argued that female directors contribute to lower levels of information asymmetry. Alves et al. (2015) document that an increased presence of female directors in the board could improve the effectiveness of the board, reduce information asymmetry between the management and outside investors, and consequently lead firms to have better access to external capital. Moreover, Kaur & Singh (2017) report that board gender diversity could send a positive quality signal to the market and could enhance the corporate reputation. As such, I expect that gender diversity in the board contributes to lower information asymmetry; to better capital market access; and to a greater use of risky financing sources by firms. Hence, I state the following two hypotheses:
H2a: The higher the level of gender diversity in the board, the higher the fraction of risky securities in the firm’s capital structure.
H2b: The higher the level of female directors in the board, the higher the fraction of risky securities in the firm’s capital structure.
Most study on nationality diversity on the board is focused on racial differences measured by, inter alia, the fraction of racial minorities on the board or by distinguishing between white and non-white board members (e.g. Carter et al., 2010). However, study on nationality diversity instead of racial diversity is limited. Nielsen & Nielsen (2013) show that nationality diversity could reduce external uncertainties, improve firms’ transparency and subsequently mitigate information asymmetry issues with the market. Moreover, the authors argue that multinational teams engage more in in-depth discussions, have are more problem-solving approach, and arrive at more creative solutions. Although not equally defined as nationality diversity, Ruigrok et al. (2007) find that foreign board members are more likely to be independent and are more effective in their task to monitor the management. As such, I expect that nationality diversity in the board improves the effectiveness of the board and holds the potential to decrease information asymmetries between the management and outside investors. Hence, I predict the following relation:
H3a: The higher the level of nationality diversity in the board, the higher the fraction of risky securities in the firm’s capital structure.
Turning to the role of board size, its effect on information asymmetry is unclear. In line with Conyon & Peck (1998) and Yermack (1996), large boards are more likely to experience problems in communication and decision-making, which obfuscates the effectiveness of the board. As a result, the boards’ capability to monitor the management and protect the interests of the shareholders may be affected as the board size increases. However, Coles et al. (2008) state that there is a positive relation between the complexity of a firm (i.e. measured by firm size, international exposure, and leverage) and the extent to which the firm benefits from a larger board. In particular interest, the authors argue that since complex firms are facing higher advising requirements, they will benefit from having additional expertise on the board. Hence, since previous studies show dispersed results, and little is known about the complexity of the
firms that are being analysed in the present study, I am not able to predict the relation between board size and the capital structure a priori.
H4a: Board size is positively related to the fraction of risky securities in the firm’s capital structure.
H4b: Board size is negatively related to the fraction of risky securities in the firm’s capital structure.
CEO duality occurs when the CEO and the chairman of the board are the same person. According to Alves et al. (2015), boards with CEO duality are less independent and consequently less effective in controlling the corporate performance. As a result, the costs related to information asymmetries may be higher under the condition of CEO duality, leading firms to rely less on risky financing sources. Moreover, boards that are more independent from the CEO are expected to better fulfil their primary duties such as monitoring and sanctioning the executive directors. Since it is the responsibility of the board to control the CEO, I expect that CEO duality negatively impacts the functioning of the board. In line with the notion that asymmetric information increases the costs of external financing, I state the following hypothesis:
H5a: CEO duality is negatively related to the fraction of risky securities in the firm’s capital structure.
3. Data and methodology
This study uses a balanced cross-sectional time series dataset based on the constituents of the S&P 500 index and the Stoxx Europe 600 index for the period of 2010 to 2017. The Stoxx Europe 600 is one of the biggest European indices available and provides a good reflection of the European stock market. The S&P 500 is an American stock market index and is based on the 500 largest companies with a presence in either the NASDAQ or the NYSE. In order to create a balanced sample set, I excluded all the firms that are not consistently present in either the S&P 500 or in the Stoxx Europe 600 during the period of 2010 to 2017. In line with Alves et al. (2015), I exclude financial firms from the sample because of their specific capital requirements and regulations.
After filtering the firm sample, I extract the data on board composition from the BoardEX database. In order to identify the companies from the sample, I need to convert the ticker codes of the index constituents, as retrieved from Compustat, into unique BoardEX identification codes. The reason for this is that ticker codes are not unique and can belong to multiple firms, and thus, using them would offer me an incorrect dataset. In converting the tickers into BoardEX codes extreme care must be taken. As the ticker code of a firm can belong to multiple firms, BoardEX will return a large number of superfluous identification codes. As a result, I will have to verify that the firm that belongs to the identification code is an actual constituent of either the S&P 500 or Stoxx Europe 600. This is done by downloading the Index identification codes along with the country codes and subsequently removing all the firms that do not belong to the initial firm sample. For all the tickers that could not be matched with the BoardEX identification codes, correct codes had to be found manually.
After optimizing the sample set, data on board size, gender diversity and nationality diversity could be extracted. To extract the data on board independence and CEO duality, additional steps had to be taken. For example, many board members are noted multiple times in the data output during the same year and give therefore incorrect results when the fraction of independent board members is calculated. To circumvent this problem, I downloaded the individual names of all the board members and excluded the duplicates before computing the respective ratios. Regarding CEO duality, information about the role of each individual board member must be extracted. Subsequently, CEO duality is identified when a combination of ‘chair’ and ‘CEO’ is found in the title.
With respect to the financial data, Information about firm fundamentals are downloaded from the Compustat Global: Fundamentals annual database (at the fiscal year end). Since BoardEX identification codes cannot be used for Compustat, I converted the BoardEX codes into ISIN codes. Because Compustat did not offer all the required data, I requested additional data from the Bloomberg database and from the Orbis Amadeus database. After matching all the obtained observations with the respective firm, the database was finalized and balanced by excluding all firms with lacking data points. This selection procedure has resulted in a final sample of 504 unique firms with 8 years of data.
3.1 Dependent variables
To investigate the hypothesis that the composition of the board affects the capital structure of a firm, it is essential to define and segregate the financing sources that are available to a firm. Following the pecking order theory as described by Myers & Majluf (1984), there are three primary sources of capital available: internal equity; external equity; and debt capital. subsequently, debt capital can be segregated into short-term debt and long-term debt as a mean to capture the firm’s capital structure choice in more detail. Following the work of Alti (2006) and Rashid (2015), internal equity is computed as the book value of retained earnings and external equity is computed as the book value of total equity minus the book value of retained earnings. As indicated, debt capital is segregated into short-term and long-term debt. Short-term debt is defined as the book value of current liabilities and long-Short-term debt as the book value of total liabilities minus the book value of current liabilities. In calculating the leverage ratios, the capital structure variables are scaled by the book value of total assets.
Existing literature on whether book values or market values of capital should be used in the computation of leverage show dispersed results. Thies & Klock (1992) and Fama & French (2002) argue that book ratios of leverage give a better reflection of the firm’s target debt ratio. Since market values of debt are not always readily available and market values of equity are subject to high volatility, it is presumed that using book values may better reflect the intentions of the management. Therefore, I will limit the present study to the use of book values of capital and will control for market values in the Robustness section.
3.2 Independent variables
This study measures the female presence on the board with the use of three variables. First, a board gender diversity variable will be included and will be measured by the Blau index6, one
of the most commonly used measures of categorial diversity. Following Blau (1977), board gender diversity is calculated as follows:
1 − ∑𝑘 𝑝𝑖2
𝑖=1 (1)
Where 𝑝𝑖 is the proportion of category 𝑖 in the group. Regarding board gender diversity, this implies that the Blau index for a board consisting out of six men and three women is calculated as one minus the sum of two thirds squared plus one third squared. Since gender will be categorised into two groups, namely men and women, the maximum value of the Blau index will be 0.50. For the sake of clarity, I transform the Blau index to a standardized form that ranges between zero and one. The standardized form of the Blau index is derived when the original formula (1) is multiplied by the equation 𝑘/(𝑘 − 1), where 𝑘 is the number of categories.
The second gender related measure is the percentage of female directors in the board. This variable is strongly correlated with the Blau index for gender diversity and will therefore not be tested simultaneously in order to prevent multicollinearity problems. Thirdly, I include a dichotomous variable that takes the value of 1 if the percentage of females in the board is at least 30% and takes the value of 0 otherwise. This follows the work of Joecks et al. (2012) who argue that board effectiveness is significantly higher when the presence of female directors on the board is at least 30%. In addition, the respective dichotomous variable will be referred to as the critical mass variable throughout this study.
Besides a variable for gender diversity, this study uses a second diversity measure which accounts for the nationality diversity in the board. This variable will be referred to as the nationality mix and is calculated in a similar way as the Blau index for gender diversity. The value of the variable will range between 0 and 1, with 0 indicating that all board members have the same nationality and 1 indicating that all board members have a different nationality.
In addition, a dichotomous variable is used to account for CEO duality and takes the value of 1 if the CEO of the board is also the chair of the board and takes the value of 0 otherwise. The variable board size is measured by the unit per person and is not subject to any transformation. Lastly, we include the fraction of independent directors as a variable and is expressed as the ratio between the number of independent directors in the board and the total board size.
3.3 Control variables
In order to increase the explanatory power of the model, I will include a set of control variables based on Rajan & Zingales (1995) and Getzman et al. (2014). The respective control variables
have proven to be reliable in explaining capital structure decisions made by firms and will consequently help to test the relative relationship between the independent variables and the dependent variables in this study. The approach in this study limits the nature of the control variables to firm-specific factors and ignores macro related determinants as, inter alia, market risk, inflation levels, and interest rates. Although existing literature documents that macroeconomic factors may be of relevance in explaining capital structure choices (Baum et al., 2015), most researchers ignore it in their models because of data limitations (e.g. Titman & Wessels, 1988; Getzman et al., 2014). I will outline each control variable that is considered in this study and will discuss the motivations and definitions subsequently. Although the exact coefficient sign between the control variables and the dependent variable is not of main interest in this paper, I will document the predictions and underlying intuition of the explanatory power of the variables based on the traditional capital structure theories where relevant. Since the testing procedure requires a normal distribution of the error terms, all control variables are being logarithmized.
(i) Asset tangibility: Prior research documents that the type of assets owned by a firm significantly influences the capital structure choice of a firm (Jensen & Meckling, 1976; Titman & Wessels, 1988). According to the trade-off theory, the collateralization of assets leads to better investor protection and to lower asymmetric information costs. Since the valuation of tangible assets is less volatile than intangible assets and the value of tangible assets can be better determined in times of financial distress, bankruptcy costs will be lower for firms with a larger proportion of tangible assets on their balance sheet. Within the framework of the trade-off theory, the decrease in agency costs resulting from an increase in asset tangibility should result in higher levels of leverage obtained by the firm. Prior research empirically observed this relationship (e.g. Rajan & Zingales, 1995; Alves & Ferreira, 2011) and as such, this present study incorporates asset tangibility as a control variable. I define asset tangibility as the ratio of fixed assets divided by the book value of total assets.
(ii) Profitability: According to the trade-off theory, profitable firms may opt for higher levels of debt in order to benefit from the resulting tax shields. In addition, profitable firms are less likely to get into bankruptcy and will therefore face lower (expected) costs of financial distress. In the absence of information asymmetry, these arguments lead to the prediction of a positive relationship between profitability and leverage. However, the pecking order theory propagates the contrary. As discussed in previous sections, firms will use retained earnings as the first
source of funding in order to avoid asymmetric information costs. Profitable firms generate higher levels of retained earnings and will therefore be less dependent on external financing sources. Within the information asymmetry framework, profitability is expected to be negatively related to leverage. Empirical evidence in existing literature tends to favour the predictions of the pecking order theory over the trade-off theory (e.g. Rajan & Zingales, 1995; Frank & Goyal, 2009). The variable profitability is therefore included in the model in order to extract additional explanatory power and is defined as the ratio of earnings before taxes and depreciation divided by the book value of total assets.
(iii) Growth opportunity: As an approximation for growth opportunities I use the market-to-book value ratio. Firms that have a high market valuation relative to the market-to-book value are presumed to hold a strong growth potential (Alves et al., 2015). However, the view about the implications of future growth on the capital structure of a firm differ strongly among researchers. Again, I can make a distinction between the trade-off theory and the pecking order theory. According to the former, growth is expected to increase the likelihood of bankruptcy and is related to higher financial distress costs. In addition, firms need to make investments in order to grow, which has a diminishing effect on net profits. Ergo, tax shield benefits will be less pronounced and total leverage should be reduced. The latter argues that since growth firms need to make substantial investments, external capital will be needed. Under the plausible assumption that internal capital will not suffice the capital that is demand, external funding needs to be raised. As explicitly proposed by the pecking order theory, debt should be preferred over equity. Consistent with this view, a positive relationship between growth opportunities and leverage is expected. Regarding the measurement of growth opportunities, several metrics can be used. However, as documented by Frank & Goyal (2009), the market-to-book value is the most reliable measure and will therefore be used in the present study.
(iv) Firm size: Firm size has been a perennial subject in capital structure literature and has been strongly related to financial decision-making (e.g. Titman & Wessels, 1988; Baker & Wurgler, 2002). According to the trade-off theory, large firms tend to face relatively lower costs in case of financial distress and are generally more diversified than smaller firms. As a result, larger firms issue more debt than smaller firms and are generally more levered. With respect to the pecking order theory I expect to find a different result. Larger firms tend to have lower information asymmetry problems since they are subject to strong reporting requirements, are
of lower information asymmetry costs, firms will have better access to equity capital markets and will therefore issue an increasing amount of equity over debt as firm size increases. Empirically, most studies report results that are in line with the trade-off argument where leverage is positively related to firm size (e.g. Frank & Goyal, 2009; Alves et al., 2015). In this study, firm size is measured by the total assets as reported by the firm. For a complete overview of all variables used in this study, please refer to Table A.I, presented in the Appendix.
3.5. Methodology
In order to capture the relationship between the composition of the board and the capital structure choice of a firm, I will set up a linear regression model that follows the work of Alves et al. (2015). I employ a cross-sectional time series model on the following baseline regression:
𝐶𝑎𝑝𝑖𝑡𝑎𝑙 𝑠𝑡𝑟𝑢𝑐𝑡𝑢𝑟𝑒𝑖,𝑡 = 𝛼0+ 𝛽1 (% 𝑜𝑓 𝑖𝑛𝑑𝑒𝑝𝑒𝑛𝑑𝑒𝑛𝑡 𝑑𝑖𝑟𝑒𝑐𝑡𝑜𝑟𝑠)𝑖,𝑡−1 (2)
+ 𝛽2 (𝑏𝑜𝑎𝑟𝑑 𝑠𝑖𝑧𝑒)𝑖,𝑡−1 + 𝛽3 (𝑐𝑟𝑖𝑡𝑖𝑐𝑎𝑙 𝑚𝑎𝑠𝑠 𝑑𝑢𝑚𝑚𝑦)𝑖,𝑡−1 + 𝛽4 (𝑛𝑎𝑡𝑖𝑜𝑛𝑎𝑙𝑖𝑡𝑦 𝑚𝑖𝑥)𝑖,𝑡−1
+ 𝛽5 (𝐶𝐸𝑂 𝑑𝑢𝑎𝑙𝑖𝑡𝑦 𝑑𝑢𝑚𝑚𝑦)𝑖,𝑡−1 + 𝛽6 (𝐵𝑙𝑎𝑢 𝐼𝑛𝑑𝑒𝑥 𝑔𝑒𝑛𝑑𝑒𝑟 𝑑𝑖𝑣𝑒𝑟𝑠𝑖𝑡𝑦)𝑖,𝑡−1
+ ∑ 𝛽𝐽 𝑗(𝑐𝑜𝑛𝑡𝑟𝑜𝑙 𝑣𝑎𝑟𝑖𝑎𝑏𝑙𝑒𝑠)𝑖,𝑡−1 + ε
Where 𝐶𝑎𝑝𝑖𝑡𝑎𝑙 𝑠𝑡𝑟𝑢𝑐𝑡𝑢𝑟𝑒 takes the form of one of the previously defined dependent variables. The index 𝑖 denotes an individual firm, 𝛼0 is a constant, t = 1, ..., T identifies the time dimension and where ε denotes a mean zero error, or residual term. An overview of the variables 𝛽1 to 𝛽6 as well as the control variables can be found in Table A.I, presented in the Appendix. Lagged variables are used in the equation to mitigate problems of endogeneity. Following Getzman et al. (2014) and Amaro de Matos & Mergulhão (2018), it is presumed that the decisions made by board members need time to get executed, resulting in a lagged relation between corporate decision-making and the capital structure. In particular, the use of lagged explanatory variables account for dynamic endogeneity problems which would arise if the current capital structure depends on past changes in the composition of the board (Schultz et al., 2010).
Regarding the testing procedure, I will estimate the baseline panel data model with industry-fixed effects and year-industry-fixed effects to circumvent potential problems of dependency in the residuals. In particular, the use of fixed-effects could eliminate unobserved heterogeneity if the effect of the unobserved characteristics is time-invariant (Petersen, 2009). The motivation to include industry-fixed effects instead of firm-fixed effects is twofold. First, existing empirical studies tend to favour industry-fixed effects over firm-fixed effects (Frank & Goyal, 2009; John
& Litov, 2010). Secondly, the inclusion of firm-fixed effects requires significant variation in the explanatory variable across time. However, given the nature of our independent variables (e.g. CEO gender, board size, CEO duality), it is expected to find only limited variation. Therefore, using firm-fixed effects on variables that are nearly time invariant can lead to imprecise estimates. To test the validity of the use of a fixed-effect model compared to a random-effect model, I test the correlation between the unobservable heterogeneity in the error term and the independent variables by using the Hausman test (1978). The Hausman test tests whether a fixed effects or random effects model is more appropriate. The null hypothesis is formulated as follows:
H0: The fixed effect is not correlated with other independent variables.
If H0 is rejected, fixed effects must be incorporated in the model, random effects otherwise. I will test for multicollinearity by estimating the correlation coefficients between all variables and will compute the variance inflation factors in case of uncertainty. Large correlation coefficients between any pair of independent variables suggest that the model includes variables that are correlated to both the dependent variable and to each other and should therefore be excluded (Joshi, 2012). Moreover, the baseline model (2) will rely on robust standard errors clustered at firm-level. This follows the approach of Getzman et al. (2014) and Faccio et al. (2016) and accounts for possible autocorrelation and/ or heteroskedasticity in the error terms, a common problem in panel data regressions. In particular, the lack of variance over time in the corporate governance related variables may lead to strong autocorrelation problems. Therefore, estimating the model with robust standard errors to correct for dependence in the error terms circumvents the problems of autocorrelation and heteroskedasticity in the error terms (Peterson, 2009).
In the baseline model (2), the presence of female directors is indirectly included by the Blau index for diversity and the dichotomous variable critical mass. However, in order to test for the direct relationship between the percentage of female directors in the board and the capital structure choice of a firm, I will augment the baseline regression as follows:
𝐶𝑎𝑝𝑖𝑡𝑎𝑙 𝑠𝑡𝑟𝑢𝑐𝑡𝑢𝑟𝑒𝑖,𝑡 = 𝛼0+ 𝛽1 (% 𝑜𝑓 𝑖𝑛𝑑𝑒𝑝𝑒𝑛𝑑𝑒𝑛𝑡 𝑑𝑖𝑟𝑒𝑐𝑡𝑜𝑟𝑠)𝑖,𝑡−1 (3)
+ 𝛽2 (𝑏𝑜𝑎𝑟𝑑 𝑠𝑖𝑧𝑒)𝑖,𝑡−1 + 𝛽3 (% 𝑜𝑓 𝑓𝑒𝑚𝑎𝑙𝑒 𝑑𝑖𝑟𝑒𝑐𝑡𝑜𝑟𝑠)𝑖,𝑡−1 + 𝛽4 (𝑛𝑎𝑡𝑖𝑜𝑛𝑎𝑙𝑖𝑡𝑦 𝑚𝑖𝑥)𝑖,𝑡−1
As shown, model (3) and model (2) are to the utmost extent similar, except for the fact that the variables Blau diversity index and critical mass are excluded and replaced by the variable percentage of female directors. Adding the latter variable in the model while keeping the former two variables would lead to strong multicollinearity problems. Therefore, this study will repeatedly report the results of model (2) and model (3) separately.
4. Results
This section displays the estimation results for the cross-sectional time series regression and consists out of two parts. First, I will document the descriptive statistics and the correlation coefficients of the regression variables. Second, the results of the panel data analysis will be presented in order to determine the direct relation between the board composition and the capital structure as predicted by the pecking order theory.
4.1 Descriptive statistics
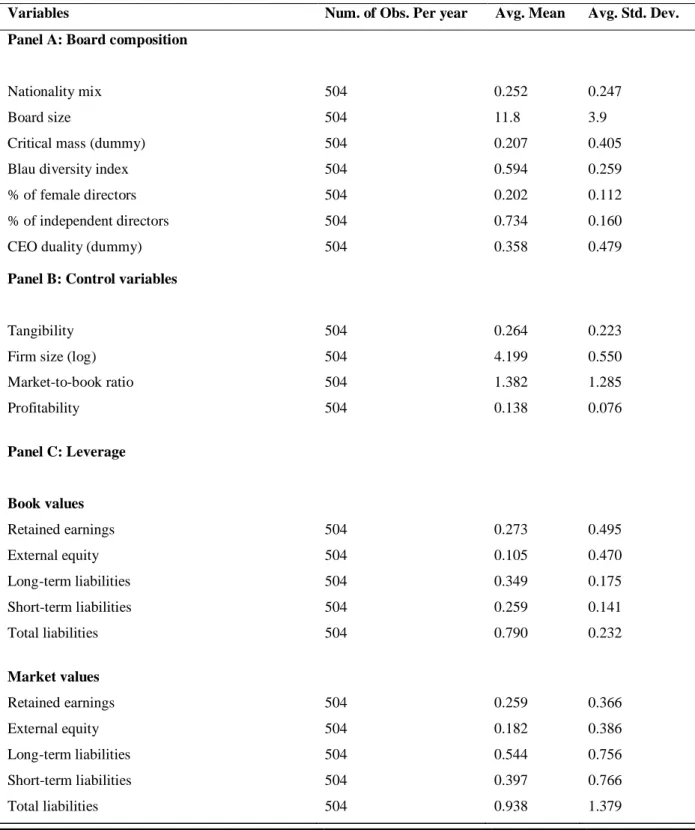
Table I reports the descriptive statistics for the variables that are used in the cross-sectional time series regression. It shows a balanced panel dataset with both financial and board composition data for 504 unique firms gathered over the period from 2010 to 2017. Regarding panel A, all board composition variables have a maximum range between zero and one except for board size. On average, boards have a gender diversity level, as measured by the standardized Blau index7, of 0.594. To interpret this number correctly, it is important to recognize that when the
presence of female directors in the boardroom is 50%, the Blau index returns a score of one. The percentage of female directors in the board is included in Table I and provides additional insight on the average gender diversity in the board. As documented, the mean percentage of women in the board is 20.2 percent. Regarding nationality mix, Table I documents a value of 0.252. Again, this number must be interpreted with care since it is not a percentage value but a diversity measure that returns the value of one when the board is completely diversified. However, due to data limitations I am not able to give further descriptive information about, inter alia, the actual number of different nationalities within the boards.
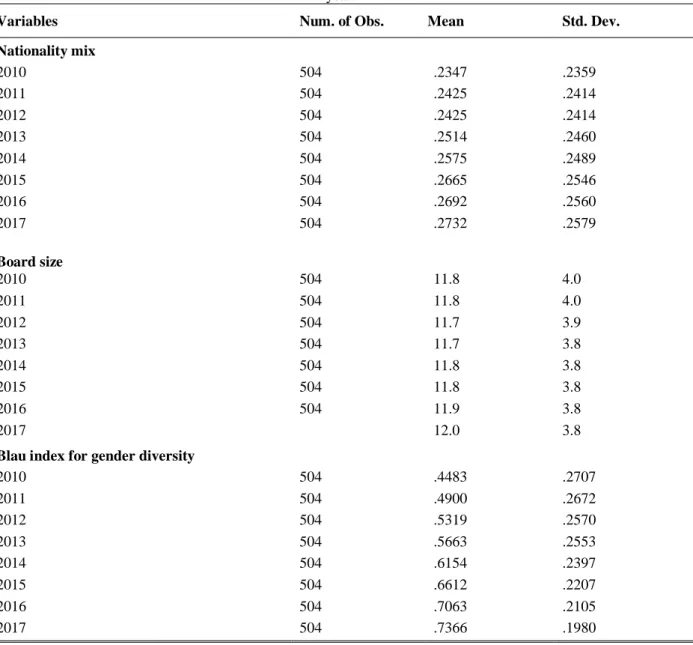
To capture potential trends in the composition of the boards, I decomposed the descriptive statistics by year. The results are presented in Table A.II in the Appendix and show that certain board characteristics have changed significantly over time. Most notable is the linear increase in female representation over the period from 2010 to 2017. The percentage of female directors has increased from a mean value of 0.142 (14.2%) in 2010 to 0.266 (26.6%) in 2017. Clearly, the Blau Index for gender diversity has followed the same trend. The critical mass dummy, which equals 1 if more than 30% of the board members are female, increased remarkably from 0.083 (8.3%) in 2010 to 0.386 (38.6%) in 2017. The variables board independence, CEO duality, board size, and nationality mix stayed nearly unchanged over the years.
Presented in the Appendix, Table A.III shows the differences in the board composition between the American firms (reflected by the S&P 500) and the European firms (reflected by the Stoxx Euro 600). First, it becomes clear that CEO duality is more present within American firms than within European firms, with levels of 0.434 (43.4%) and 0.276 (27.6%) respectively. One explanation is that American corporate boards are characterized by having a one-tier structure while two-tier board structures are more common in Europe (Solomon, 2013). Since two-tier boards have a strict separation between the chairman and the CEO, it is cogent to find lower levels of CEO duality for European firms than for American firms. Second, the degree of nationality diversity is smaller for American firms (14.1%) than for European (37.1%) firms. However, this result is a logical consequence of the geographic dissimilarities between America and Europe.
Table I: Descriptive statistics
This table presents the descriptive statistics for the board and firm-financial characteristics of 504 unique firms. All firms are listed and consistently present in either the S&P 500 or in the Stoxx Europe 600 during the period of 2010 to 2017. The variables critical mass and CEO duality are dichotomous. For an extensive description of the variables used in this study, please refer to Table A.I in the Appendix.
Variables Num. of Obs. Per year Avg. Mean Avg. Std. Dev.
Panel A: Board composition
Nationality mix 504 0.252 0.247
Board size 504 11.8 3.9
Critical mass (dummy) 504 0.207 0.405
Blau diversity index 504 0.594 0.259
% of female directors 504 0.202 0.112
% of independent directors 504 0.734 0.160
CEO duality (dummy) 504 0.358 0.479
Panel B: Control variables
Tangibility 504 0.264 0.223
Firm size (log) 504 4.199 0.550
Market-to-book ratio 504 1.382 1.285 Profitability 504 0.138 0.076 Panel C: Leverage Book values Retained earnings 504 0.273 0.495 External equity 504 0.105 0.470 Long-term liabilities 504 0.349 0.175 Short-term liabilities 504 0.259 0.141 Total liabilities 504 0.790 0.232 Market values Retained earnings 504 0.259 0.366 External equity 504 0.182 0.386 Long-term liabilities 504 0.544 0.756 Short-term liabilities 504 0.397 0.766 Total liabilities 504 0.938 1.379
Although the percentage of female board members and the size of the board do not show any significant differences between the two subsamples, the critical mass dummy indicates that the presence of female board members is way more diluted among firms listed in the S&P 500 than in the Stoxx Euro 600, with mean values of 0.124 (12.4%) and 0.297 (29.7%) respectively. As prior literature stresses the importance of having a substantial number of female directors in the board for decision effectiveness and transparency (e.g. Joecks et al., 2012), the observed relation between the presence of female board members and capital structure may differ between the subsamples.
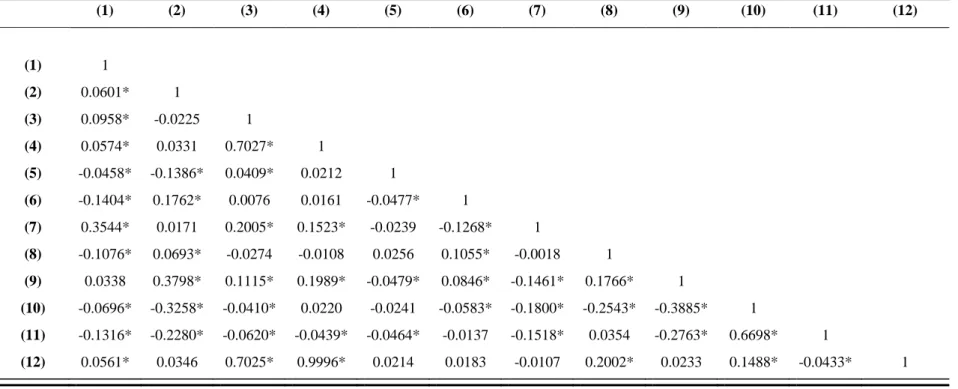
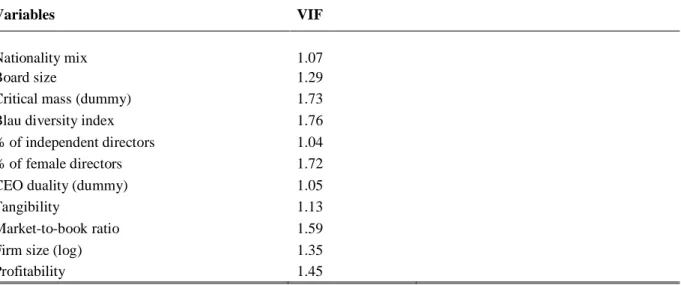
Table II provides the correlation coefficients between all variables. As reported in Table II, many explanatory variables are significantly correlated with each other at the 1% significance level. However, the magnitudes of these correlations are predominantly small, except for the variables that are related to gender such as critical mass, percentage of female directors and the Blau diversity index. To test for potential multicollinearity in the model, the variance inflation factors (VIFs) are computed and reported in Table A.IV in the Appendix. As shown, the VIFs are below the commonly used cut-off value of 2 and do not indicate the presence of multicollinearity (Getzman et al., 2014).
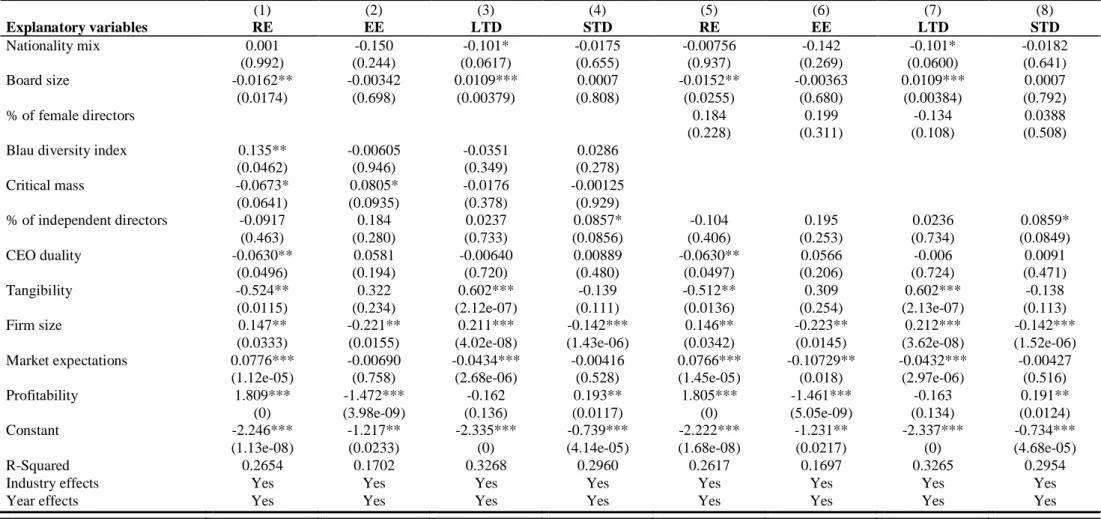
4.2 Research results
The tables in this section will persistently display the results of the baseline model (2) and the augmented baseline model (3), regressed on various dependent variables. Hausman tests are performed on all regressions in order to test whether fixed- or random-effects are more appropriate in the model. To interpret the results of the estimation coefficients of the board composition variables, it must be recognized that we are dealing with a log-level regression model and that all dependent variables are scaled to the book value of total assets. Special care has to be taken for the dichotomous variables since the interpretation to the dependent variable is asymmetric and depends on whether the dummy equals to the value of one or zero. In this study I will only refer to the situation in which the dummy turns from zero to one and not vice versa. Finally, as previously mentioned, the explanatory variables in the model are lagged by one year and the observed effects must therefore be interpreted accordingly. This structure and procedure hold throughout this paper.
Table II: Correlation Matrix
This table presents the (Pearson) correlation matrix of the data sample which consists out of 504 unique firms with observations over the period from 2010 to 2017. The numerical indicators (1) to (12) are defined as: (1) nationality mix, (2) board size, (3) critical mass, (4) Blau index, (5) % of independent directors, (6) CEO duality, (7) leverage, (8) tangibility, (9) firm size, (10) market-to-book ratio, (11) profitability, (12) % of female directors. The variable leverage (7) is defined as the ratio of total liabilities and book value of capital. Subscript * corresponds to statistical significance at the 0.01 significance level.
(1) (2) (3) (4) (5) (6) (7) (8) (9) (10) (11) (12) (1) 1 (2) 0.0601* 1 (3) 0.0958* -0.0225 1 (4) 0.0574* 0.0331 0.7027* 1 (5) -0.0458* -0.1386* 0.0409* 0.0212 1 (6) -0.1404* 0.1762* 0.0076 0.0161 -0.0477* 1 (7) 0.3544* 0.0171 0.2005* 0.1523* -0.0239 -0.1268* 1 (8) -0.1076* 0.0693* -0.0274 -0.0108 0.0256 0.1055* -0.0018 1 (9) 0.0338 0.3798* 0.1115* 0.1989* -0.0479* 0.0846* -0.1461* 0.1766* 1 (10) -0.0696* -0.3258* -0.0410* 0.0220 -0.0241 -0.0583* -0.1800* -0.2543* -0.3885* 1 (11) -0.1316* -0.2280* -0.0620* -0.0439* -0.0464* -0.0137 -0.1518* 0.0354 -0.2763* 0.6698* 1 (12) 0.0561* 0.0346 0.7025* 0.9996* 0.0214 0.0183 -0.0107 0.2002* 0.0233 0.1488* -0.0433* 1