NEWS OUT OF THE OLD: THE EVOLVING
TECHNOLOGICAL INCOHERENCE OF THE
WORLD’S LARGEST COMPANIES
S
S
a
a
n
n
d
d
r
r
o
o
M
M
e
e
n
n
d
d
o
o
n
n
ç
ç
a
a
July 2003
WP nº 2003/34
DOCUMENTO DE TRABALHO WORKING PAPERN
N
E
E
W
W
S
S
O
O
U
U
T
T
O
O
F
F
T
T
H
H
E
E
O
O
L
L
D
D
:
:
T
T
H
H
E
E
E
E
V
V
O
O
L
L
V
V
I
I
N
N
G
G
T
T
E
E
C
C
H
H
N
N
O
O
L
L
O
O
G
G
I
I
C
C
A
A
L
L
I
I
N
N
C
C
O
O
H
H
E
E
R
R
E
E
N
N
C
C
E
E
O
O
F
F
T
T
H
H
E
E
W
W
O
O
R
R
L
L
D
D
’
’
S
S
L
L
A
A
R
R
G
G
E
E
S
S
T
T
C
C
O
O
M
M
P
P
A
A
N
N
I
I
E
E
S
S
**Sandro Mendonça
1 WP no 2003/34 July2003I
NDEX
1.INTRODUCTION 12.THE CORPORATE TECHNOLOGY MIX 2
The case of multi-technology firms 2
The dynamics of technological diversification 4
3.DATA AND METHODOLOGY 6
The database 6
Interpreting patenting activity 8
4.EMPIRICAL EXPLORATION 9
Overview of patenting trends 9
Patenting outside ‘core technical fields’ 10
Changes in the structure of technological diversification 11
ICT, materials and drugs & bioengineering: the contribution of non-specialist sectors 12 Comparing growth and growth differentials between technology groups 15 5.THE CHANGING COMPOSITION OF TECHNOLOGICAL DIVERSIFICATION 16
6.CONCLUSION 19
NOTES 21
REFERENCES 22
APPENDIX 1-The SPRU Patent Classes 25 APPENDIX 2-Correspondence between industry and ‘core technical fields’ 26
*
Forthcoming in J.F. Christensen and P. Maskell (eds), The Industrial Dynamics of the New Digital Economy, Cheltenham, UK: Edward Elgar, pp. 121-150.
1.INTRODUCTION
Large established companies from a variety of industrial sectors typically show a highly diversified knowledge base. A number of authors have found that this phenomenon can be measured using several technological indicators such as educational data on engineering backgrounds and patent applications (Granstrand and Sjölander, 1990; Patel and Pavitt 1994). The interesting feature of this trend is that companies invest to acquire competence in areas that are unrelated to their production specialisation in the market. However, this paradoxical empirical pattern is more easily observed than explained. Recently, some explanations have been put forward, one of which is that large innovative firms need to internalise many different branches of engineering knowledge in order to cope with uneven rates of development in the components they rely on (Brusoni et al. 2001).
This work draws on the insights of the multi-technology corporation literature (e.g. Granstrand et al. 1997) and attempts to complement previous findings with a focus on the dynamic features of technological diversification. The chapter has two main goals: to draw a map of the rate and direction of technological diversification and, on this basis, to nourish a tentative discussion of the forces behind the evolving profile of multi-technology firms. In order to do this we use patent counts and classifications based on the SPRU database for nearly 500 of the world’s largest innovating companies from 1980 to 1996, as ranked by sales revenues.
Large companies exhibit significant command of technologies unrelated to the actual making of their principal product lines, i.e., they reveal a degree of technological diversity or ‘incoherence’ as it is labelled throughout this chapter. Having underlined this contemporary stylised fact, we shall be concerned with the existence of broad changes in the rate and direction of technological diversification across and within industries. We find evidence of an emergent reorganization in corporate technological portfolios. Although the extent to which companies patent outside their core technical fields has remained stable, or even decreased slightly, the composition of the in-house technological mix appears to have changed considerably over a period of less than two decades.
The technologies attracting the diversification movement in corporate capabilities, as revealed by patents, have increasingly become information & communication technologies (ICT), new materials and drugs & bioengineering. This is not entirely surprising since these technologies are commonly regarded as ‘generic technologies’ or ‘general purpose-technologies’. However, this tendency coincides with a remarkable regularity: for these three technology groups, the growth in patents was consistently higher for non-specialist sectors than for specialist sectors.
Taken together, these findings can be interpreted as evidence that ‘new economy’ technology fields have gained weight against ‘older’ technologies, like the chemicals and mechanical fields, within the large established companies of the ‘old economy’. The observed patent regularities raise other issues. In particular, they could provide a useful perspective to an ongoing debate on whether the rise of new technologies has been associated with the substitution of or, on the contrary, complementarity with, older technologies. While there is considerable inter-industry diversity, the pattern of growth in ICT,
materials and drugs & bioengineering patent groups seems to suggest that there is room for both stories.
What is the meaning of this set of changes? On a macroscopic perspective we suggest these developments can be understood as an expression of an ongoing technological revolution in the neo-Schumpeterian sense of Freeman and Louçã (2001). As this paper has a more detailed perspective, we concentrate on the discussion of the strategic rationale behind the dynamics of diversification in the corporate knowledge base. At this stage we offer two intertwined hypotheses that fit with the observations.
The chapter begins by addressing the empirical and conceptual contributions of the literature on technological diversification. Section 3 describes the data set and considers the methodological conditions necessary for a prudent use of patents as indicators of technological capabilities. Section 4 then reports on the analysis of our sample, which constitutes the core of the chapter. Section 5 critically assesses the empirical results, discusses implications for technology management and suggests some unsettled questions for innovation studies. The last section, Section 6, forms the conclusion.
2.THE CORPORATE TECHNOLOGY MIX
The case of multi-technology firms
The emergence of the large innovative firm, as a fundamental institution of capitalism, is a phenomenon of the 1870s and onwards. Having matured by the 1920s, big business organizations continued to develop throughout the twentieth century and some ‘early movers’ still continue to play an important role in global markets today, e.g., Ford, Bayer, Shell, etc (Chandler and Daems 1980). An enduring characteristic of these modern industrial corporations is the strategy of multi-product lines. This stable corporate facet has also been associated with a ‘non-random (coherent) distribution of product portfolios inside firms, and the relative stability in the composition of firm’s product portfolios over the long run’ (Dosi et al. 1992: 185).
Another remarkable characteristic of large companies is the wide variety of technologies that is nurtured within them. Evidence indicates that this was not always the case. As the twentieth century went by, the corporate knowledge base became more complex, so that contemporary giants operate in a broader range of technological areas (Fai and Cantwell 1999). This seems to suggest that the multi-technology corporation can be seen as a new organisational subspecies of late twentieth century capitalism. Today a company like Ford contributes to the advancement of semiconductors, chemicals and materials, but does not sell computers or raw materials for other companies (Granstrand et al. 1997). Likewise, tire manufacturers are not the leading sources of polymer science, but they clearly command cutting-edge expertise in the corresponding patent classes (Acha and Brusoni 2002). We
are, therefore, led to think in terms of profiles of competencies shared on average by given industries, i.e. the varying levels of commitment and revealed advantage in a range of technological fields (Patel and Pavitt 1997).
A crucial lesson that emerges from such an insight is that the notion of the multi-technology corporation must be set apart from that of the multi-product corporation. To use the words of Pavitt (1998a: xiv), ‘(t)he main analytical and policy conclusion is that we should not confuse technologies with products.’ Empirical research indeed allows us to say that contemporary big business institutions exhibit a much broader portfolio of technologies or competencies than of products, i.e., they know more than they do (Brusoni et al. 2001). This suggests the existence of differences between the processes of productive and cognitive division of labour (Pavitt 1998b).
The product and technology dimensions are distinct, but nevertheless related. A paradigmatic expression of this connection is product evolution towards technological complexity. This has been the case of the iconic artefact of the 1990s, the mobile phone. The number of sub-technologies involved in one case of Ericsson handsets rose from 17 to 29 narrow patent classes from the early to the late 1980s (Granstrand and Sjölander 1992). Diversification was used in Swedish, Japanese and US companies to improve the degree of sophistication of many types of products in very specific classes (Granstrand 1999). Thus, the number of new combinations made possible by the technological diversification trend has coincided and been reinforced by the tendency towards more complex products and systems.
Another aspect emphasized by Gambardella and Torrisi (1998) is that business diversification might also impair sales or profit performance due to exogenous factors, namely the difficulties of putting in place the necessary downstream assets and capabilities that are required for commercialisation. This is the case with the electronics industry, where firms are narrowing the range of products while extending the range of ICTs in their knowledge base.
It should also be kept in mind that multi-technology profiles are not exclusive to the so-called knowledge economy or ‘high-tech’ sectors, those industries with a high R&D to sales ratio. For instance, there is evidence that industries like food processing have been developing new technological fields together with the extension of their more traditional technologies.
This industry has been dominated through most of its historical development in the industrial era by two main technological fields: machinery and chemicals (the latter often working through machinery, e.g., in refrigeration). Over the past two decades, these fields have been added in significant ways by newer technological fields, including advanced instrumentation (lasers, etc), electronics, biotechnology, pharmaceuticals, advanced materials (especially in packaging), and so on. (von Tunzelmann 1998: 232)
Here we focus not on why firms diversify their product offerings, but on how their technology portfolios evolved during the 1980s and 1990s. We provocatively borrow and adapt the phrase ‘corporate coherence’ introduced by Dosi et al. (1992) to emphasize the often enigmatic amplitude and composition of the corporate knowledge base. One starting point is that even if the composition of their product portfolios is ‘coherent’, as argued by Dosi et al. (1992), that does not mean that companies diversify into ‘related’ technological areas. Instead, different levels of knowledge are developed and maintained across different areas of interest not strictly related to the productive operations of firms. It is in this sense that we are interested in ‘technological incoherence’. We propose to trace its evolution across industries as a possible way to learn about its underlying micro-motives and strategic rationale.
The way in which technologies change their relative importance in companies’ knowledge portfolios is an aspect that still gives us considerable room to expand our understanding of the multi-technology phenomena. The data constraint is traditionally severe in this regard, both because it is a recent phenomenon for which data is scarce and because it is difficult to make inter-temporal comparisons using technology indicators. The aim of this paper is precisely to contribute to the body of empirical papers analysing change in corporate technological diversification or incoherence.
It is also worth emphasising the boundaries between what we are and are not researching. Indeed, by referring to the notion of coherence in the context of technological competencies, we are adopting a substantive meaning that is similar to the approach advocated by Foss and Christensen’s (2001) use of the term. In an applied paper, Christensen (2000) refers to coherence as an integrated process of generating and exploiting complementarities among innovative assets and learning activities. Also partially building on the resource-based approach, Teece and Pisano (1994) use the term ‘dynamic capabilities’ to refer to the strategic integration and adaptation of skills in a shifting environment, a key managerial ability for sustaining competitive advantage. Like them, we are concerned with the dynamic properties of technology economics and management. However, it should be made clear that we are not discussing the issue of technological coherence at the same ontological level, i.e. we do not provide an analysis of the dynamics of firm assets for technological innovation in the context of resource-based or competence perspectives. Given the limited scope of this paper, and because the empirical material used does not allow us to carry out such in-depth inquiry, the notion of capabilities is more instrumentally defined, as explained in the methodology section.
Theoretical and empirical research has frequently made the case that path-dependence should be expected in the accumulation of competencies. Either due to the fields of knowledge traditionally involved in manufacturing or due to the increasing complexity in coping with technological and organisational variables, this view argues that localised learning strongly constrains the directions of diversification (Patel and Pavitt 1997; von Tunzelmann 1998). In a nutshell, the persistence of stable and industry-specific technological profiles is to be explained by the accumulation of capabilities in the conceptual framework of learning-by-doing and investments in R&D and human capital. The
corollary is the predominance of creative accumulation over creative destruction, i.e. new capabilities link with older ones in a complementary and enhancing fashion (Granstrand 1998; Pavitt 1998b). Recent research conspires, nevertheless, to complicate this picture of smooth and incremental change. Utilising patent data from the Reading University database, Fai and von Tunzelmann (2001a) confirm that industry-specific competencies have endured throughout the last century and that differences in overall technological profiles remain quite distinct. Surprisingly enough, they find much stronger evidence of convergence in the direction of growing technologies across industries. In a related paper (Fai and von Tunzelmann 2001b), the same authors argued that the range of corporate technological diversification changes over time and that this is due to the advent of new opportunities created on the basis of new emerging technologies. Coupled with the convergence in corporate technological diversification, Cantwell and his colleagues (Cantwell and Santangelo 1999; Cantwell and Noonan 2001) report a rising degree of inter-relatedness and co-patenting between formerly disconnected fields of technology. The above authors offer the common view that opportunities emerging outside core technological capabilities mean that large firms are obliged to move outside their typical domains of expertise, i.e., those more closely related to what they manufacture.
Interpreted in the context of the diffusion of new technological paradigms these patterns suggest that the multi-technology phenomenon might have a broader explanation. In another paper, in which this author has specifically examined the tendency among large companies from all industries to patent in ICT, it was found that ICT patenting in non-ICT industries clearly intensified after 1980 as compared to other technologies (Mendonça 2002). As in Fai and von Tunzelmann’s (2001a, 2001b) empirical papers, this was taken as an indication that, in spite of the stability of diversified patent portfolios, something new is happening in the corporation’s knowledge base. Although technological diversification is uneven across industries, the changes in corporate capabilities show signs of convergence. Namely, in spite of the stability and industry-specificity of technological profiles, aggregate corporate behaviour reveals a broad and increasing attraction towards ICT, biotechnology and new materials in the last two decades of the last century. An implication is that technology diversification can be related to the concept of long waves of techno-economic change and to studies characterising ICT as a core input or a general-purpose technology (Freeman and Louçã 2001).
Paraphrasing a famous phrase of George Orwell: some technologies are more equal than others. Technologies are not alike in terms of opportunities for future development and potential for interrelation with existing technologies. Long and medium-term changes in patenting can be related to changes in the importance of specific technologies for complex physical products and, therefore, for coping with the challenges of competition in increasingly sophisticated markets. We will explore this hypothesis in the context of the results of our empirical section.
In order to pursue this line of research, this paper will give an account of the technology families that drove technological diversification in the period under analysis. We will contrast the changes in the most dynamic technologies with the changes in the technologies that lost share in the patent portfolio of multi-technology companies in order to assess the destructive and/or complementary character of these changes. Differences between industrial sectors will be highlighted. From the examination of the
sectoral and technological shifts we will gather material for discussing the rationale(s) behind the underlying micro behaviour. In the next section, we present the methodology for our enquiry.
3.DATA AND METHODOLOGY
The database
Technological and sectoral evolution are discussed utilising data extracted from the SPRU database. For the years 1980-85, 1985-90, and 1991-96 we have snapshots of accumulated patent counts broken down by 14 industries and 34 patent classes. This database contains more than half a million patents granted in the US for 463 of the largest U.S., European and Japanese companies distributed according to principal product group. Patents come already assigned to industries; therefore, we cannot perform intra-industry analysis because the patent database ignores the profiles of individual companies. All patents are assigned one of 34 individual technological fields as well as one industry, that of the applicant company, following information provided by the US patent office. This database represents a huge effort of consolidation of 4500 subsidiaries and divisions carried out in SPRU since the mid-1980s. Different assignee names, kept or bought by the 463 firms up to 1992, were identified using Who Owns Whom and attributed to their parent company.2
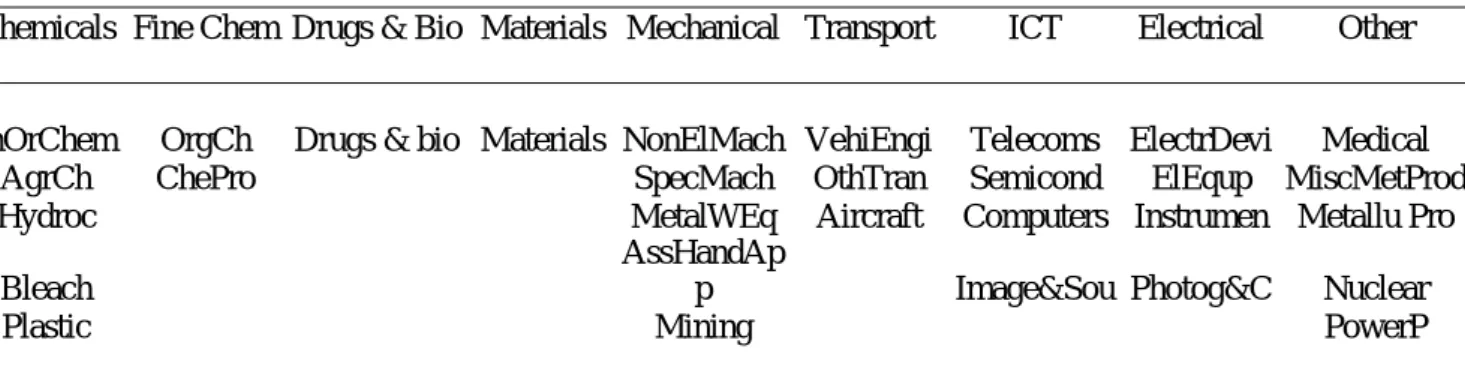
In our work with the SPRU database characteristics we had to take aboard its original technological classes. Notwithstanding this limitation, we subjected the original SPRU patent classes to our own re-categorisation. Three reasons lie behind this reorganisation. The first is synthesis, i.e., simplification is important because patterns emerging from 34 individual classes times 14 sectors during 3 time periods are difficult to bear in mind or even to visualise at the same time. Second, new information on unexpected patterns can be gained with a new aggregation of patent categories. Finally, the reliability of conclusions is substantially upgraded by allowing for sensitivity testing. Thus, the reorganisation of the patent classification allows us to gain extra operational leverage in data manipulation and to achieve a more secure and profound scrutiny of patterns. Table 5.1 presents the new technological groups while Appendix 1 contains the complete descriptors of individual patent classes.
Table 5.1 - Technological Groups
Chemicals Fine Chem Drugs & Bio Materials Mechanical Transport ICT Electrical Other
InOrChem OrgCh Drugs & bio Materials NonElMach VehiEngi Telecoms ElectrDevi Medical AgrCh ChePro SpecMach OthTran Semicond ElEqup MiscMetProd Hydroc MetalWEq Aircraft Computers Instrumen Metallu Pro
Bleach
AssHandAp
p Image&Sou Photog&C Nuclear
ChemApp Food&T
TextWoodetc
Other(weap.e tc) Source: SPRU’s technological classes re-arranged by the author.
The new technological categories are constructed to represent families of associated technologies. Since all classifications are imperfect conventions it is important to look at them critically. The U.S. patent system is a classification in which patents are clustered together keeping in mind function, effect and end product, although the same patent can have several industrial uses and be related to a wider technological area. However, there are grounds to believe, as do Narin and Olivastro (1988), that it is possible to construct reasonable (re-)classifications according to criteria of technological similarity. This will only be an approximation but, in our case, the task is made easier as we build on the efforts that lead to the current SPRU database. For instance, under the ICT label we regroup technological areas that have been strongly influenced by the advent of the microchip and incorporate a strong digital element. The electrical group, on the other hand, is more difficult to put together; therefore, it is not as reliable as the former group in terms of internal consistence.
Finally, we follow Patel’s (1999) table of correspondence between industries, defined by their principal product group, and ‘core technical fields’ (see Appendix 2). Although such a correspondence is never simple and straightforward, this information is precious. By measuring the proportion of patents granted outside the industries’ traditional areas of technological expertise it becomes possible to assess the extent of technological diversity and changes in diversification in each industry and for the aggregate of all industries.
Interpreting patenting activity
The empirical section of this work attempts to capture technological capabilities through patent data. Many studies refer to capabilities or competencies as technological knowledge that is created and reproduced by organizations and among them affecting the ability of firms to innovate in certain directions rather than others (Gambardella and Malerba 1999). However, patents are only a very imperfect and indirect measure of industrially applicable knowledge. Many authors have examined the problems of using patents as an indicator of technological activity.3 To minimize these problems we do not treat patents as proxies for inventive output resulting from R&D investment, and thus avoid a notion of ‘knowledge production function’ akin to the much-abused ‘linear model of innovation’. Three potential limitations must be noted in connection with this research.
Firstly, patents account for codified knowledge, whereas a main reason why firms and industries are different is due to firm-specific tacit knowledge emerging because different firms are exposed to different circumstances and learn different things differently (Nelson 1991). A second limitation refers to the argument that patents are not a linear indicator of innovative efforts. There are different
inter-firm propensities to patent among different companies within a given national patenting system, as well as differences in the patenting patterns across technologies, across industries, across countries and over time (Patel and Pavitt 1995). Thirdly, there are epistemological difficulties in the issue of measurement of competencies; ultimately, we have access only to the behaviour of technology indicators, not to knowledge structures or the corporate mechanisms that remain underneath and constitute the real unit of analysis (Lawson 1997). Still, in spite of all these limitations, patents constitute a precious window (however narrow) into a deeper ontological level, namely, the potential to generate improved technical knowledge.
On the positive side, many authors agree that the U.S. patenting system is a particularly rich source of information, identifying it as a basis for international and, to a degree, inter-temporal comparisons (Narin and Olivastro 1988). At present, two other observations strengthen the validity of patents to assess the technological evolution of big business institutions. Firstly, about 80% of all patents were granted to business firms in the last quarter of the twentieth century; of these, about half were granted to the world’s largest innovative firms (Patel and Pavitt 1995). Secondly, a recent survey questionnaire (Cohen, Nelson and Walsh 2000: 13) sent to 1478 R&D labs in the U.S. manufacturing sector suggests that patents have become more important as a protection strategy for product innovations in a growing number of industries since the early 1980s.
4.EMPIRICAL EXPLORATION
Overview of patenting trends
The empirical work of this paper assesses the magnitude of change in technological profiles among the world’s largest innovative firms. Let us first draw a picture of the main developments taking place in our time period.
There is a substantial increase in the absolute number of patents granted to our population of large firms over time. Companies received a total of 274,904 patents in the period 1991-96, which corresponds to a variation of 81% when compared with the total patent counts in 1980-85: that is, almost twice as many patents. Individual patent classes behaved quite differently. Among those classes that experienced the highest increase in patents, ICT classes figure prominently. For instance, ‘semiconductors’ and ‘computers’ were the top two classes in terms of overall growth, with more than three times as many patents granted in the early 1990s than in the early 1980s. On the other extreme, two classes decreased in absolute terms. The ‘inorganic chemistry’ and the ‘hydrocarbons’ classes had less patents in 1991-95 than in 1980-85.
Accounting for growth in individual classes can be affected by the existence of small numbers in the initial period. Regrouping classes into groups of technology can supply a sensitivity test while giving us a more robust and manageable picture of the trends. Again, ICT grows more vigorously, now
clearly followed by materials technology and drugs & bioengineering, the other two groups growing beyond the average of total patenting.
This intensity of patenting can also be captured by assessing the weight of these technologies in the total stock of patents granted. The ICT technology group constituted 29.9% of all patents in 1991-96, whereas in 1980-85 it was 18.8%. Materials grew from 3.4% to 3.8% and drugs & bioengineering from 5.2% to 5.5% of total patents. These were the only technological groups to expand their relative sizes. The rest diminished their share of the volume of patents, namely fine chemicals, mechanical technology and chemicals.
If the absolute increase in patenting can be considered as evidence of technological opportunity (Patel and Pavitt 1994) then it is clear that this is not evenly distributed across fields. In this heterogeneous landscape, ICT, new materials and drugs & bioengineering reflect the greatest revealed technological opportunities in our time span.
Patenting outside ‘core technical fields’
However, what one would not necessarily expect is that the aggregate growth pattern in patents generated by technological diversification replicates the pattern described above. In other words, not only are ICT, new materials and drugs & bioengineering the most dynamic technological categories, they are also the areas where companies patent more when they patent outside their ‘core technical fields’. Figure 5.1 takes all patents that companies generate outside their traditional technological areas and sorts those technological groups that recorded the highest growth between the first and last sub-periods of our time frame.
This pattern of growth occurred while the extent of technological diversification for all industries as a whole was essentially stable, or even decreasing: the proportion of patents obtained from outside core technological fields for the periods was 51.5%, 50.7% and 48.3% for 1980-85, 1986-90 and 1991-96 respectively. About half of the patents generated by the companies in the database come from non-specialist sectors. This confirms the multi-technological nature of the companies in our sample. Moreover, taken together with the immense attractive power revealed by the three top technologies observed above, it suggests the occurrence of a considerable change in the structure of technological diversification.
Figure 5.1 Growth in the number of patents obtained by firms outside their core activities from1980-1985 to 1991-1996
0% 50% 100% 150% 200% 250% 300% 350% ICT Mater ials Dru gs & Bio Othe r Ele ctric al Trans por t Fine Che m Mecha nical Chemic als
Source: Elaborations on the SPRU database
Note: Horizontal line refers to average growth; Technologies are sorted by growth
Changes in the structure of technological diversification
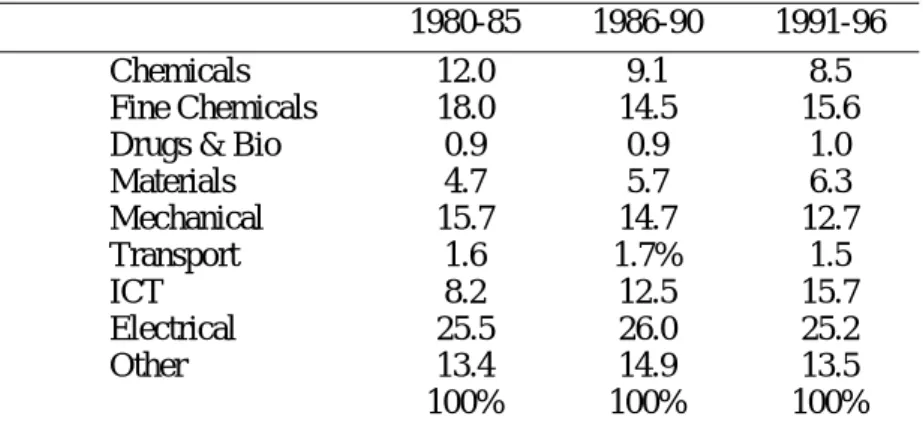
In order to assess the evolution of technological diversification we take a look at the distribution of patents granted outside ‘core technical fields’ for all industries taken together and compare it across sub-periods (Table 5.2).
Note that ICT’s share increases appreciably, materials grow moderately and drugs & bio maintain their weight over time as overall patenting grows substantially for the world’s largest companies. The ICT component of technological diversification increased 7.5 percentage points from 1980-85 up to 1991-96. Materials technology’s share went up 1.6 percentage points, whereas drugs & bio about 0.2% (0.88% in 1980-85 and 1.03% in 1991-96). Every other technological group decreased its relative size in total patents, except the residual category of ‘other’ technologies.
Now, if we consider the sequence of change in ICT’s share we can observe that it appears to slow down for the latter part of the period under analysis. The same is true for materials technology. In contrast, drugs & bioengineering takes on an increasing importance in technology portfolios in the sub-period 1991-96, though we cannot supply conclusive evidence of this. Another, but again weak, reinforcement of the likelihood of this emerging trend in drugs & bioengineering appears when we exclude ICT from the table for purposes of sensitivity analysis. Comparing diversification structures for different sub-periods as if ICT did not exist, the drugs & bioengineering technological group emerges as the only one increasing its relative size in the diversified patent portfolio of the average
industry. While this analysis reveals that Materials technology’s share grew during the 1980s, the 1990s witnessed a stabilisation of this process.
Table 5.2 The structure of technological diversification measured as the distribution of patents granted to firms outside ‘core technical fields’
1980-85 1986-90 1991-96
Chemicals 12.0 9.1 8.5
Fine Chemicals 18.0 14.5 15.6 Drugs & Bio 0.9 0.9 1.0
Materials 4.7 5.7 6.3 Mechanical 15.7 14.7 12.7 Transport 1.6 1.7% 1.5 ICT 8.2 12.5 15.7 Electrical 25.5 26.0 25.2 Other 13.4 14.9 13.5 100% 100% 100%
ICT, materials and drugs & bioengineering: the contribution of non-specialist sectors
So far our empirical exploration has emphasised the uneven attractiveness of different technologies when companies patent outside their traditional competencies. The literature on technological diversification emphasises both variety within the firm as well as variety between firms. Due to the limitations of the data available we cannot go deeper than the industry level. Therefore we are constrained to apply a sectoral approach, which disregards inter-firm variability. This implies difficulty in producing generalizations. The examination of the main features of the three most attractive patent groups offers, nevertheless, interesting insights into the process of development of technological diversification in the last two decades of the twentieth century. We will now explore the role these key technologies play in the technology portfolio of different sectors.
Those industries in which ICT patents classes do not figure as ‘core technical fields’ contribute consistently with about 25% of all ICT patents throughout the three sub-periods. This has been an impressive performance by non-specialists, since ICT patenting by specialist sectors, i.e. computers and electrical/electronic industries, exploded during this time. Indeed, the growth in the volume of ICT patents originating in non-ICT sectors was much higher than the growth in patenting in ICT sectors. The rate of variation of the ICT technology group between 1980-85 and 1991-96 was 223% for the non-specialist sectors, whereas for ICT specialists it was 177%. Meanwhile, the growth of non-ICT sectors was higher between 1980-85 and 1986-90, whereas ICT patenting grew more in ICT specialists than non-specialists between 1986-90 and 1991-96.
Additionally, while ICT industries have themselves been among those narrowing their technological scope and concentrating on their prime fields of expertise, ICTs have progressively broadened the industry base from which new patents are harvested (Mendonça 2002). Indeed, all but the paper industry increased their patenting in ICT fields, but some industries more dramatically than others (see Table 5.3). These findings need to be qualified. This stylised fact is very strong but the increase in the ICT share of the non-ICT industries’ portfolios was slower during the periods 1986-90/1991-96.
Table 5.3 Percentage distribution in the contribution of sectors to ICT patenting
1986-90/1991-96 1980-85/1991-96 1980-85/1986-90 95% 66% 123% Non-specialists 61% 72% 177% Specialists
Source: Elaborations on the SPRU database
ICT is the technological group that increased most dramatically in the average portfolio but, as could be expected and Figure 5.2 shows, there is considerable industry variation when companies patent in ICT. ICT is important, and increasingly so, for the photography & photocopy, motor vehicles & parts, aerospace and machinery industries4. Another observation is that the metals and materials industries,
for which ICT did not represent a large share of total patenting, are integrating that technological field in their knowledge portfolios rapidly and in a substantive way (Mendonça 2002). An apparent
implication of these findings is that cutting-edge technology capabilities in not only in utilising, but also generating ICT are of key importance for an increasing number of large corporations in almost all sectors. However, it is not clear what this increasing pervasiveness in ICT activity really means. We will return to this issue in the next section.
Figure 5.2 The number of patents within ICT obtained by firms in non-specialist sectors (log-scale) 1 10 100 1000 10000 100000 Aero spac e Chemic als Food, Drin k & To bacco Machin ery Mater ials Metals Minin g & Pe trole um Motor Veh icle s an d par ts Pape r Phar maceu ticals Phot ogra phy and Phot ocop y Rubb er & Pla stic s 1980-85 1985-90 1991-96
Source: Elaborations on the SPRU database
The case of materials technology is different from ICT. Non-specialists have been the first contributors to the filing of patents in this technological category. Furthermore, the importance of the contribution of non-specialists to the total number of patents grew considerably over the time period of our analysis, starting from 70%, then 75%, and reaching 81% in 1991-96. A similarity with the ICT case is that the growth of the contribution of non-specialists was consistently higher than the growth in materials patenting by specialists sectors as can be seen in Table 5.4. Among non-specialists, large contributors to new materials patents are the chemicals, electrical/electronics and photography & photocopy industries5. The greatest increases in patenting were seen in the photography & photocopy, computers and chemicals industries. Among specialist sectors, i.e., the materials, metals, paper and rubber & plastics industries, patenting performances were not distinctive.
Table 5.4 Percentage distribution in the contribution of specialists and non-specialists to materials technology patents obtained by all firms
1986-90/1991-96 1980-85/1991-96 1980-85/1986-90 Non-specialists 57% 47% 130% Specialists 22% 8% 32%
Source: Elaborations on the SPRU database
Patterns detected in the drugs & bioengineering group show that specialist sectors, i.e. the pharmaceutical industry, the food, drink & tobacco industry and the chemicals industry, dominate the production of this technology with a share of about 90% of all patents granted. We also note that specialists’ patenting growth is higher in the 1980s, whereas non-specialists perform comparatively better in the early nineties as shown in Table 5.5. However, the greatest overall increase in patenting was experienced by non-specialist industries.
Table 5.5 suggests furthermore that non-specialist patenting in drugs & bioengineering grew relatively more from 1980-85 to 1991-96 (last column) and seemed to have accelerated between 1986-90 and 1991-96. Non-specialist industries that contribute the most to the non-specialist sector patenting are the photography & photocopy, mining & petroleum and the metals industries.6 The highest growth rates in patenting between 1986-90 and 1991-96 were felt in mining & petroleum, photography & photocopy, metals, electrical/electronics, machinery and the computer industries.7
Table 5.5 Growth in drugs & bioengineering patents obtained
1980-85/1986-90 1986-90/1991-96 1980-85/1991-96 Non-specialists 124% 160% 199% Specialists 131% 146% 191%
Comparing growth and growth differentials between technology groups
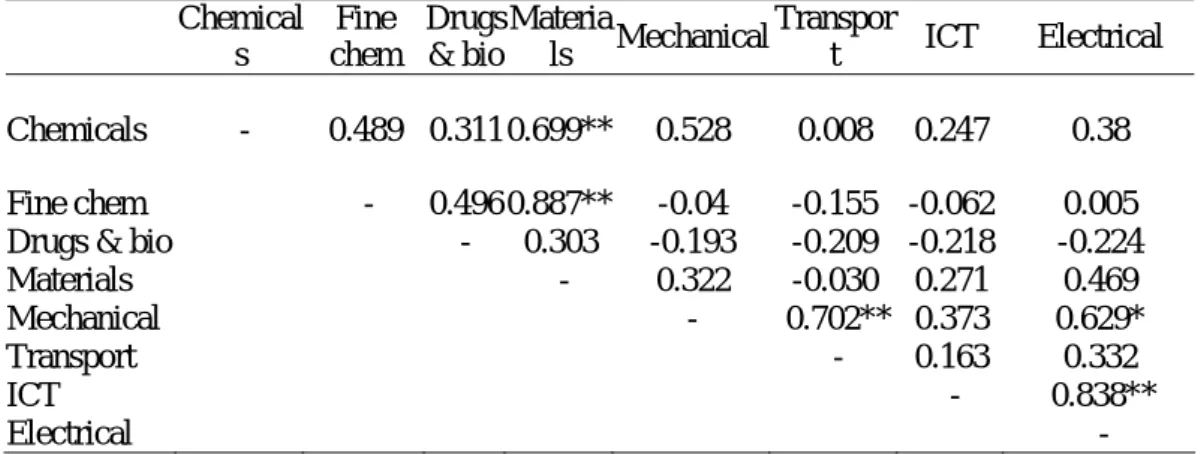
What are the parallels between the rates of variation of different technological groups? Such information can indicate which technologies that tend to be developed together by multi-technology firms. In Table 5.6 we correlate the growth observed in patent counts by the different industries and find several statistically significant correlations. We see that between 1980-85 and 1991-96 growth tends to be positively correlated between technological fields that have some art-based similarities, which can hide a danger of spurious correlation. However, it is interesting to note that the strongest correlations involve two of our key technologies for technological diversification: materials and fine chemicals, ICT and electrical technology. It is also interesting to see that the growth in the new field of drugs & bioengineering seems detached from possible interrelations with other technological groups.
The data suggests that the ‘new economy’ technologies of ICT and materials co-evolve with the old. There is no evidence that the growing technological opportunities emerging in these fields have destroyed the relevance of established fields of competence. At the same time, the accelerating growth of drugs & bioengineering appears disconnected from the rest of the technological groups, which is in line with its revolutionary character. The radical breakthroughs in the life sciences, particularly in the area of molecular biology and molecular genetics, date from the early 1970s and revolutionised the route to new drug discovery. Not until the early 1980s did the applications of these radical new technologies start to develop seriously (Sharp and Senker 1999). New applications for biotechnology outside the pharmaceutical industry are becoming apparent every day, for example, in wine making and the cork industry.
Table 5.6 Correlation between patent growth by technological groups between 1980-85 and 1991-96 Chemical s Fine chem Drugs & bio Materia ls Transpor t
Mechanical ICT Electrical 0.699**
Chemicals - 0.489 0.311 0.528 0.008 0.247 0.38 0.887**
Fine chem - 0.496 -0.04 -0.155 -0.062 0.005 Drugs & bio - 0.303 -0.193 -0.209 -0.218 -0.224 Materials - 0.322 -0.030 0.271 0.469
Mechanical - 0.702** 0.373 0.629*
Transport - 0.163 0.332
ICT - 0.838**
Electrical -
Source: Elaborations on the SPRU database
Note: * indicates correlations significant at the 0.05 level (2-tailed); ** indicates correlations significant at the 0.01 level (2-tailed)
Creative accumulation appears to be the result, but the story does not have to end here. Trying to detect signs of substitution tendencies between technologies is a more subtle matter. We designed a complementary analysis in which we tried to assess the way in which each of the technology components of the different industries varied across time periods. For a given industrial sector the volume of patents in each technological group can grow but at different rates, so that certain components of the competence portfolio can systematically gain weight in relation to others. Basically, if a technological group tends to enlarge as a component of an industry’s technological portfolio this can mean that the technology is surpassing another technological field in terms of importance in the hierarchy of competencies in which the industry is active, given that propensities to patent in different patent classes remains constant. Using the terminology of Granstrand et al. (1997) this means that a certain technology can move from being marginal or niche to become a core technological field where the industry is increasingly committed and competent. Our aim is to detect these movements.
For each industry we computed the structure of the technology portfolios and found the percentage point change between 1980-85 and 1991-96. We then correlated the changes in technological groups. We found only two statistically significant correlations, both negative. The growth in the drugs & bioengineering component of technology portfolios was found to be negatively correlated with fine chemicals technology at the 0.05 level, two-tailed test (= -0.647). The other significant correlation, this time at the 0.01 level, two-tailed, is between ICT and electrical technology ( = -0.681). In other words, the ICT and drugs & bioengineering components of technology portfolios register a rise in their share of total patents that is associated with a diminishing share of the other two older technologies. This is certainly evident in the case of ICT. As seen above, ICT and electrical patents grow together, but the rise of ICT is coupled with the fact that electrical technology loses ground in the average technology portfolio.
5.THE CHANGING COMPOSITION OF TECHNOLOGICAL DIVERSIFICATION
The role and importance of technologies differs across industries. There are, nevertheless, some regularities emerging in the process of technological diversification over time. The results show how ICT, new materials and drugs & bioengineering all exert a powerful influence on practically all sectors, not only on the industries that are specifically devoted to selling artefacts primarily based on them or produced with their assistance. An implication of this is that the technological diversification phenomenon has been changing. What is the nature of this change?
Over time multi-technology companies keep changing their capabilities while maintaining their previous heterogeneous, or incoherent, technological profiles. The literature mostly argues that technology profiles are industry-specific but is more ambivalent as to whether there should be any process of technological convergence between industries. However, the major point that emerges from the patterns observed in the U.S. Patent and Trademark Office data is that ‘old-tech’ sectors give signs
of renewing their patent portfolios with new technologies. Our empirical exploration shows an accelerating pattern of convergence when companies from different industries patent outside their traditional fields of technological expertise. This is in line with previous findings using patents (Fai and von Tunzelmann 2001a) and fits with the tendencies of development of the major international networks of inter-firm alliances (Hagedoorn, Giuri and Mariani 2000). Although the period covered by the data is not sufficient to test long wave arguments, our findings support the view that the new technological paradigms gradually influence all industrial sectors (Freeman and Louçã 2001).
We find evidence of complementarity between pairs of technology groups as they grow together and are accumulated by companies. Nevertheless, as new technologies climb up the list of technologies patented by industries when they patent outside their ‘core technical fields’, the question arises as to whether there is some kind of creative rearrangement of the importance of capabilities in the distributed competences in the profiles of companies. It may be that new technologies increasingly replace old ones in some key coordinating roles of corporate technology systems.8 At the present level of analysis, we can only suggest very indirect ways of testing such a hypothesis.
The analysis focused primarily on technologies, rather than industries. We adopted the notion of corporate coherence used to refer to related diversification at the product level and adapted it to refer explicitly to the corporate knowledge base. We sought to develop an understanding of the behaviour of technological profiles across industries over time. The patterns show that, by the 1990s, patenting in ICT, new materials and drugs & bioengineering became an important issue for non-specialists. Results are especially strong for ICT. All industries, except the paper industry, have increased the share of ICT patents in their technology portfolio, in particular computers, the electrical/electronics sector, photograph & photocopy, machinery, metals, motor vehicles & parts and materials industries.9 A quarter of ICT patents come from outside ICT sectors. The world’s largest innovative companies have not remained passive as the ICT tide advanced. But what explains the fact that the cluster of ICT-related technologies is not just utilised, but also increasingly developed by ‘old economy’ sectors? One hypothesis is that ICT has the potential to ‘fuse’ with many different technologies and that the resulting new technologies are likely to play a particular role in creating new areas of technological interconnectedness in the current paradigm (Cantwell and Santangelo 2000).10 This might have implications not only for product design and process improvement, but also for the ability of the firm to manage the competitive forces it faces.
Technological capabilities are also more widespread than is usually recognized in the cases of new materials technology and drugs & bioengineering. As in the case of ICT, non-specialist sectors performed relatively higher than specialists in the rate of growth of new patents during the 17 years under analysis. Again, beneath these technological trends there are industry-specific regularities that are useful to differentiate but the basic insight is that industries augmenting their share of drugs & bioengineering in their portfolios are essentially not the same as those augmenting the share of materials technology, except photocopy & photography, electrical/electronics and the computer industries. As in the case of ICT, the generation of cutting-edge capabilities in new material and drugs & bioengineering by non-specialist companies remains a captivating stylised fact of the late twentieth
century. How can we explain in detail this ‘active diffusion’ process of generic, revolutionary or general-purpose technologies?
In our tentative approach to this question, we are compelled to frame the phenomenon of the evolving corporate technological profiles in the context of a larger historical transition between techno-economic paradigms. Changes are rapid for such a short period and presumably encouraged by high technological opportunities and associated profit prospects (Dalum et al. 1999). It is more difficult to speculate about the micro-motives that contribute to attract industries from their path-dependent technological trajectories. We suggest two related interpretations.
Firstly, as specific new technologies become a vital element of the innovative and productive system, the governance of that system will start to depend critically on the knowledge of the principles of the new technologies. Sophisticated knowledge and numerous patent claims emerge therefore as strategic assets that companies use with the intention of managing technological and productive relations with other players of the national (and international) system of innovation and the web of relations in which the firm is embedded. Intellectual advantage can be used to manage relations with innovative suppliers, but also with rivals, buyers, potential entrants, producers of substitute products, universities, government labs, regulators, etc. One remaining source of advantage is internal R&D activity, which enables the large innovative organisation to gain a degree of autonomy in generating advanced technological capabilities in the newly important fields. In this sense, R&D can have a third face, since it can enable the company to coordinate its competitive and collaborative environments. The discussion around multi-technology firms as system integrators and knowledge brokers promises interesting insights (Pavitt in this volume).11
Secondly, one way to explain the persistent, but changing, incomplete technological coherence of established industrial giants is to probe the potential reasons as to why a variety of internal capabilities may play an important role in the reproduction of organizations. Knowledge of key technologies may be critical for large firms to sustain themselves as central knots in a web of technological and economic relations. However, long-term corporate survival implies renewing technological and organizational capabilities and this means continuously opening technological options, as they are costly to develop and the evolution of the business environment is uncertain. The managerial implication is that tolerance of activities at the margin and willingness to experiment within the boundaries of the firm is a way to keep stretching the understanding of possibilities and preventing old competence configurations from becoming rigidities (de Geus 1997). As Hodgson (1999: 26) puts it in his description of the so-called ‘impurity principle’, every socio-economic system relies on at least one ‘structurally dissimilar subsystem’ in order to function. Following these ideas, a more organizational line of research would assess the specific mechanisms by which technological incoherence or impurity facilitates corporate learning and renovation.
The last topic of this section has to be methodology. There is always the possibility that the patterns extracted from the dataset are due to spurious turbulence in the patent indicator. Recent research on patenting practice (Cohen et al. 2000; Hicks et al. 2001; Jaffe 2000) does not point to variations on propensities to patent that would make the observed shifts in patenting a function of non-systematic
behavior of companies, industries or countries. Our figures do not include software data. However, the inclusion of such data would probably only make the patterns we found for ICT even more pronounced.12 In order to conduct a careful empirical analysis, we gained extra leverage against the limitations of the database by reclassifying the patent classes into new groups. This provided a way of performing sensitivity analysis and filtering the most robust empirical regularities. Last but not least, in the appreciation of patterns of evolution, we preferred to rely mostly on descriptive statistics.
6.CONCLUSION
This work has sought to track changes in the composition of corporate technological portfolios in the last two decades of the twentieth century. In doing so we discovered a period of transition in the development of the technological diversification trend. The multi-technology phenomenon is in itself probably an aspect of a broader process of change, i.e. the transition to a knowledge economy. The importance of this research lies in the fact that to understand the future organisation of economic innovation one must necessarily start by understanding the changes that have occurred in the very recent past.
We presented suggestive evidence about the unevenness of technological diversification and found such diversification to be directed more towards some technologies than others throughout successive time periods. Our empirical study points to an increasing generation of ‘new technology’ patents by non-specialists, including ‘old-technology’/‘old-economy’ companies. By the 1990s cutting-edge knowledge about ICT, drugs & bioengineering and new materials is no longer exclusive to specialist sectors. In particular, the pervasiveness of the cutting-edge ICT capabilities in non-ICT industries should not be underestimated. This diffusion of key technologies suggests a link between multi-technology trends in the organization of knowledge and innovation and the rise of a new techno-economic paradigm.
The dissemination of capabilities in new materials and drugs & bioengineering across non-specialist industries is a complex phenomenon that is not easily explained. Undoubtedly, there are industry-specific regularities beneath basic technological trends that are useful to differentiate. In order to discuss this dynamic puzzle, we tentatively suggest two hypotheses worth researching in the future: the third face of R&D and the strategic rationale behind technological incoherence.
The first hypothesis stresses the role of multi-technological knowledge for orchestrating a web of relationships with other actors, such as suppliers, partners, universities and public institutions. R&D not only constitutes a source of inventions and a basis for the absorption of technical knowledge developed elsewhere, it also brings power in socio-economic interactions. Diversified, cutting-edge and proprietary technological knowledge strengthens the company’s position in strategic negotiations with other players of sectoral, national and international systems of innovation. Thus, the third face of R&D is relational as it facilitates the coordination of a network of actors in the company’s advantage.
The second idea is that internal diversity in capabilities can increase the chances of survival and success in a complex and ever-changing environment. A distributed set of technological competencies is also costly to integrate, both in terms of different components in new artifacts and in terms of making multidisciplinary teams work together smoothly. There is a cost side to technological diversification that should also constitute an object for further research. An interesting avenue for exploration is the extent to which new organizational arrangements, or social technologies, are evolving to cope with the dynamics of the changing corporate knowledge bases.
The existence of interrelations between different technologies is yet another challenging topic in terms of empirical analysis. Our limited incursion into the matter suggests that some features of the process of technological diversification indicate the subordination of some technologies by others in corporate technology systems. Attempts to understand the multiple dimensions of technological diversification are likely to continue to shed light on broader patterns of innovation and structural transformation. Results of these efforts will certainly appeal to managers and policy makers.
NOTES
1
The process leading to this paper is indebted to Keith Pavitt. His provocative views, useful advice and encouragement constituted a major source of inspiration in this work. Keith loved to engage in debates, my wish is that he would have found the views expressed here interesting enough to contend with. Nick von Tunzelmann, Ed Steinmueller, Pari Patel and Alfonso Gambardella provided precious comments on earlier stages of this research. I am grateful to the participants of the DRUID Summer Conference 2002 for their discussions. Jens Christensen, Keld Laursen, Peter Maskell, Dan Ward and Isabel Salavisa offered helpful suggestions in the revision process. The use of SPRU’s, University of Sussex, database is gratefully appreciated. The author is a member of DINÂMIA, a research unit of ISCTE University, School of Labour and Business Studies. The usual disclaimer applies.
TT2 A detailed description of the database can be found in Patel (1999).
3
Elsewhere (Mendonça 2002), we have considered this group as a residual ICT family with the strict purpose of using it to add ‘noise’ to ICT and check if the patterns still hold.
4
See, for example, Griliches (1990) and Patel and Pavitt (1995).
5
These sectors explain 84% of non-specialist ICT patents in 1991-96.
6
These sectors explain 71% of non-specialist materials technology patents in 1991-96.
7
These sectors explain 71% of non-specialist patents in drugs & bioengineering in 1991-96.
8
Detailed industry-by-industry analysis of patenting growth is not carried out for 1980-85 and 1991-96 due to the existence of small numbers in the first sub-period, which distort inter-temporal comparisons.
9
Digitisation of the engine control systems and its climbing up the hierarchy of the technological subsystems that make a modern jet able to fly and carry out its tasks represents a vivid example (Prencipe 2000).
10
In the future, studies will probably need to be more careful in relation to photocopy & photography, because a case can be made to include at least part of the industry (photography) in the ICT sector, due to the drastic shift occurring in its knowledge base in our short time frame.
11
Yet another, more sociological hypothesis, is to consider the potentially facilitating role of ICT in the process of the creation of diversified knowledge research networks. This possibility would lead to reflections about trans-disciplinary community formation and the dynamics of virtual collaboration. Although this may be an interesting avenue for further research, these topics lie outside the present scope of analysis.
12
A related opportunity for investigation is the connection between the increasing vertical disintegration in the innovative stages of complex products industries and the development of markets for technology. Markets for technology are an increasingly important institution in the way innovation is organized in contemporary societies. See, for example, Arora et al. (2001).
13
This would be the case for the pharmaceuticals sector due to the innovative use of computer simulation technology (Nightingale 2000).
REFERENCES
Acha, V. and S. Brusoni (2002), ‘Knowledge on wheels: new lessons from the tire industry’, paper presented at the DRUID Summer Conference 2002 on the Industrial Dynamics of the New and Old Economy: Who is Embracing Whom, Copenhagen, Denmark, June 6-8, 2002.
Arora, A., A. Fosfuri and A. Gambardella (2002), ‘Markets for technology and their implications for corporate strategy’, Industrial and Corporate Change, vol. 10, no. 2, 419-51.
Brusoni, S., A. Prencipe and K. Pavitt (2001), ‘Knowledge specialization, organizational coupling and the boundaries of the firm: Why do firms know more than they make?’, Administrative Science Quarterly, 46, 597-621.
Fai, F. and J. Cantwell (1999), ‘Firms as the source of innovation and growth: The evolution of technological competence’, Journal of Evolutionary Economics, 9, 331-66.
Cantwell, J. and C. Noonan (2001), ‘Technological relatedness and corporate diversification: 1890-1995’, paper presented at Druid’s Nelson & Winter Conference, 12-15 July 2001, Aalborg, Denmark.
Cantwell, J. and G.D. Santangelo (2000), ‘Capitalism, profits and innovation in the new techno-economic paradigm’, Journal of Evolutionary Economics, 9, 131-57.
Chandler Jr., A.D. and H. Daems (1980), ‘Introduction’, in A.D. Chandler Jr. and H. Daems (eds), Managerial Hierarchies: Comparative Perspectives on the Rise of the Modern Industrial Enterprise, Cambridge, Mass.: Harvard University Press, pp. 1-8.
Christensen, J.F. (2000), ‘Building innovative assets and dynamic coherence in multi-technology companies’, in N.J. Foss and P. Robertson (eds), Resources, Technology and Strategy: Explorations in the Resource-based Perspective, London, UK: Routledge, pp. 123-52.
Cohen, W., R. Nelson and J. Walsh (2000), ‘Protecting their intellectual assets: Appropriability conditions and why U.S. manufacturing firms patent (or not)’, NBER Working Paper Series 7552. Dalum, B., C. Freeman, R. Simonetti, N. von Tunzelmann, and B. Verspagen (1999), ‘Europe and the
information and communication technologies revolution’, in J. Fagerberg, P. Guerrieri, and B. Verspagen (eds), The Economic Challenge for Europe: Adapting to Innovation Based Growth, Cheltenham, UK, Northampton, MA, USA: Edward Elgar.
de Geus, A. (1997), The Living Company, Cambridge: Harvard Business School.
Dosi, G., D. Teece and S. Winter (1992), ‘Toward a theory of corporate coherence: Preliminary remarks’, in G. Dosi, R. Gianneti, and P.A. Toninelli (eds), Technology and Enterprise in Historical Perspective, Oxford, UK: Claredon Press.
Cantwell, J. and F. Fai (1999), ‘Firms as the source of innovation and growth: the evolution of technological competence’, Journal of Evolutionary Economics, Vol.9, no. 3, 331-66.
Fai, F. and N. von Tunzelmann (2001a), ‘Industry-specific competencies and converging technological systems: Evidence from patents’, Structural Change and Economic Dynamics, 12, 141-70.
Fai, F. and N. von Tunzelmann (2001b), ‘Scale and scope in technology: Large firms 1930/1990’, Economics of Innovation and New Technology, vol. 10, no. 4, 255-88.
Foss, N.J. and J. Christensen (2001), ‘A market-process approach to corporate coherence’, Managerial and Decision Economics, vol. 22, 213-26.
Freeman, C. and F. Louçã (2001), As Time Goes By: From the Industrial Revolutions to the Information Revolution, Oxford, UK: Oxford University Press.
Gambardella, A. and F. Malerba (1999), ‘The organization of innovative activity in Europe: Toward a conceptual framework’, in A. Gambardella and F. Malerba (eds), The Organization of Economic Innovation in Europe, Cambridge: Cambridge University Press.
Gambardella, A. and S. Torrisi (1998), ‘Does technological convergence imply convergence in markets?: Evidence from the electronics industry’, Research Policy, vol. 27, 445-64.
Granstrand, O. (1998), ‘Towards a theory of the technology-based firm’, Research Policy, 27, 465-89. Granstrand, O. (2000), ‘The economics of mul-tech: A study of multi-technology corporations in
Japan, Sweden and the US’, background paper submitted to the Dynacom project, mimeo.
Granstrand, O., P. Patel, K. Pavitt (1997), ‘Multi-technology corporations: why they have ‘distributed’ rather ‘distinctive core’' competencies’, California Management Review, vol. 39, 8-25.
Granstrand, O. and S. Sjölander (1990), ‘Managing innovation in multi-technology corporations’, Research Policy, vol. 19, 35-60.
Granstrand O. and S. Sjölander (1992), ‘Internationalisation and diversification of Multi-technology Corporations’, in Ö. Granstrand, L. Håkanson and S. Sjölander (eds), Technology Management and International Business: Internationalisation of R&D and Technology, Chischester: John Willey and Sons.
Griliches, Z. (1990), ‘Patent statistics as economic indicators: A survey’, Journal of Economic Literature, vol. 27, 1661-707.
Hagedoorn, J., Giuri, P. and M. Mariani (2000), ‘On technological diversification and strategic alliances’, mimeo.
Hicks, D., T. Breitzman, D. Olivastro and K. Hamilton (2001), ‘The changing composition of innovative activity in the US - A portrait based on patent analysis’, Research Policy, 30, 681-703 Hodgson, G. (1999), Economics and Utopia: Why the Learning Economy is Not the End of History,
London and New York: Routledge.
Jaffe, A.B. (2000), ‘The U.S. patent system in transition: policy innovation and the innovation process’, Research Policy, 29, 531-57.
Lawson, C. (1997), ‘Towards and competence theory of the firm’, ESRC Centre for Business Research, University of Cambridge, Working Paper no. 81.
Mendonça, S. (2002), ‘The ICT Component of Technological Diversification: Is there an underestimation of ICT capabilities among the world’s largest companies?’, SPRU Electronic Working Paper Series, no. 82.
Narin, F. and D. Olivastro (1988), ‘Technology indicators based on patents and patent citations’, in van Raam, A. (ed.), Handbook of Quantitative Studies of Science and Technology, Amsterdam: North Holland, pp. 465-95.
Nelson, R (1991), ‘Why firms differ, and how does it matter?’, Strategic Management Journal, Winter, 61-74.
Nightingale, P. (2000), ‘Economies of scale in experimentation: Knowledge and technology in pharmaceutical R&D’, Industrial and Corporate Change, vol.9, 315-59.
Patel, P. (1999), ‘Measurement and analysis of technological competencies of large firms’, draft report Dynacom project.
Patel, P. and K. Pavitt (1994), ‘Technological competencies in the world’s largest firms: Characteristics, constraints and scope for managerial choice’, STEEP Discussion Paper no. 13. Patel, P. and K. Pavitt (1995), ‘Patterns of economic activity: Their measurement and interpretation’,
in P. Stoneman (ed.), Handbook of Economics of Innovation and Technical Change, Blackwell: Oxford.
Patel, P. and K. Pavitt (1997), ‘The technological competencies of the world's largest firms: Complex and path-dependent, but not much variety’, Research Policy, 26, 141-56.
Pavitt, K. (1998a), ‘Introduction’, in Technology, Management and Systems of Innovation, Cheltenham, UK, Northampton, MA, USA: Edward Elgar.
Pavitt, K. (1998b), ‘Technologies, products and organisation in the innovating firm: What Adam Smith tells us and Joseph Schumpeter doesn’t’, Industrial and Corporate Change, vol.7, 433-52. Prencipe, A. (2000), Divide and Rule: Firm Boundaries in the Aeroengine Industry, PhD Dissertation,
SPRU, University of Sussex.
Sharp, M. and J. Senker (1999), ‘European biotechnology: learning and catching up’, in A. Gambardella and F. Malerba (eds), The Organization of Economic Innovation in Europe, Cambridge: Cambridge University Press, pp. 269-302.
von Tunzelmann, G.N. (1998), ‘Localized technological search and multi-technology companies’, Economics of Innovation and New Technology, 6, 231-55.
Teece, D. and G. Pisano (1994), ‘The dynamic capabilities of firms: an introduction’, Industrial and Corporate Change, vol. 3, 537-56.
APPENDIX 1 -The SPRU Patent Classes
1 Inorganic Chemicals 2 Organic Chemicals 3 Agricultural Chemicals 4 Chemical Processes
5 Hydrocarbons, mineral oils, fuels and igniting devices 6 Bleaching Dyeing and Disinfecting
7 Drugs and Bioengineering 8 Plastic and rubber products 9 Materials (inc glass and ceramics)
10 Food and Tobacco (processes and products) 11 Metallurgical and Metal Treatment processes 12 Apparatus for chemicals, food, glass, etc. 13 General Non-electrical Industrial Equipment 14 General Electrical Industrial Apparatus
15 Non-electrical specialized industrial equipment 16 Metallurgical and metal working equipment 17 Assembling and material handling apparatus 18 Induced Nuclear Reactions: systems and elements 19 Power Plants
20 Road vehicles and engines
21 Other transport equipment (exc. aircraft) 22 Aircraft
23 Mining and wells machinery and processes 24 Telecommunications
25 Semiconductors
26 Electrical devices and systems
27 Calculators, computers, and other office equipment 28 Image and sound equipment
29 Photography and photocopy 30 Instruments and controls 31 Miscellaneous metal products
32 Textile, clothing, leather, wood products 33 Dentistry and Surgery