LIFE-CYCLE THEORY AND CASH FLOW MANAGEMENT
ISSUES IN CHINA
YANG MENG
Project submitted as partial requirement for the conferral of a
MSc. in Finance
Supervisor: Pedro Leite Inacio
ISCTE-IUL, Business School, Department of Finance
Abstract
As Chinese market reform accelerated, many enterprises are growing and facing the increasingly fierce competition and unpredictable risks. Many companies experienced a decline in the amount of free cash flow. In the entire life cycle of an enterprise, free cash flow is always the essential foundation of its existence and development. Therefore, the conception of "cash is the king" is deeply rooted in people's heart. Our country's current downward economy is under pressure. Many companies are facing the pressure of rising labour cost, and a reducing external demand. The survival and development of enterprises become more difficult. Thus the study on the relationship of enterprise life of free cash flow and performance at different stages is a very urgent task.
This thesis uses standard research and empirical research to explore the relationship of the different stages of a manufacturing enterprise life cycle with free cash flow and performance.
In the empirical research section, the data of the manufacturing industry in China A- share listed companies in 2004-2012 is selected as research sample. First of all, the sample of the selected companies is divided into the life stages, according to Dickinson's cash flow method. Then the author conducts descriptive and statistic regression analysis on growth, maturity and decline period respectively, according to the enterprise's different life stage. Comparing and analysing the result of the regression and analysis conclusion can be drawn: (1) During the growth period, free cash flow and corporation performance are positive related; (2) During the maturity period, free cash flow and corporate performance are negative related; (3) During the downturn period, free cash flow is negatively correlated with the corporate performance. Based on the research conclusion, relevant proposals are put forward.
Keywords: corporate life cycle, free cash flow, company performance JEL Classification: G31;G35
Resumo
Com a aceleração das reformas introduzidas no Mercado Chinês muitas empresas cresceram e passaram a enfrentar uma concorrência acrescida e a ficar mais expostas a riscos imprevisíveis. Muitas viram o montante dos seus cash flows baixar. Ao longo do ciclo de vida de uma empresa o cash flow livre é sempre a base da sua sustentação e do seu desenvolvimento. Por essa razão, o lema "cash is king" ficou bem gravado na memória das pessoas. A queda presente da economia chinesa tem-se traduzido numa maior pressão sobre as empresas. Muitas enfrentam a pressão do aumento dos gastos salariais e de uma redução na procura externa. A sobrevivência e o desenvolvimento das empresas tornaram-se mais problemáticos. O que torna o estudo das relações entre o ciclo de vida da empresa e o cash flow livre e a performance nos vários estádios uma tarefa ainda mais urgente.
Neste estudo utilizou-se procedimentos standard de investigação empírica para analisar a relação entre as várias fases do ciclo de vida das empresas da indústria transformadora com o free cash flow e a performance.
Na parte empírica utilizou-se uma amostra com os dados das empresas chinesas admitidas à cotação na categoria A entre 2004 e 2012. Em primeiro lugar aquela amostra foi dividida pelos estádios de vida de acordo com o método do cash flow de Dickinson. De seguida realizou-se uma análise de estatística descritiva e de regressão em relação aos períodos de crescimento, maturidade e de declínio, de acordo com a respetiva fase do ciclo. Comparando os resultados obtidos podem retirar-se as seguintes conclusões: (1) Na fase de crescimento. O cash flow livre e a performance têm uma correlação positiva; (2) Pelo contrário, no período de maturidade, o cash flow livre e a performance empresarial têm uma relação negativa; (3) Durante o período de declínio (ou de recuperação) o cash flow livre também está correlacionado negativamente com a performance. Com base nestas conclusões apresentam-se algumas recomendações para as empresas.
Palavras chave: ciclo de vida, cash flow livre, performance Classificação JEL: G31; G35
Index
1 INTRODUCTION ... 1
1.1 Free Cash Flow ... 1
1.2 Enterprise Life Cycle ... 3
1.3 Enterprise Life Cycle Division Method ... 4
2 Literature Review ... 5
2.1 Enterprise Life Cycle Theory ... 5
2.2 Free cash flow is negative correlation with company performance ... 7
2.3 Free cash flow has positive correlation with company performance... 9
2.4 Free cash flow and the company's performance is nonlinear ... 10
2.5 Enterprise Life Cycle and Performance ... 10
2.6 Financial strategy for enterprise in the start-up stage ... 11
2.7 Financial strategy for enterprise in the growth stage ... 12
2.8 Financial strategy for enterprise in the maturity stage ... 14
2.9 Financial strategy for enterprise in the decline stage... 16
3 Research hypothesis ... 18
4 Data ... 20
4.1 Target design ... 20
4.2 Regression model ... 21
5 Empir ical Analys is and Results ... 22
5.1 Test results and analysis ... 24
6 Conclusion... 28
7 Bibliography ... 30
INDEX OF TABLES Table1 Life cycle Main References ... 4
Table 2 Main Indicators ... 21
Table 3 Growth stage descriptive statistics ... 22
Table 4 Maturity stage descriptive statistics ... 22
Table 5 Decline stage descriptive statistics ... 22
Table 6 Model Summary ... 24
Table 7 ANOVAb ... 24
Table 8 Coefficientsa ... 24
Table 9 Model Summary ... 25
Table 10 ANOVAb ... 25
Table 11 Coefficientsa... 25
Table 12 Model Summary ... 26
Table 13 ANOVAb ... 26
1
1 INTRODUCTION
While more and more scholars have recently researched the financial strategy for business, there is little about financial strategy based on lifecycle. Many scholars in China had given the definition and the nature of the financial strategy (Zhi-yuan liu, 1997 etc.). Others analyze the relationship between the financial strategy and its environment (Zheng-fei lu, 1999). Ming-hai Wei gives the theory frame about financial strategy (2000). Yan-bo Zhang discussed the financial strategy for enterprise group (2002). Many scholars discuss financial strategy based on EVA, value-chain, industry cycle, value maximization, etc., but few researchers discuss financial strategy based on business life cycle. This thesis discusses financial strategy based on life cycle. Such as the goals of financial strategy, the essential point of financial strategy and the implementation of financial strategy. The thesis links the various theories of cost management with the essential point of financial strategy based on life cycle, and links Balanced Scorecard with the life cycle’s performance measurement.
In this thesis the whole life of enterprise is divided into four stages based on growth rate of sales and profit: start-up stage, growth stage, maturity stage, and decline stage.
1.1 Free Cash Flow
Free Cash Flow was proposed by Michael C. Jensen in 1990. According to the definition given by Jensen (1990), free cash flow is defined as the cash flow which is left when net present value is positive and fulfills the funds of all the projects. Kaplan (1990) considered that free cash flow is equal to EBIT minus income tax, plus depreciation and amortization and other non-pocket expenses, then minus the net increase in working capital and capital expenditures. Such free cash flow is calculated as the total after-tax cash flow which the company created. They use Kaplan’s formula
2
to calculate the free cash flow in S & P. After nearly 30 years of development, free cash flow has been widely used in business valuation and corporate governance, in theory, this indicator is also the most robust. Free cash flow as a corporate financial indicator is quite objective, its calculation is done on a cash basis, which is using the current actual payment amounts to confirm the current income and expenses, and this could greatly decrease the chance of the artificial manipulation of profits. FCF’s biggest feature is "free", it makes up for some indicators of the defects which reflect the company's true deficiencies in the level of performance to a certain extent, because it does not consider non-recurring gains and losses which are produced in non- normal business activities, but the cash which is remaining after the net cash flow produced by company’s business activities pays for the capital required to maintain existing production capacity. Generally speaking, stable adequate free cash flow can make the company have sufficient funds which can be used for re-investment, mergers and acquisitions, debt and pay dividends, and the company can get more advantages on access to credit, accounts receivable recovery, product competitiveness, seize more investment opportunities, growth potential, as well as other aspects of future development prospects. Free cash flow has a strong potential for judging a company's solvency, when company's free cash flow level is abruptly reducing, this reflects that the company's funds are dysfunctional, this indicates that the company may be in eminent financial crisis. Moreover, free cash flow also can be a foundation for company’s sales and back section capabilities, for example, company's product sales may increase but free cash flow might not have a corresponding change, this may be a sign of problems in the sales and back section capabilities, indicating that the company has a higher risk of credit sales.
Free cash flow comes mainly from three sources, first is from retained profits, company executives in order to control more resources, tend to let this part of the funds retained in the company rather than pay as a distribution of profits to shareholders, thereby forming a free cash flow available for discretionary. Second, from bank loans, if the company cannot effectively use these loans, excess cash will be formed. Third is from equity financing, listed companies get a lot of money from the capital market by
3
using IPO, or SEO, i.e. equity refinancing, after the spending on normal production, operation and investment, the remaining funds will form free cash flow.
1.2 Enterprise Life Cycle
Life-cycle concept comes from biology, it refers to the process of development of an organism from small to big. Adam Smith in "The Wealth of Nations" used the division of labor and the principle of increasing returns to scale, to analyze the process of business growth, there are many scholars researching technical innovation, organizational management perspective and property arrangements to study business growth. Now, scholars are analyzing the company's growth process from the perspective of capability and knowledge, such as Hammer’s core competence theory, focus on operating growth depends on the company's own ability, research firm inner growth process and its competitive advantage source. It referred to herein business life cycle theory, as part of the enterprise growth theory, which is formed in the process of exploring in business growth theory.
There are two meanings of corporate life, in space, it is targeted arrangement for enterprise capabilities, resources, and various elements, as well as organic combination of cultural and physical elements of the enterprise. In time, it is the enterprise to achieve their own goals, through input, output continuously exchange of matter and energy with the outside. The combination of these two meanings, thus the formed organic life business, experienced birth to death, the same is true of enterprises. Enterprises from the establishment to the demise is one of the simplest description lifecycle.
Through the compilation of relevant literature, as defined herein corporate life cycle, enterprise life cycle is the reference model which analysis enterprise dynamic development process, through itself characterized in the survival time of its development, artificially according to certain criteria divided its development process into several stages, and summed up the law of development of enterprises, promoting the sustainable and healthy development.
4
1.3 Enterprise Life Cycle Division Method
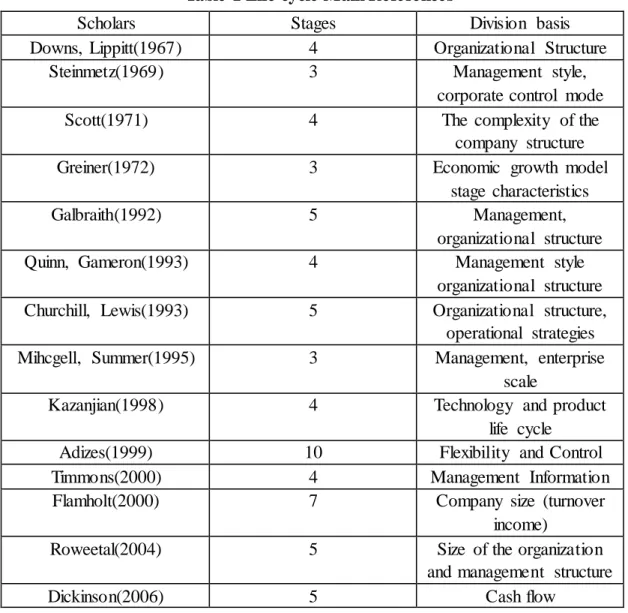
How many stages can corporate life cycle be divided into? How to judge a certain stage in the life cycle of enterprise? For now, there is no uniform measure, and there is no quantitative indicator system.
Table 1 Life cycle Main References
Scholars Stages Division basis
Downs, Lippitt(1967) 4 Organizational Structure
Steinmetz(1969) 3 Management style,
corporate control mode
Scott(1971) 4 The complexity of the
company structure
Greiner(1972) 3 Economic growth model
stage characteristics
Galbraith(1992) 5 Management,
organizational structure
Quinn, Gameron(1993) 4 Management style
organizational structure Churchill, Lewis(1993) 5 Organizational structure,
operational strategies Mihcgell, Summer(1995) 3 Management, enterprise
scale
Kazanjian(1998) 4 Technology and product
life cycle
Adizes(1999) 10 Flexibility and Control
Timmons(2000) 4 Management Information
Flamholt(2000) 7 Company size (turnover
income)
Roweetal(2004) 5 Size of the organization
and management structure
Dickinson(2006) 5 Cash flow
Source: Author Yang Meng
Scholars divided the corporate life cycle mainly from quantitative and qualitative approaches, they have different views on the number of stages of enterprise lifecycle. From a qualitative point of view, Scholars have used business management, management structure, corporate cash flow, operating strategy, technology and product life cycle as a division basis, although qualitative division basis is a little bit subjective, but this division is more realistic.
5
2 Literature Review
2.1 Enterprise Life Cycle Theory
J.W Gordon Neil (1965) studied "how to prevent the organization of stagnation and aging" theme, presenting a comprehensive analysis of the vitality and life cycle organizational issues. Research results, “an organization's life cycle cannot be predicted roughly, because it is still possible to restore life after experiencing a recession.” Ichak Adizes presented systematically the concept of enterprise life cycle, described and analyzed the behavioral characteristics of different stages of the enterprise life cycle, pointing out the forecast, analysis and diagnosis of enterprise culture method, and proposed Adizes Therapies for different stages of the enterprise life cycle to change the enterprise culture, to prolong the process of enterprise life.
This thesis is based on Dickinson (2006) five stages cash flow method. Dickinson (2006) divided cash flow into three kinds, operating, investing and financing cash flows. The different nature of cash flows corresponding to the company's share price gains are also different, also having differences on benefits and risks. The biggest advantage of the cash flow combined mode is to make the daily business activities of enterprises to adapt to corporate strategy, depending on the characteristics of the cash flow statement emerged, combined its life cycle into five different stages. Operating cash flow to a certain extent is continuing, according to the company's operating cash flow, it can be predicted in the case of full use of existing assets, the company's future cash flow and its corresponding overall risk profiles. In early business life cycle, companies’ growth require heavy investments, the improvement of profitability of the business leads to increasing cash flow from operations, and cash flow becoming positive. As the company continues to broaden product sales, technology continues to improve, expected future sales of the product will continue to increase, at the same time because of the increased inventory and accounts receivable, the company even has a stronger demand for cash, In the growth and maturity stage, product technology is relatively
6
stable, a substantial increase in sales revenue, and operating cash flow is positive. With the decline stage, enterprise product sales start to decline, operating cash flow tends to be negative, though we cannot determine if it is positive or negative in the phase-out period. The company's ability to obtain financing and debt typically is being more accurately reflected in the financing cash flow, The Company's financing activities are usually reflected in the company's assets future cash flows related information to investors. Companies often can only get very limited internal financing in set up and growth stage, having to rely on outside financing to ensure the company's survival and development, thus financing cash flow is positive in two phases. Companies usually have a good profitability in maturity stage, Businesses through the use of net cash flow from operating activities will be able to sustain company development, and financing cash flow is then negative at this stage. Financing cash flow in decline stage is uncertain, liquidation makes financing cash flow positive, if continually lending financing cash flow is negative. Investment cash flow reflects the relevant information about the future cash flows generated by the company's investment activities. Companies have better development potential and investment opportunities in the first three stages, investment cash flow being then negative. But in decline stage, companies lack funds, so when facing good investment opportunities, they are unable to invest so investment cash flow is positive.
For some stage financing cash flow is positive, operating cash flow and investment cash flow is negative, Dickinson defined this stage as the startup stage. This shows that enterprises to obtain certain initial investment is condition to ensure that it can profit in the market. In growth stage, financing cash flow is positive and investment cash flow is negative, as the companies need more investment. But in this stage, as the company begins to gain its monopoly rents as innovator, its operating cash flow is positive. The company then needs to repay to the pre investors in maturity stage, when the company is strong profitable, so during this period investment and financing cash flow are negative, while the operating cash flow is positive. Company’s operating results continue to reduce in decline stage, production scale shrinking, so operating cash flow and financing cash flow is negative, the investment cash flow is positive. Dickinson
7
classified all the remaining combinations of the type of other cash flow for the phase-out period.
Because of the limited sample data and to facilitate the subsequent verification of the empirical part, in this thesis, based on combination of cash flow method, divided data into growth, maturity, and decline stage.
2.2 Free cash flow is negative correlation with company
performance
Jensen (1986) from Harvard Business School proposed free cash flow hypothesis which is more focused on how to solve the cash flow problem of agency costs rather than just focus on themselves. He proposed two ways to solve the problem of free cash flow agency costs, liabilities and acquisitions, and through the relevant theoretical study and practical operation obtained important points about corporate control theory: first, liabilities can effectively improve operational efficiency, constraint managers’ behaviors; second, if the company has sufficient free cash flow it may become a target for an acquisition. Decisions. By both a company can reduce free cash flow agency costs, and increase shareholder wealth. Smith(1986) through empirical study found that share price follows leverage improvement announcements, and also follows leverage decline announcements, and then pointed out that enterprise value and lower degree of the payment of future cash flow constraints showed a positive relation. Lang (1989) found, free cash flow agency problem in the low-growth company is more significant, because after the release of the dividend policy changes, low growth companies share price is more severe, compared with high-growth companies. The company's management can identify this agency problem based on management experience, their psychological expectations is reflected in the share price often through dividend increase or decrease, the stock price will rise with the increase in dividend, the interests of shareholders safeguarded. Vasudevan (1996) found, in the absence of good investment opportunities, if companies issued long-term funds, it leads to the free cash flow agency problem, since three years after the issuance operating results continued to
8
decline. Nohel, Tarhan (1998) consider, in order to reduce agency costs of free cash flow, companies can through share repurchases let the internal surplus of free cash flow revert to shareholders. Share repurchases not only effectively alleviate the company's free cash flow agency problem, but also increase shareholder wealth. Accordingly, investors actively involved in the company's stock repurchase can be explained by the free cash flow hypothesis. When the company's asset-liability ratio is kept low and management held large cash flows, due to the lack of external supervision company executives are likely to be free to invest. That is, after making a reasonable investment spending, if the company still has free cash flow, management may put this amount for personal consumption, and other discretionary spending, which harm the interests of shareholders, making enterprise value fall. Stulz (1990), Cleary Sean (1999) found, if the company has sufficient cash flow, the company's management will use this cash flow to over-investment and other aspects which is detrimental to the interests of shareholders. Harford (1999) used Tobin’s Q as an indicator to measure investment opportunities, he selected 487 merger cases to analyze and draw the conclusion that, if the company has a high free cash flow it is more prone to have inefficient mergers and acquisitions, and those acquisitions often cause damage to corporate value, and cause non-normal decline in corporate performance. Schwetzler (2004) use a UK company which had possession of sufficient free cash flow in four consecutive years as a sample, the result showed that free cash flow is not sufficient to improve the company's performance, instead, and the agent cost issues made the value of the company decrease. Titman (2004) found, with the increasing investment capital, the company’s value will decrease, especially the company with high cash flow and low debt ratios, increasing capital investment along with the significantly decrease of company’s performance. Nicolas (2005) through empirical analysis of five countries 4500 listed companies, the result showed that the company's performance and how much free cash flow were held had a significant negative correlation. Firth and Chung (2005) empirical analyzed the relationship between company's earnings manipulation and free cash flow, their research indicated that managers manipulate earnings mainly due to the free cash flow agency costs, when the company has a lot of free cash flow, management is more likely
9
to hide their activities detrimental to the corporate value by manipulating earnings. Richardson (2006) studied the framework of accounting information and verified "investment - cash flow sensitivity" hypothesis, through a quantitative measure of the relative concepts, proved over-investment is existing when a company has an high level of free cash flow. Chae, Kim (2009), Chay, Suh (2009), Denis, Sibilkov (2009), Czamitzki, Hottenrott (2010) verified the cash held by a company has a significant positive impact on its investment spending, therefore, these companies cash dividend payment will not increase with the companies’ free cash flow increase, company managers are more likely to have sufficient cash for the lower efficiency of investment projects.
2.3 Free cash flow has positive correlation with company
performance
Hackel (2003) when building a securities model used to assess the free cash flow, for the first time elaborated the concept of discretionary spending. He believed that the company's management when analyzing capital expenditure cash flow should distinguish between necessary and arbitrary spending. Necessary capital expenditures should be able to promote the future growth of the company, these capital expenditures enable companies to seize growth opportunities timely, providing the impetus for long-term development of the company.
Pinkowitz (2004) select 30 countries and regions a total of 10 years of corporate data as sample, the research showed that enterprise holding sufficient cash flow enable shareholders to get a better well-being, these companies tend to have a more sound management mechanism, managers will stand the perspective of the interests of shareholders to take various measures to increase shareholder wealth, in order to promote the realization of business value.
10
2.4 Free cash flow and the company's performance is
nonlinear
Opler and Pinkowitz (1999) found that, free cash flow does not significantly affect company’s established investment, dividend and financing policies, the surplus funds have not been used for acquisitions and new investment. In order to prevent the shortage of resources caused by the company due to external financing constraints in the future, most of the company's management use free cash flow to offset operating losses or retained earnings in the company. Kholdy and Sohrabian (2001) used vector error modified the empirical model, they mainly researched on financing constraint problems faced by small and medium companies. The results proved that smaller companies often face the problem of financing constraints, but for the small companies having high level of free cash flow, agency cost problem is not serious.
2.5 Enterprise Life Cycle and Performance
In the 1980s, Robert S. Kaplan proposed “The Balanced Score-card”. BSC challenged traditional valuation methods which only relied on the enterprise financial indicators. BSC retained the financial evaluation indicators, while increased the number of driver indicators affecting the company’s future financial performance, and this can fully combine the company's growth process and evaluate performance. DeAngelo (2006) use retained earnings divided by net assets as a basis for dividing the enterprise life cycle. After researching on company dividend payment behavior, he considered company in growth stage have more investment opportunities, but this also limits the company dividend payment behavior; otherwise company in maturity stage have better profitability so they get less attractive investment opportunities, thus they tend to distribute dividends, and this will directly affect shareholder wealth.
Finger (1994) found when forecasting free cash flow in the enterprise, cash flow is stable in early time, but when forecasting longer term cash flows, prediction results of profit and free cash flow are consistent. Carroll and Griffith (2001) based on the
11
different stages of the enterprise life cycle through empirical research verified Jensen’s free cash flow hypothesis, and the results showed that when companies have more cash flow there is a lack of positive net present value investment projects, then managers prefer to invest in negative net present value projects, rather than distribute cash flow as dividends to shareholders.
2.6 Financial strategy for enterprise in the start-up stage
In the start-up stage, enterprises often need more cash, due to instability and mainly when they have lower market shares. Financial strategy in start-up stage being as follows.
A. Goal of financial strategy: In their first two years about 24% companies shut down, and 63% go to bankruptcy during the first six years according to a survey. So the goal of financial strategy in start-up stage is survival. Only the survivor can go to the next stage.
B. Location of the financial strategy: in start-up stage, enterprise should adopt conservative financial strategy. The focus of this strategy is to reach stable growth in performance and stable expansion of firm size. The most important thing is to optimize resources allocation and to improve its efficiency.
C. Essential point of the financial strategy: Raise money rationally, enlarge sales, perfect the financial system, and strengthen internal control.
To raise money rationally enterprise should be familiar with financing forecast, various financing means and its costs. In order to enlarge their sales, they may strengthen their sales management such as sales budget, market share and recovery of the purchase price etc.
Financial system includes financial management system, financial control system and financial analysis system.
D. Implementation of financial strategy
ⅰ.Financing strategy: main capital comes from investor, but the enterprise should use more venture capital. In the start-up stage, the enterprise can use more venture
12
capital if possible because financing from capital market or bank is difficult. Or enterprise can invest on some industry or area where there are incentives in order to use state capital. In this stage the decision making relays more on capital’s attainability.
ⅱ .Investment strategy: centralization strategy. Focus on given project or customers or market segments in order to get some advantage. In the meantime enterprise can enlarge its sales and size so as to get stable growth. For example they can exploit special product and increase technology investment to improve the product’s technological process and quality to get leader position, to invest in machinery equipment reasonable to rational size and to open up new channel of distribution to set product’s awareness.
ⅲ .Cost management: enterprise should control costs especially discretionary fixed costs such as advertisement and R&D expense through financial system or internal control in order to get more profits. They can enhance cost management from every item to improve economic benefits.
ⅳ.Dividend policy: In this stage enterprise may distribute low or zero dividends or noncash dividend in order to retain the most profit to satisfy the financing demand.
ⅴ.Performance measurement: In the start-up stage, the measurement criterion for enterprise should be the internal processes standardization and rationalization so that it can make the best of its way to normalization and get rapidly development. For example they can perfect their rules and regulations and ensure its implementation to normalize internal processes.
2.7 Financial strategy for enterprise in the growth stage
In the growth stage, enterprise often focus their strategy on market share may be based on discount, and the business size may not be so large to enjoy the economy of scale. In addition to as the growth of inventory, account receivable and product capacity the enterprise still needs a lot more capital though they can easily get liabilities. Financial strategy in growth stage will be as follows.
13
development, such as improvement of profit and risk management and size.
B. Location of the financial strategy: in growth stagy, enterprise should adopt expansion financial strategy. On one hand enterprise should retain large profits; on the other hand it should collect external funds as many as possible so that it satisfies its rapid expansion needs.
C. Essential point of the financial strategy: enhance cost management through activity-based cost approach, build up effective working capital management system. Other focal points include: reasonable capital or cash budget, better risk management, brand management and business culture.
Through activity-based cost approach enterprise can identify high efficient and low efficient work so as to increase the former and decrease the latter and eliminate non-value added work. By effective working capital management system they can calculate stock level exactly so as to reduce capital occupation and enhance credit management. Reasonable capital or cash budget can help business to ascertain its financing amount and select reasonable financing way. Better risk management can make them balance their operating and financing risks in order to better realize their goal.
D. Implementation of the financial strategy
ⅰ .Financing strategy: use more liabilities so as to get the profit from financial leverage. Use business credit to enlarge financing ways. In this stage enterprise can use hybrid securities to enhance its financial flexibility.
In this stage enterprise can rely more on liabilities to get leverage benefit on the basis of their soundness of financial and internal control system and owner’s capital and profitability’s improvement. In addition to, as the credit rating improvement and the size expansion they can make the better use of credit and finance capital on account to postpone capital stress and enlarge financing sources. Cost of capital is the main consideration of financing decision in the growth stage.
ⅱ .Investment strategy: integrative strategy. In growth stage enterprise should apply horizontal or vertical expansion so as to enlarge its size or prolong its value chain. Other focal points include: brand or human resource construction, project and sales
14
investment so that it can get continuous development.
In growth stage, enterprise should invest more on the brand establishment. Brand is core value of product and business. It is a symbol of quality and credit standing with additional added value and makes for business core competitiveness. Thus enterprise should invest more on the brand establishment so as to benefit their long-term development.
The essential competition between companies is human competition and businesses need more human capital in growth stage. They should integrate human strategy with the investment strategy. Through establishing human capital strategy and training media and senior managers they can attract more human capital.
ⅲ .Cost management: enterprise should decrease variable costs such as direct material and direct labor through activity-based cost. Through ABC it can eliminate low efficiency or non-value-added work and improve its profit capability.
ⅳ .Dividend policy: In this stage enterprise may distribute its benefit via capitalization issues or share bonus so that investors can share corporation’s performance without cash diminution.
ⅴ.Performance measurement: In the growth stage, the measurement criterion for enterprise should be the improvement of learning and growth. The capability of learning and growth is the root of corporation development and should be attached important to.
They can use the employees’ satisfaction, technology renovation and floating rate as measurement indexes so as to improve their abilities in solving problems.
2.8 Financial strategy for enterprise in the maturity stage
In the maturity stage, enterprise has a stable market share and high profit ratio and abundant cash flow. Financial strategy in maturity stage will be as follows.
A. Goal of financial strategy: Mature corporations have definite size and probability with stable quality products and market share. Their key target is not short-term profit or market share but the stability of their summit period. So the goal of
15
financial strategy in maturity stage is maximization business value. In the meantime fulfils its social obligation.
B. Location of the financial strategy: in maturity stage, enterprise should adopt maintenance financial strategy. Through diversifying its investment or merging or acquiring companies can make use of various opportunities from product or capital market. Based on this they can develop new profit points and sustain their size, profit capability and improvement trend.
C. Essential point of the financial strategy: Based on free cash flow hypothesis managers can embezzle investors profit more with more cash flow. Mature corporations should enhance their management capability in working capital for the maximum subtraction of agency conflict. In this stage they can enhance cost management through life-cycle cost approach, and implement diversified investment strategy or mergers and acquisitions strategy in order to diversify operating or financial risk.
D. Implement of financial strategy
ⅰ. Financing strategy: often use inner capital such as retained earnings or capital stock. Enterprise in this stage can use asset Securitization or Asset-Backed Securitization to finance capital. The rationality and stability of capital structure is the main consideration of financing decision in the maturity stage.
ⅱ . Investment strategy: diversification investment strategy. Use diversification investment strategy enterprise can diversify its risk and scoop potential capability of assets in place. Especially through correlation diversification enterprises can match their resources with their operating and apply their experience to new fields to get conformity effect. In maturity stage enterprise can enlarge their size and optimize their capital structure through capital operations. It is a stage for enterprise to form their core competitiveness through innovation on organization system and management.
ⅲ. Cost management: The equilibrium price of their products has been formed, so the competition between corporations is not price war but efficiency war in inner cost management. The key point of enterprise is to decrease life-cycle costs through
16
analyzing the value chain. Mature enterprise can set down reasonable expense budget by analyzing horizontal, vertical and inner value chain so that to minimize their cost and expenses. In this stage enterprise should establish an environment which continuously enhances competitive advantage and decrease costs.
ⅳ. Dividend policy: in this stage enterprise may distribute higher cash dividends so that investors can share corporate high development and diminish free cash flow. Diminish free cash flow helps to decrease agency conflicts.
ⅴ . Performance measurement: in the maturity stage, the measurement criterion for enterprise should be the market share and customer satisfaction. They are the foundations of profit. They can use the holding rate, obtaining rate, the satisfaction and the profitability of customers as measurement indexes. Enterprise can increase corporate value through customer relationship management and market share improvement too. In this stage the most important task for managers of enterprise is to create more value.
2.9 Financial strategy for enterprise in the decline stage
Decline stage often called abandonment stage. In the decline stage, enterprises are challenged with dropping sales, profits, and negative cash flow. The biggest issue is how long the business can support a negative cash flow. Financial strategy in decline stage will be as follows.
A. Goal of financial strategy: goal of financial strategy in decline stage is sustain or change. If it is possible, enterprise should prolong its maturity stage otherwise the best selection is to change another business to realize its benign “spallation”.
B. Location of the financial strategy: in decline stagy, enterprise should adopt defensive financial strategy. Financial management should focus on financial strategy conformity, financial organization system innovation and adjustment, new product investment and personnel distributaries etc. enterprise usually tries to enter a new development stage through new breach point or new investment direction.
C. Essential point of the financial strategy: search for new opportunities and business ventures. Cutting costs and finding ways to sustain cash flow. Other focal
17
points include: asset reorganization, early warning system establishment, system innovation, process reengineering etc.
Firstly, they should keep cash flows on the rails through decreasing expenditures and assets realization. Secondly, declining companies can improve returns on assets through implementing asset reorganization and optimizing long-run asset. Thirdly, declining companies should pay more attention to financial early-warning system to strengthen its management. Fourthly, the characteristics of declining companies request them to innovate in their financial organization, financial control and financial report system, and to reengineering their process through comprehensive alteration and design approach so as to realize its global optimization.
D. Implement of the financial strategy
ⅰ .Financing strategy: cash flow from operation is positive because of business decline. Business can get money through disposition of idle assets too.
Cash demands begin to decrease because of market shrinking and shortage of technical reconstruct. So cash flows from operations can satisfy the common cash demands from daily operation basically though they begin to decrease. Thus declining enterprise need not resort to finance from external unless heavy capital operation such as development of new product or industry transformation. The risk of repayment is the main consideration of financing decision in the decline stage.
ⅱ .Investment strategy: focus their investment on core business or change its strategy as soon as possible. In decline stage enterprise can centralize their resources on their core business through decrease or disposition of their non-core business based on an analysis of inner or external environments. If the core business is setting business then enterprise should cease new investment and seek strategic transformation positively.
ⅲ .Cost management: enterprise should cut various costs such as research and advertisement expense to earn more profit.
18
ⅳ .Dividend policy: In this stage enterprise may distribute higher cash dividends to increase investor’s returns. Decline enterprise often distributes their most earnings to their investors because of their obscuration prospect or less good project.
ⅴ. Performance measurement: in the decline stage, the measurement criterion for enterprise should be the improvement of cash flow and benefits. In order to implement strategy transformation as soon as possible enterprise should reclaim more investment and improve their debt-coverage ability through financial system innovation and process reorganization.
3 Research hypothesis
Through the theoretical analysis of above chapters, we can conclude that a company in different life cycle stage has a different demand of cash flow, and different performance. Next descriptive statistics and regression analysis are used to verify if there is a correlation between a company’s free cash flow and its performance in different life cycle stages. And if there is a correlation, what’s the size of the related degree.
Enterprises in growth stage's main goal is development. In this stage, companies become larger, profitability increases rapidly, growing sales of products to the needs of the market. Companies have a small amount of profit and require more capital expenditures. Although they have some profits in this stage, however, due to the increased amount of working capital and long-term capital investment needs that are much larger than the profits, company have a lack of cash. This phase of the market share directly determines the success of the enterprise, it should find ways to continue occupying the market. Facing many investment opportunities, but not corresponding funding are the factors most likely to lead to business failure, growing enterprise funds strand breaks is often one of the main reasons for its failure. When companies face a good investment opportunity, the lack of free cash flow has often a serious impact on long-term development. Thus, we put forward the hypothesis 1
19
Hypothesis 1 in growth stage free cash flow has a positive correlation with company performance.
When firms come to maturity stage, along with the increase in free cash flow, free cash flow agency cost issue is more prominent. In this stage, corporate sales and profits have been growing rapidly, the company has sufficient cash flow, but managers always like to use this plenty of free cash flow for discretionary expenditures, which are not conducive to the company realization of its value, rather than assign them to investors. This results in reduced efficiency of enterprise asset management, abnormal rise in the expense ratio, to the detriment of the company's performance. Overinvestment is a kind of internal friction loss to the enterprise in this stage, enabling enterprises advance into decline stage. Thus, we put forward the hypothesis 2.
Hypothesis 2 in maturity stage, free cash flow has a negative correlation with the company's performance.
Smith (1986), Titman (2004), Nicolas (2005), and other scholars agree that companies having more free cash flow they performance is affected. When companies transition from maturity stage to decline stage, product sales decline, they began to cut operating costs, so that they still maintain a certain level of profit, and accumulate a certain amount of free cash flow, free cash flow agency issue being more prominent at this time. Corporate management in the pursuit of their own economic interests, use the cumulative free cash flow for inefficiency, even for taking negative NPV investment projects, it is a kind of fatal blow to the enterprise, allowing companies to go directly to the death of irreparable. Thus, we put forward hypothesis 3.
Hypothesis 3 in decline stage free cash flow has a negative correlation with the company's performance.
20
4 Data
Manufacturing companies stocks in Shanghai Stock Exchange and Shenzhen Stock Exchange were selected as samples, and samples were processed as follows: we removed from the samples companies that were lost or had non-consecutive data. The sample must have been listed before 2003, and continuously published the relevant annual financial reports during 2004 to 2012. In the end, we got 2420 samples from 273 listed companies. All the samples are from RESSET Financial Research Database. Excel and SPSS18.0 were used in the treatment of the data for empirical analysis and data validation.
4.1 Target design
1 Corporate Performance ROA
ROA was chosen as a dependent variable to measure the operating performance of listed companies. First of all, ROA is the main indicator in the information disclosure of listed company's annual report, consistent with the calculation caliber and easy access to relevant data. ROA can reflect the comprehensive management level of the company, also reflects the efficiency of the company's total assets.
The following formula was used to measure ROA ROA = NET INCOME ÷ TOTAL ASSET (Equation 1) 2 FCF
Currently for FCF calculations, academia has not yet agreed on a formula. S&P use Kaplan’s formula to calculate FCF, so we are going to use is as well.
FCF = EBIT − TAX + DEPRECIATION&AMORTIZATION − (ACCOUNT RECIVABLE + INVENTROY − ACCOUNT PAYABLE) − CAPITAL EXPENDITURES (Equation 2)
3 CR
CR is mainly used to measure the ability of companies to repay current assets realized short-term debt. It is current assets to current liabilities. CR and liquidity of
21
corporate assets are proportional. Taking into account the liquidity of assets it often significantly affects the company generated free cash flow situation, therefore CR was chosen as a control variable.
4 Operating income growth rate
Taking into account the free cash flow and performance of listed companies affected by the growth of listed companies, increase rate of main business revenue as a measure of the company's growth indicators, which can be used to determine a company's life cycle stage.
5 Accounts receivable turnover ratio
Enterprise accounts receivable arising from providing products and services, without affecting the performance of the enterprise, enterprise need to maximize cash back. Only the timely recovery of the company's accounts receivable, can maximize capital efficiency, prevent companies from a lack of funds in the face of good investment opportunities. It reflects the company's accounts receivable turnover rate ratio, and shows how long it takes, in a certain accounting period, to convert accounts receivable into cash...
6 Cash income ratio
Cash plays an important role in enterprise free cash flow, the ability to withdraw cash from operating income in the business directly affects free cash flow situation, thereby affecting the performance of the company to a certain extent.
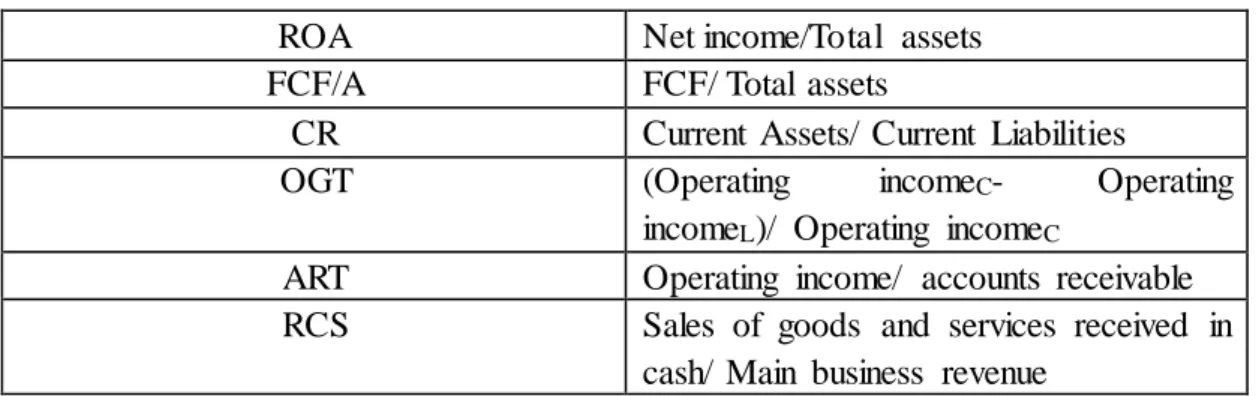
Table 2 Main Indicators
ROA Net income/Total assets
FCF/A FCF/ Total assets
CR Current Assets/ Current Liabilities
OGT (Operating incomeC- Operating
incomeL)/ Operating incomeC
ART Operating income/ accounts receivable RCS Sales of goods and services received in
cash/ Main business revenue
4.2 Regression model
22
Y Shows performance of listed companies (ROA), 𝑉1 shows each variables, i = 1,2,3,4,5, show FCF, CR, OGT, ART, CI, 𝐿𝐼 shows regression coefficients, and 𝜀 represents residual.
5 Empirical Analysis and Results
Descriptive Statistics
First, let the 6 research variables take descriptive statistics as an order from dependent variable, arguments, to control variables.
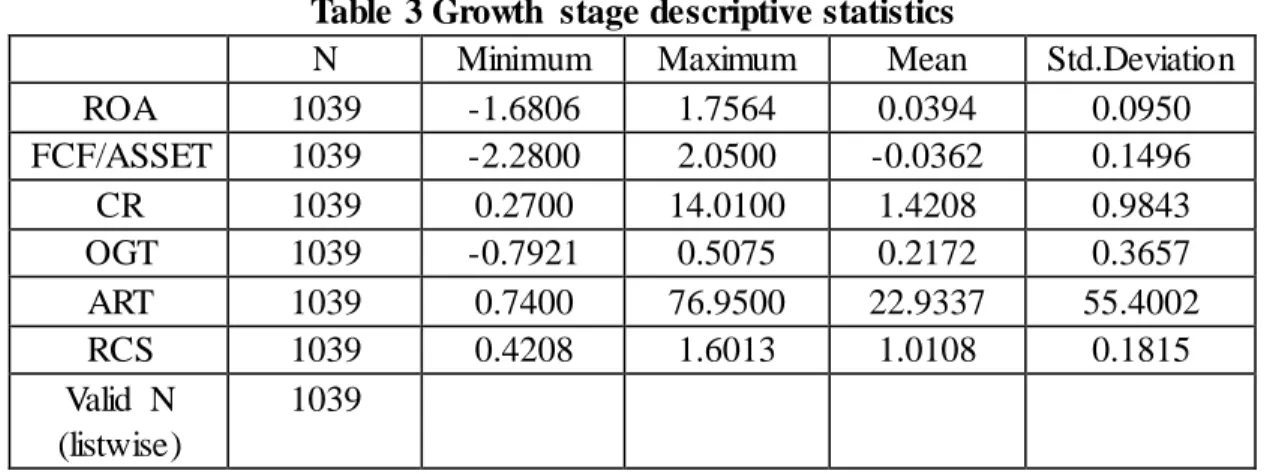
Table 3 Growth stage descriptive statistics
N Minimum Maximum Mean Std.Deviation
ROA 1039 -1.6806 1.7564 0.0394 0.0950 FCF/ASSET 1039 -2.2800 2.0500 -0.0362 0.1496 CR 1039 0.2700 14.0100 1.4208 0.9843 OGT 1039 -0.7921 0.5075 0.2172 0.3657 ART 1039 0.7400 76.9500 22.9337 55.4002 RCS 1039 0.4208 1.6013 1.0108 0.1815 Valid N (listwise) 1039 Source: Author
Table 4 Maturity stage descriptive statistics
N Minimum Maximum Mean Std.Deviation
ROA 1322 -0.3660 0.0477 0.0456 0.0751 FCF/ASSET 1322 -1.4600 0.3900 -0.0377 0.1618 CR 1322 0.1100 26.3000 1.8042 2.0625 OGT 1322 -0.5515 29.7626 0.1924 0.8811 ART 1322 1.0800 106.0800 23.5954 19.3924 RCS 1322 0.2585 1.9723 1.0375 0.1796 Valid N (listwise) 1322 Source: Author Yang Meng
Table 5 Decline stage descriptive statistics
N Minimum Maximum Mean Std.Deviation
ROA 63 -0.3533 0.1776 -0.0114 0.0753
FCF/ASSET 63 -0.6300 0.2100 -0.0346 0.1263
CR 63 0.4700 3.4300 1.5081 0.8186
23 ART 63 2.0000 95.2100 7.3443 16.8942 RCS 63 0.4675 1.7410 0.9951 0.2166 Valid N (listwise) 63 Source: Author Yang Meng
From the tables, we can see that ROA of growth stage is lower than maturity stage, but higher than decline stage. When the company is in decline stage, the average ROA is already negative, showing that company performance follows a trend from rise to decline. The free cash flow ratio is -3.6% in growth stage, indicating that company has a low profit in this period, even negative, and lack of cash flow; in maturity stage, free cash flow ratio rise to 1.77%, indicating that sales and profits grow up stably, cash flow is more abundant; to the decline stage, free cash flow ratio continues to grow up to 3.46%, indicating that even though company transition from maturity to decline stage, profits still remained stable, and cumulative free cash flow is more abundant; free cash flow ratio of the three periods are quite small, because fixed assets have a large proportion of the total assets in manufacturing companies, so they get low level of free cash flow. The changes in current ratio is a parabola from growth to maturity and then decline stage, illustrating with the improvement of the enterprise, expanding the size and the level of sales, companies have the strongest liquidity in maturity stage. From the growth perspective, increase rate of main business revenue in growth stage is significantly higher than maturity and decline stage, and when coming to the decline stage, increase rate of main business revenue has a low drop. Accounts receivable turnover ratio in the three periods are 22.9, 23.6, and 7.3 respectively, Enterprises can withdraw accounts receivable timely in growth and maturity stage, but when come to decline stage, since large backlog of accounts receivable in early time, withdrawing in this period is difficult. RCS is 101.08%, 103.75% and 99.51% respectively, are similar with the trend of ROA. It illustrates the ability to receive cash of a company has a certain relationship with business life cycle stage. So we can say, ROA, ART and RCS have the largest mean in maturity stage, then go down in the decline stage, meet the previous expectations. Because a company experienced the three stage is a parabola, and the highest point is in maturity stage.
24
5.1 Test results and analysis
1 Regression Data in Growth Stage
Table 6 Model Summary
Model R R Square Adjusted R
Square
Std. Error of the Estimate
1 .601a .361 .358 .80153948
a. Predictors: (Constant), Zscore(RCS), Zscore(CR), Zscore(ART), Zscore(OGT), Zscore(FCF/A),
Source: Author Yang Meng
Table 7 ANOVAb Model Sum of Squares df Mean Square F Sig. 1 Regression 374.333 5 74.867 116.530 .000a Residual 663.667 1033 .642 Total 1038.000 1038
a. Predictors: (Constant), Zscore(RCS), Zscore(CR), Zscore(ART), Zscore(OGT), Zscore(FCF/A)
b. Dependent Variable: Zscore(ROA) Source: Author Yang Meng
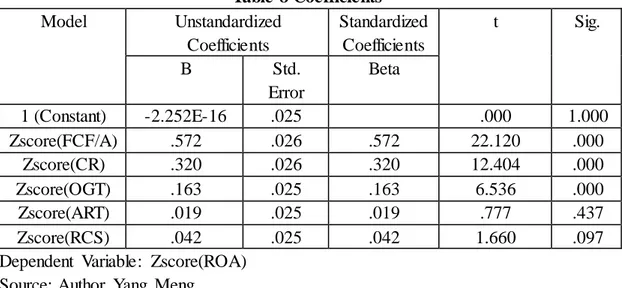
Table 8 Coefficientsa Model Unstandardized Coefficients Standardized Coefficients t Sig. B Std. Error Beta 1 (Constant) -2.252E-16 .025 .000 1.000 Zscore(FCF/A) .572 .026 .572 22.120 .000 Zscore(CR) .320 .026 .320 12.404 .000 Zscore(OGT) .163 .025 .163 6.536 .000 Zscore(ART) .019 .025 .019 .777 .437 Zscore(RCS) .042 .025 .042 1.660 .097
Dependent Variable: Zscore(ROA) Source: Author Yang Meng
From the table above, we can see R square is 0.361, the goodness of fit is not very good. But we still can establish regression model and further analyze variables.
If the F value is greater than F critical value I this model, then the regression result of this model is significant. After test, F value in this model is 116.53, obviously it’s
25
much greater than F critical value F (5, 1038) =1.85. And the correlation coefficients of each variables of the listed companies after under 0.1 significance level test are 0.572, 0.320, 0.163, 0.019, and 0.042 respectively, and the rest Sig value are 0.000, 0.000, 0.000, 0.437, and 0.097, so except the Sig value of Zscore(ART) is above 0.1, the other variables are significant different. So we can say variables FCF/F, CR, OGT, and RCS are significantly correlated with dependent variable ROA, and hypotheses 1 is true.
2 Regression Data in Maturity Stage
Table 9 Model Summary
Model R R Square Adjusted R
Square
Std. Error of the Estimate
1 .462a .213 .210 .88854302
a. Predictors: (Constant), Zscore(RCS), Zscore(CR), Zscore(OGT), Zscore(ART), Zscore(FCF/A),
Source: Author Yang Meng
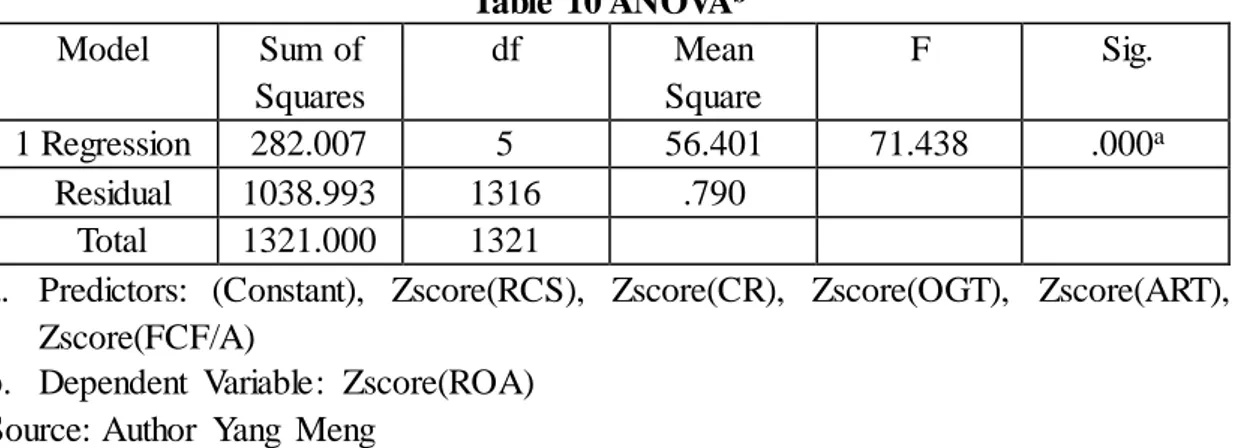
Table 10 ANOVAb Model Sum of Squares df Mean Square F Sig. 1 Regression 282.007 5 56.401 71.438 .000a Residual 1038.993 1316 .790 Total 1321.000 1321
a. Predictors: (Constant), Zscore(RCS), Zscore(CR), Zscore(OGT), Zscore(ART), Zscore(FCF/A)
b. Dependent Variable: Zscore(ROA) Source: Author Yang Meng
Table 11 Coefficientsa Model Unstandardized Coefficients Standardized Coefficients t Sig. B Std. Error Beta 1 (Constant) 3.569E-17 .024 .000 1.000 Zscore(FCF/A) .106 .026 .106 4.133 .000 Zscore(CR) .446 .026 .446 17.421 .000 Zscore(OGT) .104 .024 .104 4.240 .000 Zscore(ART) .131 .025 .131 5.343 .000 Zscore(RCS) .022 .025 .022 .876 .381
Dependent Variable: Zscore(ROA) Source: Author Yang Meng
26
From the table above, we can see R square is 0.213, the goodness of fit is not very good. But we still can establish regression model and further analyze variables.
If the F value is greater than F critical value I this model, then the regression result of this model is significant. After test, F value in this model is 71.438, obviously it’s much greater than F critical value F (5, 1322) =1.89. And the correlation coefficients of each variables of the listed companies after under 0.1 significance level test are -0.106, 0.446, 0.104, 0.131, and 0.022 respectively, and the rest Sig value are 0.000, 0.000, 0.000, 0.000, and 0.381, so except the Sig value of Zscore(RCS) is above 0.1, the other variables are significant different. So we can say variables FCF/F, CR, OGT, and ART are significantly correlated with dependent variable ROA, and hypotheses 2 is true. 3 Regression Data in Decline Stage
Table 12 Model Summary
Model R R Square Adjusted R
Square
Std. Error of the Estimate
1 .448a .201 .131 .93244172
a. Predictors: (Constant), Zscore(RCS), Zscore(OGT), Zscore(FCF/A), Zscore(ART), Zscore(CR),
Source: Author Yang Meng
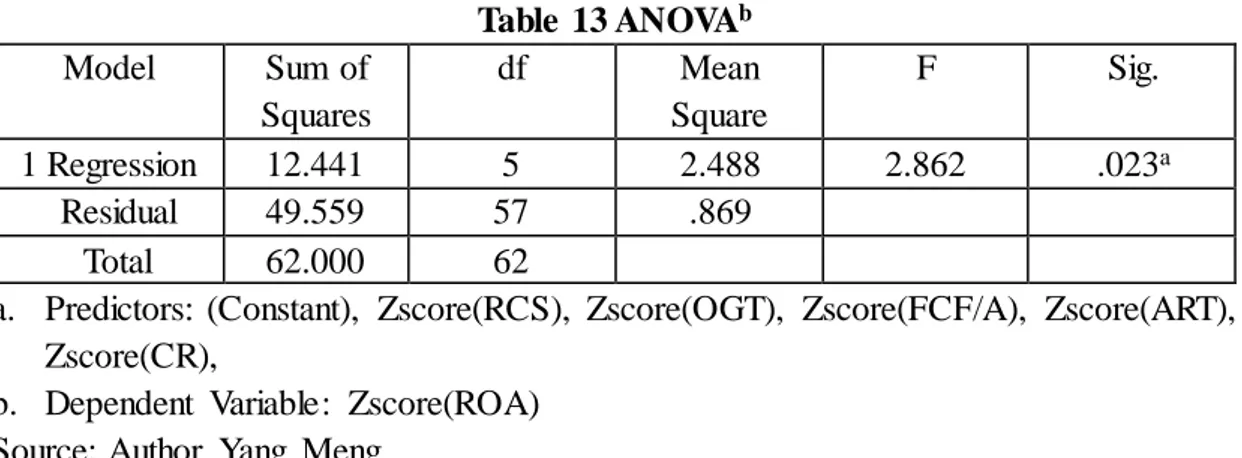
Table 13 ANOVAb Model Sum of Squares df Mean Square F Sig. 1 Regression 12.441 5 2.488 2.862 .023a Residual 49.559 57 .869 Total 62.000 62
a. Predictors: (Constant), Zscore(RCS), Zscore(OGT), Zscore(FCF/A), Zscore(ART), Zscore(CR),
b. Dependent Variable: Zscore(ROA) Source: Author Yang Meng
Table 14 Coefficientsa Model Unstandardized Coefficients Standardized Coefficients t Sig. B Std. Error Beta 1 (Constant) 1.891E-16 .117 .000 1.000 Zscore(FCF/A) -.051 .142 -.051 .358 .022 Zscore(CR) .431 .152 .431 2.838 .006
27
Zscore(OGT) .244 .120 .244 2.037 .046
Zscore(ART) .248 .145 .248 1.711 .093
Zscore(RCS) -.012 .134 -.012 -.087 .931
Dependent Variable: Zscore(ROA) Source: Author Yang Meng
From the table above, we can see R square is 0.201, the goodness of fit is not very good. But we still can establish regression model and further analyze variables.
If the F value is greater than F critical value I this model, then the regression result of this model is significant. After test, F value in this model is 2.862, obviously it’s much greater than F critical value F (5, 63) =1.94. And the correlation coefficients of each variables of the listed companies after under 0.1 significance level test are -0.051, 0.431, 0.244, 0.248, and -0.012 respectively, and the rest Sig value are 0.022, 0.006, 0.046, 0.093, and 0.931, so except the Sig value of Zscore(RCS) is above 0.1, the other variables are significant different. So we can say variables FCF/F, CR, OGT, and ART are significantly correlated with dependent variable ROA, and hypotheses 3 is true.
In growth stage, company can increase profits very soon, expand business scale, products adapt to market demand, sales grow up fast, when faced with good investment opportunities, the amount of free cash flow the company has often affects its long-term development. This thesis uses empirical testing and data analysis proving free cash flow has positive correlation with the company's performance in growth stage.
When an enterprise is in maturity stage, managers when considering their own personal interests use sufficient free cash flow for discretionary spending instead of being allocated to investors which is detrimental to the interests of shareholders. This behavior will lead to an abnormal increase in corporate expense, making assets operational efficiency decrease, and results in the deterioration of the performance of the company. This study uses empirical testing and data analysis proving free cash flow has negative correlation with the company's performance in maturity stage.
Transition from maturity to decline stage, sales go down, but there is still some profit retention, cumulative cash flow is more abundant. At this time, managers will use the cumulative free cash flow for the inefficient new investment projects. This thesis
28
uses empirical testing and data analysis proving free cash flow has negative correlation with the company's performance in decline stage.
6 Conclusion
In this paper, standardized and empirical research method are used, to make a comparative study on the relationship between life cycle, free cash flow and company performance of Chinese listed companies. Through theoretical analysis and empirical test, these conclusions were reached:
1 After researching and browsing literatures about enterprise free cash flow and performance from Chinese and abroad, most of the literature was focused on capital structure, management compensation, and dividend distribution. There are relatively few studies researching on enterprise life cycle. The status of business development affects the company’s performance, so there will be a different performance for each different life cycle stage, so one should focus on the various relationships between the free cash flow of the company in different life cycle stage and company’s performance. So we established a research conducted from the perspective enterprise life cycle to the relationship between enterprise free cash flow and performances.
2 In growth stage, free cash flow has positive correlation with the company's performance; in maturity and decline stage, free cash flow has negative correlation with the company's performance. When enterprises stay in growth stage, their size increases, the profitability of the business is growing, long-term assets of enterprises need greater input at this time, but the profits of the enterprises are far unable to meet the demand of enterprises for funds. Otherwise in maturity and decline stage, enterprises have more abundant cash, by the common phenomenon “weaker shareholders, stronger managers”, operating efficiency of enterprises will reduce due to agency costs of free cash flow.
3 No business can get rid of its life-cycle, what company managers can do is try to extend the corporate life cycle, different measures according to different issues faced by businesses at each stages, especially in decline stage, but attention must be kept on
29
excessive investment. In order to achieve the transformation of the life cycle, company managers should use free cash flow to build a new organizational system, or enterprises will enter the irreparable death phase.
4 Financial measurable indicators at different stages of the corporate life cycle will be different due to the characteristics of the different stages, and the importance of financial performance measurement indicators will change with the enterprise life cycle. In growth stage, managers should use limited cash flow wisely, strengthen investment management, and pay more attention to sales margin, return on investment, sales growth and other performance indicators; in maturity and decline stage, focus on net operating cash flow, net profit and other financial performance indicators, maximize withdraw cash. So, managers should act based upon the stage of the life cycle the enterprise is in, accordingly, selecting financial performance measurements that are better suited to their current actual situation.