Post-Graduate Program of Social, Work, and Organizational Psychology – PSTO
Ph.D. Dissertation
Beyond Psychometric Assumptions:
How to Develop New Psychological Measures
Para Além de Pressupostos Psicométricos:
Como Desenvolver Novas Medidas Psicológicas
Víthor Rosa Franco
Beyond Psychometric Assumptions:
How to Develop New Psychological Measures
Para Além de Pressupostos Psicométricos:
Como Desenvolver Novas Medidas Psicológicas
Víthor Rosa Franco
Doctoral dissertation elaborated under the supervision of Prof. Ph.D. Jacob Arie Laros, and presented to the Post-Graduate Program of Social, Work, and Organizational Psychology of the University of Brasília, as partial requirement for the degree of Doctor in Social, Work, and Organizational Psychology.
Supervisor: Prof. Ph.D. Jacob Arie Laros
Examining Committee:
Prof. Ph.D. Felipe Valentini
Programa de Pós-Graduação em Psicologia Universidade São Francisco - USF
Membro externo à UnB
Prof. Ph.D. Ricardo José de Moura
Programa de Pós-graduação em Ciências do Comportamento Universidade de Brasília - UnB
Membro externo ao PSTO
Prof. Ph.D. Josemberg Moura de Andrade
Programa de Pós-Graduação em Psicologia Social, do Trabalho e das Organizações Universidade de Brasília - UnB
Membro interno ao PSTO
Prof. Ph.D. Elaine Rabelo Neiva
Programa de Pós-Graduação em Psicologia Social, do Trabalho e das Organizações Universidade de Brasília - UnB
Dedicatory
Oh, life is good... As good as you wish!
“For me, it is far better to grasp the Universe as it really is than to persist in delusion, however satisfying and reassuring.” Carl Sagan
“Give a boy a hammer and chisel; show him how to use them; at once he begins to hack the
doorposts, to take off the corners of shutter and window frames, until you teach him a better use for them, and how to keep his activity within bounds.”
Acknowledgements
I thank my family for all the support and personal sacrifice they made so that I could
get here. Starting with my grandparents—Teó, Arino, Cecilia, and Hélio—and my parents—
Cynthia da Silva Rosa, and Hélio José Franco Júnior—; I am so grateful that they always
reinforced my nerdy side and taught me to love to study. Thanks also to my siblings—Lázaro
Rosa Franco, Sofia Maria Rosa Franco, and Thomas Rosa Franco—for being nerds and the
best friends of all time. I also thank all of my extended family—cousins, uncles, aunts—for
always supporting me in all my decisions. I love you all.
I thank my supervisor Jacob Arie Laros for accepting to accompany me on this
endeavor. From the first request, not even sure which topic I would like to study, to the
last-minute decisions, remote supervisions and supervisions on weekends. Laros is a great
advisor, teacher, and person, and I believe all of his support was instrumental in getting the
job done in the quality it did. I also thank the examining committee—Elaine Rabelo Neiva,
Felipe Valentini, Josemberg Moura de Andrade, and Ricardo José de Moura—for agreeing to
participate in this moment and for all the fundamental contributions.
I also thank the professors/teachers Antonio Abreu, Antonio Pedro Mello,
Bartholomeu Tôrres Tróccoli, Carla Antloga, Cristiane Faiad, Dida Mendes, Edna Akemi
Ueda, Gerson Américo Janczura, Hudson Golino, Jorge Mendes, Luciano Grüdtner Buratto,
Ricardo Primi, Timothy Mulholland, Wanessa Loureiro, and Zorg Ribeiro da Costa. They are
all excellent masters and have always reinforced in me the desire to pursue academic life and
to be increasingly nerdy, hoping one day to be as capable (and nerdy) as all of them. In
particular I would also like to thank professor Fabio Iglesias. I started my history in science
under his guidance, and the history follows with your partnership and personal friendship,
To my colleagues from laboratory, course or profession Ana Luiza Marinho, André
Paiva, André Rabelo, Angelica Oliveira, Beatriz Cavendish, Camila Gastal, Carlos Manoel,
Daniel Barbieri, Douglas Piasson, Elena Pinheiro, Elis Ramos, Elis Martins, Filipe Lima,
Filipe Gabriela Campelo, Gabriela Macedo, Gabriela Ribeiro, Giordana Bruna, Hannah
Hämmer, Isangelo Souza, Izabella Melo, Jazon Torres, Jessica Farias, Jessica Riechelmann,
João Modesto, Jonathan Jones, Julia Gisler, Laura Andrade, Letícia Ferreira, Lorena
Andreoli, Luana Veiga, Lucas Heiki, Lude Marieta, Luiz Victorino, Marcos Pimenta, Marcos
Lima, Mariana Santos, Marina Caricatti, Martina Mazzoleni, Mauricio Sarmet, Raiane Nunes
Nogueira, Patrícia Santos, Paula Gabriela, Raquel Hoersting, Raquel Loewenhaupt, Renan
Benigno, Stela de Lemos, Teresa Clara, Tiago França, Vitória Lima, and Victor de Souza.
Thank you for all the discussions, teachings and mutual support.
To the friends I met someplace in life Adler Adriel, Adrielli Nazario, Alexandre
Barba Ruiva, Amanda do Couto, Anna Thais, Britt Bayesian Jane, Diach Selch, Diux Ronan,
Erick di Serio, Fernando Alexandre, Filipe Cardoso, Frederico Bicalho, Gabriel Mosna,
Henrique Simas, Hugo Sousa, João Roberto, Juliana Simas, Maitê Assis, Marcella Pantarotto,
Mari Junqueira, Mari Sá, Naty Sá, Paula Souza, Paulo Victor, Pp Martins, Rafael Marks,
Raquel Simas, Raul Marques, Sarah Goulart, Stefano Mosna, Talitha Pumar, Thais Staudt,
Thiago Fernando, Thiago Pereira, Vitor Guimarães, and Victor Keller. Thank you for all the
hours of laughter and happiness that come with me. Also, many of you are nerds too. Special
thanks to Alexandre Gomide, Guilherme Gonçalves and Isabela Lima; they know why.
Till alla vänner jag träffade från Sverige Anders Lundquist, Angel Angelov, Anita
Lindmark, David Källberg, Emma Persson, Flavia Raschini, Gabriel Wallin (extra tack för
den svenska fixen!), Guilherme Barros, Ingeborg Waernbaum, Ingela Klinga, Jenny
Häggström, Jessica Fahlen, Johan Svensson, Kadri Meister, Katarina Kempe, Kreske Ecker,
Moosavi, Pär “Rossi” Sehlström, Pryiantha Wijayatunga, Sajad Mortazavi, Sandra Behren,
Simone Mellquist, Svante Klinga Tanya Gorbach, och Xavier de Luna. Tack så mycket för
att ni hjälpte mig att anpassa mig så enkelt till detta underbara land och fick mig att känna
mig som hemma från början. Särskilt tack till Leo Nazar för hans så stora hjärta som bara
förlorar till hans stora nördhjärna. Från att hjälpa till att hantera ångesten av att vara på en ny
plats, till att hjälpa med att hitta i staden, busskort, kasta bort tiden på fredag eller helgen,
kort sagt, genom din mycket speciella vänskap. Särskilt tack till mina goda vänner Anastasia
Potehina, Daria Nikitina, David Kvist och Yulia Ryanova. Torsdagskvällar har inte varit så
bullriga utan er, jag saknar det. Ett särskilt tack också till professor Marie Eriksson för allt
stöd, arbete och personligt, för de snabba sex månaderna jag var på din underbara enhet. Ett
extra speciellt tack till min andra handledare Marie Wiberg. Inte bara hjälpte du mig att
förverkliga en dröm, utan det var också viktigt för mig att få det här jobbet gjort. Slutligen,
framför allt, tack vare denna erfarenhet, ändrade jag fullständigt min åsikt om hur det
akademiska livet kan vara, på ett mycket positivt sätt. Tack så mycket.
To my beautiful friends Aline Fernandes, Juliana Almeida, Ligia Abreu, Lucas
Caldas, and Raissa Damasceno. For all the hours of support, lunch, dinner, fun, crying,
smiling, studying, and chatting away; none of this can be represented in any kind of currency
but the currency of love and friendship. Special thanks to my lab friend Talita Alves. Her
strength to overcome all her difficulties is extremely inspiring; you help me to be better!
Finally, Gabriela Yukari Iwama. Three years that feel like forever. We’ve spent much of the last year apart from each other, but I couldn’t feel closer to you than I feel now. I am so
happy for everything you accomplished and I am very happy you are here with me in this
accomplishment of mine. You are so amazing; you do so many things that can only make me
think that I am the luckiest person in the world. I hope we share many more adventures, many
Summary Page Dedicatory……… 3 Acknowledgments……… 4 List of tables………. 9 List of figures………... 10 List of abbreviations………... 11 General abstract………... 13 Resumo geral……….... 14 Presentation... 15 References………... 17
How to think straight about psychometrics: Measurement theories and practice in psychology………... 19
Introduction... 20
Qualitative and quantitative thinking in psychology………. 21
Psychometrics and its three assumptions………... 24
Structural validity assumption and Nonparametric Item Response Modeling………….. 28
Process assumption and Cognitive Psychometric Modeling………... 33
Construct assumption, network modeling, and realist measurement theory………. 37
Discussion………... 44
References………... 47
Conditional item response model and optimal scores: Alternatives to the Rasch model…... 55
Introduction... 56
The binomial scoring procedure... 57
Bounded support and the Conditional Item Response Model……… 59
Fitting the CIRM and the OS-IRM………. 61
Simulation study... 63 Method... 63 Results... 65 Empirical example... 69 Results... 71 Discussion... 73 References………... 76
An operationalization of Lewin’s Equation: The situational optimization function analysis…... 81
Introduction... 82
Assessing dispositions with Stochastic Frontier Analysis….……… 85
Fitting an SFA model……….……… 87
Construct validity by joint modeling………..……… 90
Simulation study... 92 Method... 92 Results... 93 Empirical example... 95 Method... 96 Results... 98 Discussion... 99 References………... 102
A structure learning procedure for power chain graphs…... 108
Introduction... 109
Probabilistic graph theory, PGs and CGs………... 110
Power chain graphs (PCGs)………... 114
Benchmarks for the clustering procedure………... 117
Causal discovery: Theory and CG tuning……….. 119
Simulation study... 122
Method... 122
Results 1: Comparison between clustering procedures... 125
Results 2: Comparison between structure learning algorithms... 128
Empirical example... 130 Method... 130 Results... 132 Discussion... 135 References………... 138 Final considerations... 143 References………... 145
List of Tables
Study Table Page
Conditional item response model and optimal scores: Alternatives to the Rasch
model
Table 1. Comparing accuracy, similarity with the true score distribution, and model fit of the three models (Rasch, CIRM and OS-IRM) for data generated by the Rasch model.
66
Table 2. Comparing accuracy, similarity with the true score distribution, and model fit of the three models (Rasch, CIRM and OS-IRM) for data generated by the CIRM.
67
Table 3. Comparing accuracy, similarity with the true score distribution, and model fit of the three models (Rasch, CIRM and OS-IRM) for the average of data generated by both models.
69
Table 4. Distributional properties of the estimated scores in terms of distance to a normal distribution (d) and difference from the sum score’s distribution (ISE).
71
An operationalization of Lewin’s Equation: The situational optimization
function analysis
Table 1. Overall performances of each method, measured by
Spearman correlations, MAE and RMSE. 94
Table 2. Performances of each method, measured by Spearman
correlations, MAE and RMSE, compared by sample size. 94 Table 3. Performances of each method, measured by Spearman
correlations, MAE and RMSE, compared by DGP. 95 Table 4. Different procedures for estimating construct validity. 98 A structure learning procedure
for power chain graphs Table 1. Performance comparison between different DGPs. 126 Table 2. Performance comparison between different sample
sizes. 127
Table 3. Performance comparison between different cluster
sizes. 127
Table 4. Performance of the PC-stable algorithm applied to
learning the power arrows of the PCG. 128
Table 5. Sparsity comparison between tuning algorithms. 129 Table 6. Description of the items of an instrument on empathy
List of Figures
Study Figure Page
How to think straight about psychometrics: Measurement theories and
practice in psychology
Figure 1. Four possible models for decaying rate in memory tasks.
24 Figure 2. Depictions of logistic functions. 30 Figure 3. Depictions of valid functions IRFs in a NIRM
perspective. 31
Figure 4. Two hypothetical competing TIRMs for the
measurement of personality data related to observed behavior. 36 Figure 5. Graphical illustrative example of the traditional (left),
second-order (middle), and bifactor (right) models of intelligence.
40
Figure 6. Illustrative example on how weighted utilities are
calculated from cumulative prospect theory. 44 Conditional item response
model and optimal scores: Alternatives to the Rasch
model
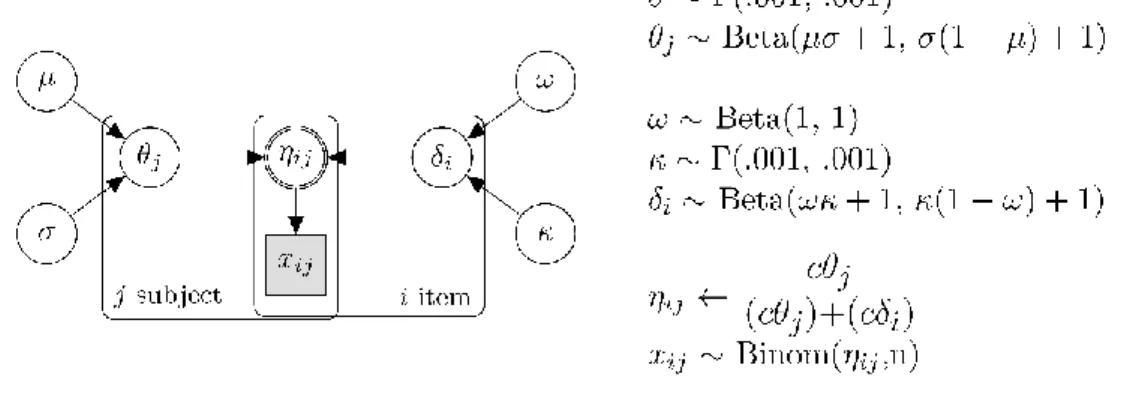
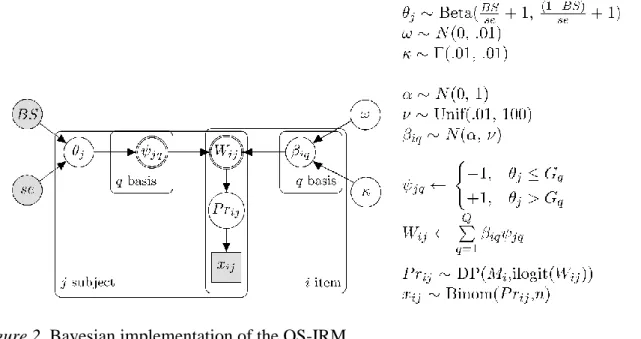
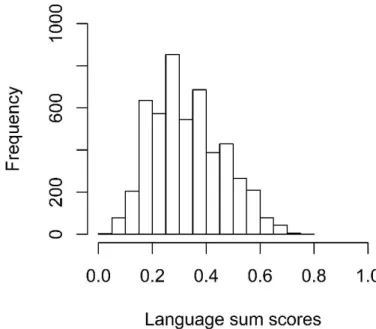
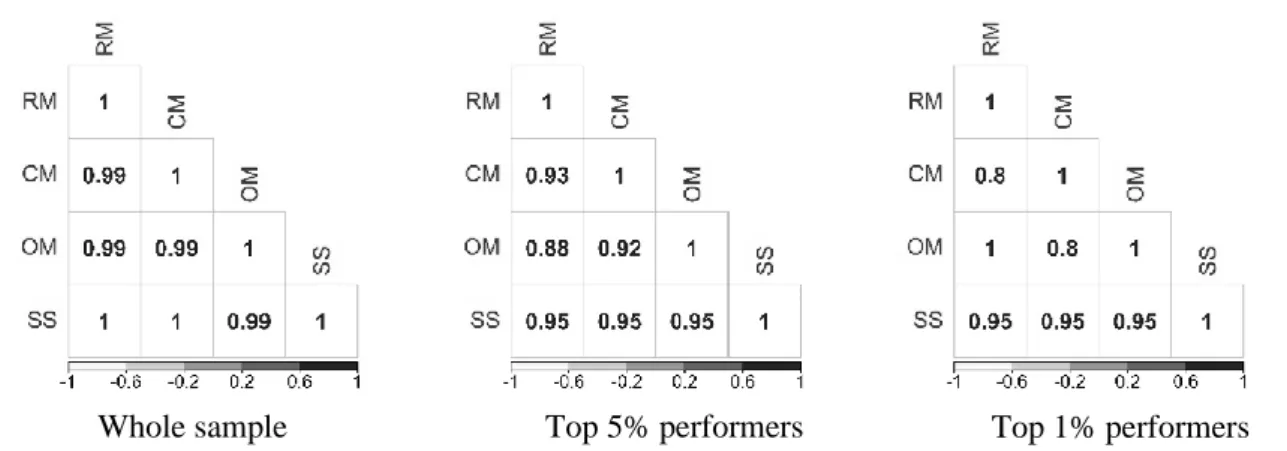
Figure 1. Bayesian representation of the CIRM. 62 Figure 2. Bayesian implementation of the OS-IRM. 63 Figure 3. The distribution of the sum scores of ENEM’s
languages subtest. 70
Figure 4. Densities of the estimated scores. 72 Figure 5. Correlation between scores given the whole sample,
the top 1% and the top 5% performers. 73
An operationalization of Lewin’s equation: The situational optimization
function analysis
Figure 1. Representation of the fundamental problem. 84 Figure 2. Representation of the SOFA framework. 85 Figure 3. Two step approach for estimating semiparametric SFA
models. 88
Figure 4. Bayesian implementation of a situational optimization
function analysis (SOFA). 89
Figure 5. DGPs’ functions used for testing the models’
performance. 92
A structure learning procedure for power chain graphs
Figure 1. An example of a power graph. 110
Figure 2. A CG (top) and three different DAGs that have
different factorizations. 112
Figure 3. Comparison between dependencies represented with
PG, CG and PCG. 113
Figure 4. An example of PCG (to the left) and the CG (to the right) implied by it, with different colors for nodes representing different clusters.
114 Figure 5. Three fundamental connections between three
variables. 120
Figure 6. DGPs of the PCGs in the present study. 124 Figure 7. CGMM’s (on the left) and EGA’s (on the right)
clustering solution, with different numbers and associated colors representing different clusters.
132 Figure 8. PCGs estimated with the PC-stable algorithm using
CGMM’s (on the left) and EGA’s (on the right) averaged correlation matrix.
133 Figure 9. The original CG implied by the estimated PCG
(top-left), a CG tuned by the PC-stable algorithm (top-right), a CG tuned by the HC algorithm (bottom-left) and a CG tuned by the MMHC algorithm (bottom-right).
List of Abbreviations
(in alphabetic order) 1PLM/1PL One-Parameter Logistic Model
2PLM Two-Parameter Logistic Model
Acc Accuracy
AIC Akaike Information Criterion
Bayesian-SOFA Bayesian implementation of a SOFA model BIC Bayesian Information Criterion
CDF Cumulative Density Function
CFT Common Factor Theory
CG Chain Graph
CGMM Correlation Gaussian Mixture Model CIRM/CM Conditional Item Response Model
CMT Conjoint Measurement Theory
Coop-Comp scale Cooperation and Competition attitudes’ scale
CPM Cognitive Psychometric Modeling
CTT Classical Test Theory
DAG Directed Acyclic Graph
DGP Data Generating Process
DIC Deviance Information Criterion
DP Dirichlet Process
EAP Expected a Posteriori
EBIC Extended BIC
EFA Exploratory Factor Analysis
EGA Exploratory Graph Analysis
ENEM Exame Nacional do Ensino Médio
GAM Generalized Additive Models
GAM-SFA GAM regression model of SFA
GARI Graph Adjusted Rand Index
GES Greedy Equivalence Search algorithm
HC Hill-Climbing algorithm
HitND Percentage of hits of the number of dimensions
IRM Item Response Model
IRT Item Response Theory
ISE Integrated Squared Error
Kernel-SFA Kernel smooth regression model of SFA
LASSO Least Absolute Shrinkage and Selection Operator Loess-SFA Locally estimated scatterplot smoothing model of SFA
LR Likelihood Ratio
LVT Latent Variable Theory
MAE Mean Absolute Error
MCMC Markov Chain Monte Carlo
MLE Maximum Likelihood estimation
MMHC Min-Max Hill-Climbing algorithm
MSA Mokken Scale Analysis
NIRM Nonparametric Item Response Model
NMI Normalized Mutual Information
OS-IRM/OM Optimal-score procedure
PA Parallel Analysis
PA-EFA Combined model using PA and EFA
PCG Power Chain Graph
PG Power Graph
PPV Positive Predictive Value
RM Rasch model
RMSE Root-Mean Squared Error
SEM Structural Equation Model
SFA Stochastic Frontier Analysis
SOFA Situational Optimization Function Analysis
SS Sum Scores
TIRM Tree-Based Item Response Model
TNR True Negative Rate
TPR True Positive Rate
UG Undirected Graph
GENERAL ABSTRACT
What defines a good measurement? In the present dissertation we argue, and show, that defining a good measurement can be much more complex than simply performing a factor analysis or an analysis using item response theory. The overall objective of this dissertation is to present three principal assumptions of psychometric measurement, and to develop alternatives for traditional psychological measurement. The dissertation is divided in four studies. The first one is a theoretical study in which three central assumptions common to psychometric theory and psychometric practice are presented, and in which is shown how alternatives to traditional psychometric approaches can be used to improve psychological measurement. These alternatives were developed by adapting each of these three assumptions: (1) the assumption of structural validity; (2) the process assumption; and, (3) the construct assumption. The structural validity assumption relates to the implementation of mathematical models. The process assumption implies that a specific underlying process is generating the observed data. The construct assumption infers that the observed data on its own do not constitute a measurement, but the measure are the latent variables that originate the observed data. Several examples of already existing alternative psychometric approaches are presented in the first study. The second study relates to the structural validity assumption and aimed to develop two new item response models for polytomous and binary items that do not assume a normal distribution of the true scores. The first model that was developed, the Conditional Item Response Model (CIRM), assumes a beta-binomial distribution. The second new model is a Bayesian implementation of the optimal score procedure (OS-IRM). Both new models were compared with the traditional Rasch model: the results indicate that the two developed models improve various aspects of the Rasch model. The third study was derived from the process assumption and had three objectives. First, to develop a Bayesian implementation of the situational optimization function analysis (SOFA) framework. Second, to compare this Bayesian implementation of SOFA with three other Maximum Likelihood-based models that are used to estimate true scores. The third objective was to show how joint modeling can be used for validity research. One of the main advantages of the SOFA framework compared to the traditional psychometric approach is that SOFA relies on experimental data, improving the validity of the measures. The fourth and final study was derived from the construct assumption and its main objective was to develop a procedure of structure learning of power chain graphs (PCGs). A PCG is a type of graph that represents causal relations between groups of variables. It can be thought as a full exploratory version of structural equation modeling, as well as a psychometric model that is not dependent on latent variables. These four studies intend to show that psychometric modeling should not be restricted to the use of traditional measurement models, but should also consider adapting these traditional models in accordance with the intended use and theoretical processes that originate the observed measures.
Keywords: psychometrics; quantitative modeling; formal theorizing; Bayesian modeling;
RESUMO GERAL
O que define uma boa medida? Na presente tese, argumentamos e mostramos que definir uma boa medida pode ser muito mais complexo do que simplesmente executar uma análise fatorial ou uma análise usando a teoria da resposta ao item. O objetivo geral desta dissertação é apresentar três principais pressupostos da medida psicométrica e desenvolver alternativas para a medida psicológica tradicional. A tese está dividida em quatro estudos. O primeiro é um estudo teórico no qual são apresentados três pressupostos centrais comuns à teoria psicométrica e à prática psicométrica, e no qual é mostrado como alternativas às abordagens psicométricas tradicionais podem ser usadas para melhorar a medição psicológica. Essas alternativas foram desenvolvidas adaptando cada um desses três pressupostos: (1) o pressuposto de validade estrutural; (2) o pressuposto do processo; e (3) o pressuposto de construto. O pressuposto de validade estrutural refere-se à implementação de modelos matemáticos. O pressuposto de processo implica que um processo subjacente específico está gerando os dados observados. O pressuposto de construto infere que os dados observados por si só não constituem uma medida, mas que as medidas são as variáveis latentes que originam os dados observados. Vários exemplos de abordagens psicométricas alternativas já existentes são apresentados no primeiro estudo. O segundo estudo se refere ao pressuposto de validade estrutural e teve como objetivo desenvolver dois novos modelos de resposta aos itens para itens politômicos e binários que não assumem uma distribuição normal dos escores verdadeiros. O primeiro modelo desenvolvido, o Modelo de resposta ao item condicional (CIRM), assume uma distribuição beta-binomial. O segundo novo modelo é uma implementação Bayesiana do procedimento de escore ótimo (OS-IRM). Ambos os novos modelos foram comparados com o modelo tradicional de Rasch: os resultados indicam que os dois modelos desenvolvidos melhoram vários aspectos do modelo de Rasch. O terceiro estudo foi derivado do pressuposto do processo e tinha três objetivos. Primeiro, desenvolver uma implementação Bayesiana do framework de análise da função de otimização situacional (SOFA). Segundo, comparar essa implementação Bayesiana do SOFA com outros três modelos baseados em Máxima Verossimilhança, usados para estimar escores verdadeiros. O terceiro objetivo foi mostrar como a modelagem conjunta pode ser usada para pesquisas de validade. Uma das principais vantagens do framework SOFA em comparação com a abordagem psicométrica tradicional é que o SOFA depende de dados experimentais, melhorando a validade das medidas. O quarto e último estudo foi derivado do pressuposto de construto e seu principal objetivo era desenvolver um procedimento de aprendizado de estrutura de gráficos de cadeia de potência (PCGs). Um PCG é um tipo de gráfico que representa relações causais entre grupos de variáveis. Pode ser pensado como uma versão exploratória completa da modelagem de equações estruturais, bem como um modelo psicométrico que não depende de variáveis latentes. Esses quatro estudos pretendem mostrar que a modelagem psicométrica não deve se restringir ao uso de modelos tradicionais de mensuração, mas também deve considerar a adaptação desses modelos tradicionais de acordo com o uso pretendido e os processos teóricos que originam as medidas observadas.
Palavras-chave: psicometria; modelagem quantitativa; teorização formal; modelagem
PRESENTATION
What does it mean to measure something? In this dissertation central aspects related
to traditional psychometric practices, such as Factor Analysis and Item Response Theory are
discussed and alternatives for these traditional practices are proposed. In this context, it is
necessary to understand first which changes can be realized in psychometrics to differentiate
it substantially from what is usually already done by researchers and by people who depend
on psychometric tools for their work. Therefore, the overall aim of this dissertation is to
present the assumptions of contemporary psychometrics and to show how models derived
from these assumptions can be modified in order to develop meaningful measurement in
psychology (Sijtsma, 2012).
It is necessary to emphasize that the use of psychological measurement tools
developed in this dissertation is not intended to be the default practice in psychometrics. On
the contrary, the new developed models are intended to inspire other psychometricians and
researchers to seek new tools that may better suit their specific contexts. However, whether
such tools are appropriate to the context depends, obviously, on empirical evidence of
adequacy. Although psychometrics forms the foundation for a large amount of psychological
studies, especially those using tests and scales, is considered as one of the areas that spread
various misconceptions (Flake & Fried, 2019). This is not necessarily due to lack of ethical
principles, but principally related to the complexity of the topics covered in the psychology
area as a whole and the small number of psychometric models used in these studies.
In the psychometric literature, the difficulty and mathematical complexity of
theoretical models are sometimes presented as the main factors of misuses of psychometric
techniques (Borsboom, 2006). On the other hand, it is the responsibility of the writer to seek
clearer ways of conveying the proposed message, as it is critical that the targeted audience
methodological papers, a more accessible writing approach was used in all four studies of this
dissertation.
The dissertation consists of four manuscripts, one of them being theoretical and the
other three empirical/methodological. The first manuscript is a theoretical study in which
theoretical issues inherent to psychometrics and the concept of measurement are discussed.
The objectives of this first manuscript were: (1) to present and discuss three basic
assumptions in psychometric literature, and (2) develop new measurement models in
psychology by adapting these assumptions. In the second manuscript, the Conditional Item
Response Model is proposed, along with a Bayesian implementation of optimal scores
(Ramsay & Wiberg, 2017), as alternatives for the traditional Rasch model. In the third
manuscript, an analytical and methodological framework for measuring dispositions with
experimental data, named situational optimization function analysis, is presented and tested
with simulated and empirical data. In the fourth manuscript, an extension of power graphs
(Royer, Reimann, Andreopoulos, & Schroeder, 2008), which we called power chain graphs,
is presented as an alternative to structural equation modeling, and other psychometric models,
when causal relations between groups of variables are to be estimated. The final
considerations section outlines research agendas based on the three empirical studies, as well
References
Borsboom, D. (2006). The attack of the psychometricians. Psychometrika, 71(3), 425-470. Flake, J. K., & Fried, E. I. (2019). Measurement schmeasurement: Questionable
measurement practices and how to avoid them. Retrieved from https://doi.org/10.31234/osf.io/hs7wm
Ramsay, J. O., & Wiberg, M. (2017). A strategy for replacing sum scoring. Journal of Educational and Behavioral Statistics, 42(3), 282-307.
Royer, L., Reimann, M., Andreopoulos, B., & Schroeder, M. (2008). Unraveling protein networks with power graph analysis. PLoS Computational Biology, 4(7), 1-17. Sijtsma, K. (2012). Psychological measurement between physics and statistics. Theory &
Psychology, 22(6), 786-809.
Silvia, P. J. (2007). How to write a lot: A practical guide to productive academic writing. New York: American Psychological Association.
How to Think Straight About Psychometrics: Measurement Theories and Practice in Psychology
Vithor Rosa Franco1, Jacob Arie Laros1 and Marie Wiberg2
Affiliations
1Post-graduate program of Social, Work and Organizational Psychology, Institute of
Psychology, University of Brasília, Brasília, Brazil;
2Department of Statistics, Umeå School of Business, Economics and Statistics, Umeå
University, Umeå, Sweden;
Abstract
The aim of the current study is to present three assumptions common to psychometric theory
and psychometric practice, and to show how alternatives to traditional psychometrical
approaches can be used to improve psychological measurement. These alternatives are
developed by adapting each of these three assumptions. The assumption of structural validity
relates to the implementation of mathematical models. The process assumption which is
underlying process generates the observed data. The construct assumption implies that the
observed data on its own do not constitute a measurement, but the latent variable that
originates the observed data. Nonparametric item response modeling and cognitive
psychometric modeling are presented as alternatives for relaxing the first two assumptions,
respectively. Network psychometrics and measurement theory are alternatives for relaxing
the third assumption. Final remarks sum up the most important conclusions of the study.
Keywords: Psychological measurement; item response theory; measurement theory; network
How to Think Straight About Psychometrics: Measurement Theories and Practice in Psychology
Is it possible to measure psychological entities? This question, albeit less troublesome for
most current psychology researchers (Borsboom, 2005; Stanovich, 2012) were a main
concern for scientists in the beginning of the XXth century. Campbell (1928) and others argued bluntly that psychological entities cannot be properly concatenated. Therefore,
measurement in psychology must be impossible and scientific psychology as well. This, of
course, was not well received by most psychologists at the time (Hull, 1943). One of the most influential theories from this period was Stevens’ (1946) operational view on measurement.
This theory popularized the measurement levels, which allowed psychologists to define their
variables as a different type of measures than those from hard sciences.
An older field, known as psychometrics, was being developed since the beginning of
the same century (Jones & Thissen, 2006). From the classical test theory to the item response
theory, several models to measure psychological constructs were developed (van der Linden
& Hambleton, 2013), allowing for measurement instruments to be constructed as well (Furr,
2011). This development was not without controversy. Trendler (2009), for instance, says
that measurement in psychology, as defined by psychometric theory, is not scientific. Michell
(1997) agrees in some degree, stating that psychometrical methods do not allow for true
quantitative measures to be attained. A more balanced view is sustained by Sijtsma (2012),
who affirms that the two measurement approaches proposed to psychology—the statistical
(i.e., the psychometrical approach) and the physical (i.e., measurement theory)—can be
useful. However, they are usually not as useful as they could be, as they disregard meaningful
psychological theory.
The aim of the current study is to present three assumptions common to psychometric
present how alternatives to traditional psychometrical approaches can be used to improve
measurement in psychology. The rest of this paper is structured as follows. In the next
section, we explain how quantitative and qualitative reasoning impacts theorizing in
psychology, originating the latent framework in psychometrics. We then present the latent
framework as the basis for the three most popular theories in psychometrics and list the three
assumptions regarding these theories. The next three sections discuss each of the three
assumptions, presenting how research in psychological measurement can better explore each
of these assumptions. The paper ends with a number of concluding remarks.
Quantitative and qualitative thinking in psychology
To assure a scientific status, researchers in the field of psychology have preferred to use
quantitative practices for data analysis (Mertens, 2014). This happened because, in the
beginning of the XXth century, to be considered a science, any field of study should rely on
mathematics and formal logic (Price, 1986). Nevertheless, the theorization in psychology is
still, and increasingly (Myung & Pitt, 2001; Towsend, 2008), done on basis of natural
language, meaning that relations between variables are not objectively defined. This, on
itself, is not a problem, given that qualitative thinking can be beneficial for science.
Nevertheless, methods and theorization should suit the research question, not the other way
around.
In methodological textbooks for undergraduate and graduate students (e.g.,
Shaughnessy, Zechmeister, & Zechmeister, 2014), much is said about how methods and data
analysis should properly be selected to answer each type of research question. For instance,
Kish (2004) proposes that every research can be of one—or a combination of—design
category: realistic; representative; and randomized. Realistic research designs are those
techniques and are meant, mainly, to be of a descriptive nature. Representative research
designs should be used when one wants to know if a characteristic is generalizable to a
population, as in survey research. Finally, randomization designs are, basically, experiments: “randomization” is used to express the random group assignment and are defined as the type
of design that should be used to infer causal relations.
Despite all the different types of methodological designs that exist, they only help to
answer an already posed research question. The problem for the development of
psychological science is, therefore, not only dependent on the research design, but also on
how the research question was posed (Shaughnessy et al, 2014). This is a considerably less
discussed topic in scientific psychological literature. Most textbooks and tutorial papers will
focus mainly on where research questions come from, rather than the procedures used to
derive them (e.g., Sandberg & Alvesson, 2011). For instance, Shaughnessy et al (2014)
suggests there are two important sources for scientific theorization: past research or our
personal experiences. Provided that both are further and critically evaluated, using a proper
method, they are valid sources for theorizing. However, this does not answer the question of
what theorizing is and how to properly do it. For instance, given a prior scientific result, how
does one create new hypotheses or proposes modifications to a given theory?
Theorizing is certainly not an effortless endeavor (Thabane, Thomas, Ye, & Paul,
2009), and also defining what is proper theorizing is not a straight forward effort.
Nevertheless, some authors propose some alternatives. As in many things in science, there is
no unique way for theorizing, but it can be categorized in, at least, two types, depending on
the amount of formalization used to describe the phenomena of interest (Myung & Pitt,
2001). Formalization is used here to define the use of mathematical, logical or any objective
language (Shoenfield, 2018) in contrast to the natural language, such as English, Portuguese,
theorizing, which is also the most common in psychology and other sciences (Townsend,
2008), is the natural language theorization. As the name suggests, this type of theorization is
done by simply stating, in natural language, what, how and why empirical data is how it is. It
also involves a lot of rationalization over past empirical results. A simple example can be
given by the theory of cognitive dissonance, classically defined as the mental discomfort
experienced by a person who simultaneously holds two or more contradictory beliefs, ideas,
or values (Festinger, 1962). This definition, despite being clear and meaningful for most
individuals who understand the English language, does not explain, for instance, how mental
discomfort is caused by holding contradictory beliefs. Most psychological theories and
hypothesis have this format. They vaguely state some expected relation between variables,
without acknowledging the process that originates this expected relation.
Even theories and hypothesis that are more preoccupied with the process and with more
complex relations between variables do it by using natural language, meaning they will, for
the nature of natural languages, lack precision. For instance, the multicomponent model of
working memory by Baddeley and Hitch (1974) states that three components are necessary
for working memory: the central executive, the phonological loop, and the visuospatial
sketchpad with the central executive functioning. For the current presentation, it is not
necessary to describe these components. It is necessary only to know that the authors stated
that all of the components are necessary to prevent decay of relevant memory information
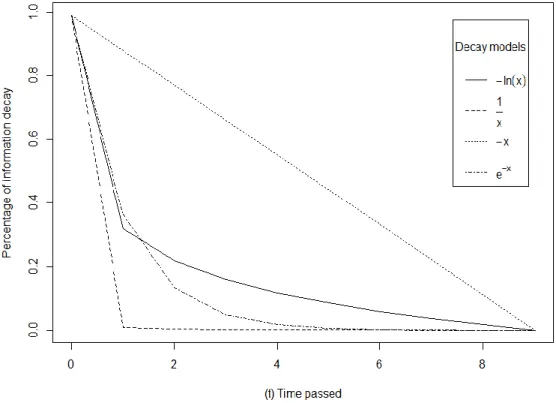
(Baddeley & Hitch, 1974). However, they do not explain how the decaying process works.
When does it begin? Is the decaying rate constant or variable? Does the decaying process have some limit of “data exclusion” or the information can be completely lost? For
illustrative purposes, Figure 1 shows four possible decaying rate models that could all be
Figure 1. Four possible models for decaying rate in memory tasks.
Are we trying to imply that natural language does not have its place in scientific
theorization? Certainly not. The true message here is that when describing quantities and
patterns, a more appropriate symbolical tool should be used; which is mathematics. This has
been the practice of what is known as mathematical psychology (Coombs, Dawes, &
Tversky, 1970): an approach to psychological research that is based on mathematical
modeling and on the establishment of psychological rules of quantifiable psychological
processes. Again, psychology researchers seem to prefer to use quantitative practices for data
analysis, but quantitative reasoning and quantitative theorizing seems still to be lacking
(Towsend, 2008). One example of use of quantitative theorizing is the latent variable theory
on psychometrics (McDonald, 2013).
Psychometrics and its three assumptions
Psychometrics is a field in psychology concerned with the theory and technique of
explain the relations between observed data and psychological traits: classical test theory
(CTT); common factor theory (CFT); and item response theory (IRT). Despite the fact that
many authors defend, for instance, that IRT is superior to CTT (Borsboom, 2005; Hays,
Morales, & Reise, 2000; Reise, Ainsworth, & Haviland, 2005), all these psychometric
theories can be understood as different applications of the same general Latent Variable
Theory (LVT; McDonald, 2013). LVT holds that psychological variables (or constructs) are
explanatory variables which are not directly observable, but inferred from their effects on
human behavior.
The following equations, that can respectively be used to express CTT, CFT, and IRT,
clarify why all these theories are related to LVT:
𝑋 = 𝑇 + 𝜀, (1)
𝑋 = 𝜆𝑇 + 𝜀, (2)
𝑔(𝑋) = 𝑓(𝑇), (3)
where X stands for the observables, T for the true, latent, score, λ for the factor loadings (or
factor weights) and ε for the random error. All equations can be understood as an extension of
the previous, with the same monotonic relation between observed and latent variables. The
functions g(X) and f(T) are usually represented, respectively, by probability mass functions
(e.g., binomial or categorical distributions) and link functions (e.g., logistic function or
cumulative normal function) to properly scale the observed and latent variables.
It is possible to perceive that all functions generate similar inferences about relations of
true and observed scores. The differences in the results rely, mostly, on the methods used to
estimate the parameters of these equations (McDonald, 2013), meaning that, from a more
computational perspective, these methods are rather different. The true score in Equation (1)
is normally estimated using sum or average scores, Equation (2) is tested by means of
tested by some item response model (IRM; van der Linden & Hambleton, 2013). All these
methods harness some pragmatic assumptions, being some of them testable (e.g.,
unidimensionality assumption; Stout, 1987), but some others are untestable (Michell, 2000).
For instance, some variation of the logistic function is generally assumed as the item response
function (IRF) for f(T) in Equation (3). Regardless of being usually taken as an obvious
assumption, due to a traditional psychophysical empirical finding on tone and loudness
perception (Fechner, 1860), there is no direct test for the validity of this assumption. This is
to say that, given that the true score is latent and not directly experimentally controllable, it is
impossible to test if the logistic function is really the function that relates latent to observed
variables (Levine, 2003). However, it is possible to test if the observed IRF is monotonic in
relation to the latent IRF (Junker & Sijtsma, 2000).
At this point it should be noted that, despite harsh, this criticism does not necessarily
invalidate the general LVT approach for psychometrics. This general psychometric approach
can be defined as a statistical approach to measurement (Sijtsma, 2012). A statistical
approach is characterized by accepting the assumptions of some statistical or mathematical measurement model, using them to establish “quality” thresholds on data. For instance, when
using Factor Analysis, items with low factor loadings are usually suggested to be discarded
(Thompson, 2004). On the other hand, factor analysis is based upon linear regression,
meaning that, if the true process is quadratic or relies on any other non-monotonic function,
the estimates of factor loadings are probably biased (McDonald, 1965). For problems like
that, a second approach for dealing with psychological data could be the physical approach
(Sijtsma, 2012). The physical approach consists of testing if a particular mathematical
structure is true for the data. For instance, utility theory uses a number of axioms to define
rational behavior (von Neumann & Morgenstern, 1944). Nevertheless, people not always
The usual interpretation is that people are not rational. Kahneman and Tversky (1979), on the
other hand, proposed the prospect theory, changing the assumptions of the utility theory, with
a consequence to changing the interpretation on humans’ decision-making behavior.
The statistical and physical approaches to measurement provide researchers with two
different mindsets, respectively: rejecting the data if the model has a poor fit; or rejecting the
model if it has a poor fit to data. None is, for itself, the best approach for proper inferences.
Sometimes it is better to reject the data after a low fit of the model, given that there may be
some bias on the data collecting process (Shaughnessy et al, 2014). On the other hand, if data
are properly collected and the model used for testing it systematically shows a pattern of bad
fit, maybe an alternative model should be tested. Nevertheless, most researchers are not even
aware of the existence of the physical approach to measurement (Michell, 2017), as it
demands more knowledge on mathematics and experimental design. Both of these
requirements make research and developing quality measurements more difficult for several
areas in psychology.
Three major critiques can then be elaborated about the traditional psychometric
practice. Each critique is related to one of three assumptions regarding psychological
measurement, as we derived from the LVT and the statistical approach to measurement. First,
psychological measurement is based on using pre-conceived models that, sometimes, are
non-testable and have higher priority than the empirical data. We call this the structural
validity assumption. Second, psychological measurement is based on models that, sometimes,
do not mirror the psychological phenomena or processes they are intended to represent. We
call this the process assumption. Finally, traditional psychological measurement depends
heavily on constructs, which are not observable and can be sometimes difficult to define;
therefore, difficult to give a proper operationalization. We call this the construct assumption.
As with several other problems within science, relaxation or thorough testing of the
assumptions can help science to improve (Kanazawa, 1998). Nonparametric Item Response
Modeling (NIRM; Sijtsma & Molenaar, 2002) can be used to test or to relax the structural
validity assumption, but it still relies on the process and construct assumptions. Cognitive
Psychometric Modeling (Embretson, 2010) can be used to test or relax both structural
validity and process assumptions, but is still relying on the construct assumption. Finally,
network modeling (Epskamp & Fried, 2018), based on the statistical approach, and
measurement theory (Roberts, 1979), based on the physical approach, can be used to relax all
three assumptions.
Structural validity assumption and Nonparametric Item Response Modeling
The structural validity assumption is the exact mathematical implementation of psychometric
models. For instance, traditional factor analysis assumes latent variables to be linearly related
to observed variables (Thompson, 2004). The error of measurement has an expectation of
zero and, for adequate fitting, a normal distribution is generally used for modeling the error.
The structural validity assumptions can be thought of as being the least related to a particular
psychological theory, but the most related with the statistical, mathematical, or computational
feasibility of the implementation of a model (e.g., Griffith & Akio, 1995). A good historical
example of changing a structural validity assumption occurred in the case of the transition
between initial IRMs and the logistic and Rasch models. Initially, the normal cumulative
density function was used as the IRF for the binary IRMs (Lord, 1953). Nevertheless, at the
time of the development of the first IRMs, computing this IRF was computationally
extensive. For this reason, some authors proposed changing from the normal to the logistic
modern computers, this difference makes little to no difference, but at the time it was
necessary so using IRMs was feasible (Rasch, 1960).
Apart from changing mathematical characteristic of the models, most of the structural
assumptions in IRMs can also be relaxed using NIRMs (Sijtsma & Molenaar, 2002). NIRM
is not only a different class of item response models, but also a whole different approach to
modeling response patterns. For both NIRM and Parametric IRMs, there are three main
assumptions about the relations between the observed scores and the latent trait. All these
assumptions are specificities of our structural validity assumption. The first is that of
unidimensionality, which simply means that the observed scores have only a single latent
cause (Stout, 1987)—or a single more relevant cause.
While there is much theoretical support for multidimensionality in psychological
measurements (Knol & Berger, 1991; Reckase, 2009), given the complexity of psychological
phenomena, many authors defend that unidimensional measurements should be preferred
(Nunnally, 1978; Sijtsma & Molenaar, 2002). The main argument standing the latter can be
clearer stated with an analogy. If you would use a scale to measure your weight and your
height at the same time, what a score of 104 would mean? Supposing there was no standard
unit for both measures, this score would be meaningless to making conclusions about those
magnitudes apart. Therefore, multidimensional scores, despite being probably more
representative of psychological phenomena, should be avoided so meaningful measures can
be achieved (Heene, Kyngdon, & Sckopke, 2016).
The second assumption is that of local independence, which states that the observed
score of individual i on item k does not depend on the response he gave in any other j item,
conditioned on the latent trait (Zhang & Stout, 1999). Finally, the third assumption is
monotonicity, which states that the probability of getting an item right (or of endorsing a
Another assumption, not common to all IRMs, however, is that of nonintersecting item
response functions (IRFs; Rosenbaum, 1987). This assumption is used, for instance, by the
Rasch Model and by the One-Parameter Logistic Model (1PLM; van der Linden &
Hambleton, 2013). For ordering items by their difficulties’ estimates, these assumptions need
to hold, simply because when IRFs intersect there is an interaction effect between
individuals’ levels of the latent trait and items difficulties (Sijtsma & Molenaar, 2002). This
means that the ordering of item difficulty is not the same for all individuals, but depends on
their latent traits. Obviously, this is not a desirable property when you want to create a
standard test.
NIRM begins to differ from parametric IRM when the operationalization of these
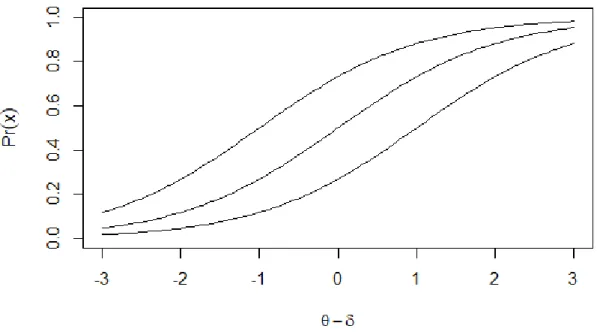
assumptions takes place. For instance, a common monotonic function relating the latent trait
with the observed scores is the logistic function:
Pr(𝑋 = 𝑥|𝜃, 𝛿) = 𝑒
𝜃−𝛿
1 + 𝑒𝜃−𝛿 (5)
where θ stands for the level of the individual’s latent trait and δ for the level of item’s
difficulty. All the lines depicted in Figure 2 are representations of this function, with different
values for the subtraction θ – δ.
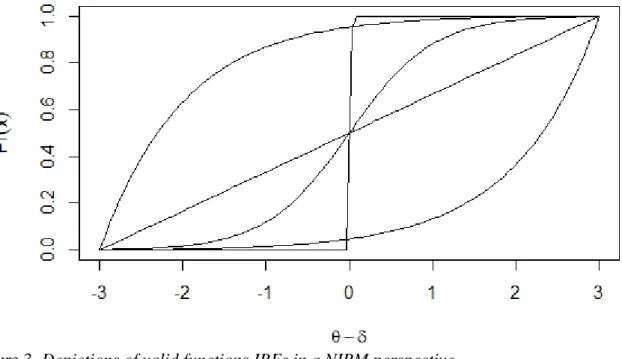
It is possible to see that the IRFs will always be “S” shaped. For NIRMs, however, any
function can be used, since it does not disregard the monotonicity. The general formulation of
IRFs for NIRMs is the following
𝑃𝑖(𝜃𝑎) ≤ 𝑃𝑖(𝜃𝑏) (6)
which implies that, provided that the function is a nondecreasing function of θ, any function
can be used to relate the latent trait with the observed response. Figure 3 depicts five different
functions, all which can be used as IRFs in a NIRM perspective.
Figure 3. Depictions of valid functions IRFs in a NIRM perspective.
As there are, in principle, an infinite number of functions that can conform to the less
restrictive forms of NIRMs, it would be computationally extensive (or impossible) to test, for
instance, exactly what function the IRF follows (Ferraty & Vieu, 2006). Therefore, in a
NIRM perspective, instead of making complex estimates of latent variables, the fit of the
model is given by the capacity of the data to follow the relaxed assumptions. This means that,
for example, the data could give a result like that in Figure 3, when using NIRM, but, if fitted
with a 1PLM, could result in what was shown in Figure 2. This would probably happen
because while NIRMs will test the assumptions it makes, parametric IRMs forces data into its
The most well know models of NIRMs are those from Mokken Scale Analysis (MSA;
Mokken, 1971). A Mokken scale is a non-parametric, probabilistic version of the Guttman
scale (Mokken & Lewis, 1982). Both Guttman and Mokken scaling assumes that items have
a hierarchical order, meaning that respondents who answered a difficult question correctly
should also answer an easy question correctly. The main difference between Guttman and
Mokken scales is that Guttman scaling assumes that respondents who answered a difficult
question correctly will necessarily answer an easier question correctly. When that does not
happen, it is said to be a Guttman error (Meijer, 1994). Nevertheless, in real evaluation
scenarios usually people do not respond deterministically, but accordingly with some
stochastic process, better modeled with MSA or a parametric IRM.
It is important to note that there are many other non-parametric and semi-parametric
models that can be found on the literature. Semi-parametric models are the ones that alleviate
just some, not all, of the assumptions made by parametric models (Dey, Ghosh, & Mallick,
2000). Many Bayesian models of such kind have been created (e.g., Miyazaki & Hoshino,
2009; Wang, Chang, & Douglas, 2013). There are also tests and models for inferential
analysis that are centered on testing the common assumptions for parametric item response
models (e.g., Stout, 1987; Straat, van der Ark, & Sijtsma, 2013). All these different
techniques make it possible to test and model a larger range of items, without being needed to
limit test and scale construction to what is only permitted by traditional IRMs.
Nevertheless, all those different models share an important limitation, as stated by
Sijtsma (2012). Using those techniques, the measurement is dependent on the
questionnaire—or test, or scale—data, meaning that they all assume that the observed scores
are caused by a generic latent variable related to the items and to the respondents. This
structural validity assumption makes it easier to mistake the prescriptive structure of a
Nevertheless, meaningful measurement is possible only if enough is known about the
attribute so as to justify its logical operationalization into prescriptions from which a
measurement instrument can be developed (Michell, 2017; Sijtsma, 2012; Trendler, 2009).
Despite theories about attributes in psychology often not being precise enough to justify a
logical operationalization, the emerging field of cognitive psychometric modeling has been presented as an interesting alternative (Embretson, 2010).
Process assumption and Cognitive Psychometric Modeling
The process assumption is the definition on how basic constructs, or latent variables, relate to
each other to compose a particular psychological model or theory. For instance, the IRT assumes that the probability of correct answering a question is a function of the respondent’s
latent trait and the difficulty of the items. The signal detection theory, on the other hand,
assumes that the probability of correct answering a question is a function of the criterion and
discrimination of the respondent (Stanislaw & Todorov, 1999). In this case, it is possible to
distinguish the measurement made by these theories as, for the signal detection theory, it
makes a difference if correct responses were a hit or a correct rejection, and if the incorrect
responses were a false alarm or a miss. For IRT, it usually matters only if the response was
correct or incorrect. This entails in the fact that both theories make different assumptions on
the underlying process controlling response patterns on the proposed quantitative model. A quantitative model is a representation of a phenomenon using techniques and procedures due to mathematics and statistics (Edwards & Hamson, 2007). Therefore, a
cognitive model is a representation of cognitive phenomena using the same class of
mathematical and statistical techniques and procedures (Lee & Wagenmakers, 2014).
Lewandowsky and Farrell (2010) describe three different classes of quantitative models. The
relations between variables. They are explicitly devoid of psychological content, although the
modeled function constrains possible psychological mechanism to the phenomena. An
example is linear regression models (Faraway, 2016). The second class is the one of process
characterization. These models postulate and measure distinct cognitive components. Yet,
they are neutral about how specific instantiations underpinning the cognitive components
work. An example is the multinomial processing trees model (Erdfelder et al, 2009). Finally,
the third class is the one with models of process explanation. Like characterization models,
their advantage stands on hypothetical cognitive constructs. However, they provide detailed
explanation about those constructs and how are they related. An example is the generalized
context model (Nosofsky, 1986).
Traditional psychometric models can be thought as descriptive models, given that they
can be described themselves as only linear or generalized linear regressions with latent
predictors (Bock, 1997). Considering psychometric models from this perspective enables to
perceive that, despite being important tools to psychological research, traditional IRMs lack
explanatory meaning. Therefore, several aspects of psychological phenomena are not taken
into account. Sijtsma (2012) states that IRT leaves psychology out of the equation when
proposing psychological models of measurement, resulting in fruitless insights for
psychological phenomena. Nevertheless, it is important to note that it is not the use of a
statistical framework based on latent variables that is the strongest limitation of IRT. The
strongest limitation is to use exclusively descriptive models (i.e., a strong process validity
assumption) for developing measurement models, which have no concern for the processes
that generated the observed data structure.
The cognitive modeling approach can then be used to enrich IRMs and give more
significance to the measurement process in psychology. Despite not formally defined as such,
traditional IRMs (Embretson, 2010). One prominent CPM is Tree Based IRMs (TIRMs;
LaHuis, Blackmore, Bryant-Lees, & Delgado, 2018). This kind of model helps to understand
in which order latent variables influence each other to cause the observed response patterns.
Empirical comparison of different TIRMs can provide proper evidences of validity for a
measure, when compared, for instance, with simply correlating expected–to–be–related
measures (Borsboom, Mellenbergh, & van Heerden, 2004). Figure 4 illustrates two
hypothetical competing TIRMs for the measurement of personality data. Both models state
that people have different propensities to act aggressively or peacefully. However, the model
on the left states that the probability of a respondent giving an aggressive or a peaceful
response depends only on the parameter α, which can be thought as his propensity to act in a
given way (e.g., his disposition). On the other hand, the model on the right decomposes the
process, stating that self-control, measured by the parameter β, has an important role on regulating individual’s actions. Traditional analysis in psychometrics and psychology would
only test correlations between these measures (e.g., Kim, Namkoong, Ku, & Kim, 2008),
providing only descriptive relations for the constructs. The use of the TIRMS makes it
possible to conclude what process is more likely to have originated the data at hand. In the
example, individuals with more peaceful personality do not need to have self-control, given
that they simply act as is socially expected. This kind of conclusion would be difficult, or
Figure 4. Two hypothetical competing TIRMs for the measurement of personality data related
to observed behavior.
Following what is proposed by Sijtsma (2012), a measurement occurs only when the
relations between the observed measure and the attribute of interest are logically and formally
established, making it possible to operationalize the phenomena of interest. Characterization
and explanation’s CPMs can be used for this end, as illustrated by the example of Figure 4.
Certainly, on the other hand, for the proper use of CPMs one cannot only rely on
questionnaire or test data. This can be a difficult task. Kagan (2005) criticized the common
psychometric practice on relying almost exclusively on the semantic structures activated
when participants give their responses to questionnaires. The author also proposes the use of
alternative data sources, such as motor activity, distress to unfamiliar visual, auditory, and
olfactory stimuli, and others. Sijtsma (2012) states that these alternative data types are rarely
used in psychometrical research. Cognitive psychology researchers who use cognitive
modeling approaches, on the other hand, are more used with searching for different data
sources for their models (Lee, 2011).
One way of increasing the number of data sources and, therefore, making a more robust
and valid measurement model, is collecting data in experimental sets (Sijtsma, 2012). This is
a good approach for two main nested reasons. First, because using experimental sets reduce
effects are controlled in experiments, each new relevant measurement reduces the amount of
unexplained variance. The repeated measurement design is the design that reduces the noise
the most (Cook, Campbell, & Shadish, 2002). The second reason, which is nested in the first,
is because experimental sets in psychology usually control for the external influences in individual’s behavior. Therefore, the variance that is left can be due only to noise or
individual differences (Bacon, 2004).
Using CPMs and experimental sets are still a novel approach to psychological
measurement, which has the potential to approximate the meaning of measurement in
psychology with that of physics (Sijtsma, 2012). Nevertheless, for some authors (e.g., Gould,
1996), measurement in psychology will always be impossible, given that IRMs, and even
CPMs, define measurement as the estimates for some latent variable. This means that, for
some authors, it is not enough to relax or test the structural and process validity assumptions,
but is also necessary to directly observe the measured property or feature. Despite this being
problematic for psychology as a whole (Borsboom, Mellenbergh, & van Heerden, 2003;
Trendler, 2013), measurement in fact does not need to be defined in terms of latent variables.
Network psychometric modelling and the realist measurement theory (Michell, 2005) can be
used to this end.
Construct assumption, network modeling, and realist measurement theory
The construct assumption is the definition of a measure as the latent variable that explains the
variance of observed variables. All models presented so far rely on this assumption, as the
estimates of the magnitude of the latent variables are of central interest, and not the observed
variables per se (Borsboom, 2005). This is an old trend in mainstream psychology to attribute
mentalist causes to human behavior (Stanovich, 2012). Despite the success of this approach
made to accept something that cannot be assessed or, if ever, only indirectly assessed
(Michell, 1990; 1997; 2005; 2008). Two work-arounds from this assumption are found in
both the recent psychometrical literature, in the form of network psychometric modeling
(Constantini et al, 2019), as well as in the traditional measurement theory literature (Roberts,
1979), largely overlooked in the current psychometric field (Michell, 2000).
Probabilistic graphical modeling (Lauritzen, 1996) is a statistical approach, derived
from the mathematical graph theory, used to model multivariate conditional dependencies
between variables. In this sense, factor analysis and item response models can be considered
as special cases of probabilistic graphical models, where dependencies between observed
variables are conditioned on latent variables (Kruis & Maris, 2016). For the probabilistic
graphical models proposed by Lauritzen (1996), however, no latent variables are considered.
Instead, dependencies between any two variables are explained by their relations to a third
variable. One of such models is the partial correlation graphical model, also known as partial
correlation network model (Epskamp & Fried, 2018). This model has been of growing
interest in the field of psychometric construct analysis, such as mental health related ones
(Borsboom, 2017), where the existence of a common latent cause is a controversial issue.
The probabilistic graphical modelling approach to psychometrics, also named
network psychometrics (Epskamp, Rhemtulla, & Borsboom, 2017), is considered as a part of
the statistical approach to measurement because it is not particularly interested in the
measurement level of the observed variables. For instance, partial correlations can be
calculated from polychoric correlations, combined with regularized regressions, if the
observed variables are ordinal (Golino & Epskamp, 2017). It is generally not the objective to
estimate interval or ratio measures to predict observed variables, nor are the values of the
observed variables transformed to interval or ratio measures. However, some network
traditional latent common cause models, such as factor analytical models and item response
models (Marsman et al, 2018). This means that not always network psychometrics will
present a true alternative to traditional psychometrics, only when it avoids latent variables
(Kruis & Maris, 2016; Lauritzen, 1996).
One good example of using network psychometrics, and abandoning latent variables to
measure psychological entities, is the model of general intelligence proposed by van der
Maas et al (2006), known as the mutualism model of intelligence. Traditionally, the study of
human intelligence was concomitantly developed with the psychometric factor analytic
model (Buckhalt, 2002). This is represented by the fact that one of the main discussions in
the study of intelligence is not about the existence of a true latent variable, but about how
many dimensions describe this assumed latent variable the best (e.g., Golino & Demetriou,
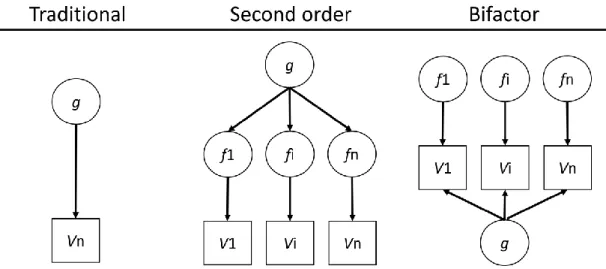
2017). The most traditional model, and maybe one of the best corroborated, is the g-factor
model of general intelligence (Canivez & Watkins, 2010). In this model, a single general
latent variable is used to explain the variance of all observed variables. Some extensions
(Canivez, 2016) involve using this g-factor as the cause of other latent variables (named
specific factors), or with other latent variables explaining residual correlations, after
conditioning the g-factor out. These are known as the second-order and bifactor models,
respectively. The traditional, second-order, and bifactor models of intelligence are
respectively illustrated in Figure 5, where g represents the g-factor, f1, fi, and fn represent the