© 2014 Dental Press Journal of Orthodontics 14 Dental Press J Orthod. 2014 Nov-Dec;19(6):14-5
Evidence-based
Orthodontics
High-dimensional data hinder sample visualiza-tion and limit exploravisualiza-tion of data1. In these cases, we can make use of multivariate analysis techniques, such as Factor Analysis (FA) and/or Principal Component Analysis (PCA), to reduce a complex data set to one of lower dimensions so as to reveal any hidden features and simplify understanding.
In order to render interpretation of FA and PCA easier, an example of the practical applications of these techniques is described herein.
An orthodontist wants to make a few changes in his clinic in order to ensure higher-quality treatment. However, such changes have to be tailored according to the needs and desires of his target customers. Thus, he decided to implement a questionnaire at the end of orthodontic treatment. Patients had to respond to several questions which were grouped into the follow-ing items: 1 - staf helpfulness; 2 - staf professionalism; 3 - staf manners; 4 - attention given by the dentist; 5 - dentist’s technical quality; 6 - waiting time; 7 - ex-planation about treatment; 8 - comfortable facilities; 9 - waiting time to schedule an appointment; 10 - con-venience of treatment schedule; 11 - parking facilities; 12 - telephone service; 13 - cleanliness. When rating, patients used a score that ranged between 1 and 7,
with 1 meaning weak and 7 excellent. A total of 50 pa-tients responded to the questionnaire. Aterwards, the dentist found it diicult to establish a change plan due to the large number of items analyzed.
In an attempt to reduce the amount of data and fa-cilitate interpretation, the dentist used Factor Analy-sis (FA), a type of multivariate analyAnaly-sis. Factor Analysis is useful when there is a large number of variables that may provide redundant or duplicated information. In this case, re-dundancy means that some variables are correlated to each oth-er — possibly because they are measuring the same “thing”. Thus, it is possible to reduce the observed variables to a smaller number also known as factors — groups of correlated variables that present some information in common.
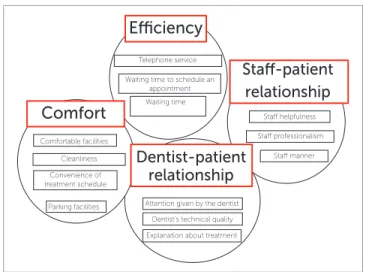
The orthodontist found out that the 13 items in the questionnaire were not in fact measuring 13 diferent facts due to the apparent redundancy shared by some variables. Thus, four new variables or factors, which were im-plicit in the correlations, were established: 1 - eiciency; 2 - comfort; 3 - staf-patient relationship; 4 - dentist-pa-tient relationship. Factor analysis for the variables used by the orthodontist are observed in Figure 1.
Nevertheless, to establish an improvement plan, the orthodontist needed to know the item which most inluences patients’ satisfaction. To this end, he used
Contact address: David Normando, Departamento de Ortodontia, Faculdade de Odontologia, Universidade Federal do Pará, Rua Augusto Corrêa, 01 - Gua-má. CEP 66075-110, Belém, Pará, Brazil
Email: [email protected]
How to cite this article: Nascimento GCR, Magno MB, Heo G, Normando D. How can I explore high-dimensional data? Dental Press J Orthod. 2014 Nov-Dec;19(6):14-5. DOI: http://dx.doi.org/10.1590/2176-9451.19.6.014-015.ebo
1 Masters student in Dentistry, Federal University of Pará (UFPA). 2 Associate professor, University of Alberta, Canada.
3 Adjunct professor, UFPA.
Submitted: September 19, 2014 - Revised and accepted: October 03, 2014
How can I explore high-dimensional data?
© 2014 Dental Press Journal of Orthodontics 15
Nascimento GCR, Magno MB, Heo G, Normando D
Dental Press J Orthod. 2014 Nov-Dec;19(6):14-5
Evidence-basedOrthodontics
Principal Component Analysis (PCA), another multi-variate analysis employed to explore data.
PCA is a mathematical tool widely used for high dimen-sional data analysis.2 It aims at inding the principal
compo-nents (PCs). But what does this mean? Although a large number of variables is necessary to reproduce the overall variability of a particular phenomenon (patients satisfaction, for example), sev-eral variables will gensev-erally have greater importance than others. PCA identiies these important variables and shows them in de-creasing order from the most to the least important. In other words, each new component accounts for progressively smaller amounts of total variance. Importantly, the number of components extracted in PCA is equal to the number of variables being analyzed. In other words, an analysis of the 13-item questionnaire resulted in 13 components. Nevertheless, should more than 80% of vari-ability be explained by a few PCs, we can use them in place of the original variables without losing too much information (this is why only the irst components were used for data interpretation).3
The orthodontist applied PCA over FA for the com-ponents previously grouped. Results revealed that den-tist-patient relationship and comfort account for 85% of total variance in patient’s satisfaction. With these data in hand, the dentist will be able to perform changes in his oice and ensure improvements in the items which most inluence his target customers.
PRINCIPAL COMPONENT ANALYSIS
IS NOT FACTOR ANALYSIS
Similarly to Factor Analysis (FA), PCA aims to re-duce data dimensions to the smallest number of variables possible with minimal loss of information. Nonetheless, there are signiicant conceptual diferences between the two techniques. PCA focuses on summarizing data in order of importance,3 whereas FA explains the common variations among the original variables.
Importantly, one should note whether the variables present a connecting structure between them, since both PCA and FA are sensitive to poor correlations established among diferent variables. This may afect analysis, there-by invalidating the use of these techniques.
Multivariate analysis has several techniques of difer-ent applicability. PCA and FA are two of them, and the choice of which one should be used depends on the hy-pothesis one intends to generate about the data. Thus, when these multivariate analysis techniques are used properly, they allow us to make inferences beyond the “statistically signiicant”, thereby adding much value to our research. However, it is very important to remem-ber that, in many cases, it may not be easy to interpret principal components and factors, as it depends on the researcher to interpret the new set of variables and be able to translate the information it contains.
Figure 1 - The four factors generated by Factor Analysis.
1. Ringnér M. What is principal component analysis? Nat Biotechnol. 2008;26(3):303-4.
2. Jeong DH, Ziemkiewicz C, Ribarsky W, Chang R. Understanding Principal Component analysis using a visual analytics tool, UKC 2009, Mathematics: Fundamentals and Applications, To Appear, 2009. 3. Chan YH. Bioestatistics 302. Principal component and factor analysis.
Singapore Med J. 2004;45(12):558-65.
REFERENCES
Eiciency
Telephone service
Staf helpfulness Staf professionalism
Staf manner
Attention given by the dentist Comfortable facilities
Cleanliness
Parking facilities Convenience of treatment schedule
Dentist’s technical quality Explanation about treatment Waiting time to schedule an
appointment Waiting time
Comfort
Dentist-patient relationship