M&A in the Chinese pharmaceutical industry:
Shanghai Pharma and SIPI/SZXP Case study
Jie Wang
Project submitted as partial requirement for the conferral of Master of Science in Finance, at ISCTE – University Institute of Lisbon, 2016
Supervisor:
Prof. Pedro Manuel de Sousa Leite Inácio, ISCTE Business School, Department of Finance
Spine
-M&
A
in
th
e C
hi
ne
se
ph
armac
eu
ti
cal
in
du
st
ry
: S
han
gh
ai
Ph
arma
and
SI
PI/
SZ
X
P C
as
e study
JIE
WA
N
G
Abstract
M&As are developing really fast in China, especially in pharmaceutical industry. But the road of M&A is not flat, some enterprises suffered bitter and unnecessary losses because of blind M&A and lack of comprehensive understanding of the target company. Shanghai Pharmaceutical Co., Ltd. (Shanghai Pharma) played an exemplary role for improving industrial concentration, optimizing the organizational structure and rationally allocating resources by means of M&As.
Event study methodology is used in this paper to test the effect of the merger case on the stock price of Shanghai Pharmaceutical Co., Ltd. The announcement of tender offer for the merger between Shanghai Pharma and Shanghai Industrial Pharmaceutical Investment Co. Ltd. (SIPI)/Shanghai Zhong Xi Pharmaceutical Co. Ltd. (SZXP) had a positive influence on the stock price at a statistical significant level, therefore it brought short term benefits for Shanghai Pharma.
Financial analysis revealed the operating and financial synergies generated by this merger, we can find a substantial increase of three growth indicators: The main business's increasing rate of revenues, Net profit growth rate and Net asset growth rate, which means a great improvement of the enterprise operating capabilities. The company’s profitability and capital utilization improved a lot as we revealed after calculating ROS, ROA and ROE from 2006 to 2012. Shanghai Pharma also improved its capital structure and solvency through such large M&As.
Forecasting synergies for this case, Shanghai Pharma and SIPI occupied the most part of synergies during this acquisition, however the increase in the enterprise value of SZXP was not significant.
Key words: mergers & acquisitions, China, event study, SWOT analysis, synergy
Resumo
As Fusões e Aquisições (F&A) estão a desenvolver-se rapidamente na China, nomeadamente na indústria farmacêutica. No entanto, este processo tem tido os seus problemas, algumas empresas tiveram perdas significativas e desnecessárias devido a F&A apressadas e à falta de uma compreensão adequada das empresas alvo por parte das oferentes. A empresa Shanghai Pharmaceutical (Shanghai Pharma) desempenhou um papel exemplar no aperfeiçoamento da sua concentração industrial, melhorando a sua estrutura organizacional através de uma alocação de recursos mais racional como consequência das suas operações de F&A.
Neste trabalho utiliza-se a metodologia dos estudos de eventos para testar o impacto das fusões no preço das ações da Shanghai Pharmaceutical. O anúncio da OPA visando a fusão entre a Shanghai Pharma e a Shanghai Industrial Pharmaceutical Investment (SIPI)/Shanghai Zhong Xi Pharmaceutical (SZXP) teve uma influência positiva no preço da ação estatisticamente significativa, pelo que se traduziu numa vantagem para a Shanghai Pharma e os seus acionbistas. A análise financeira efetuada revelou as sinergias operacionais e financeiras geradas por esta fusão, tendo-se encontrado um aumento significativo em três indicadores de crescimento: na taxa de crescimento das receitas operacionais, no crescimento dos resultados líquidos e no crescimento dos ativos, o que se traduz numa grande melhoria do potencial operacional da empresa. A rendibilidade da empresa e a elevada rotação do seu ativo melhoraram substancialmente tal como se pode verificar pelo exame dos indiocadores ROS, ROA and ROE de 2006 a 2012. A Shanghai Pharma também reforçou a sua estrutura de capital e melhorou a sua solvência com esta operação de fusão.
As sinergias financeiras estimadas neste caso entre a Shanghai Pharma e a SIPI são as mais relevantes, já as provenientes da SZXP não são tão significativas.
Palavras chave: fusões e aquisições, China, estudos de eventos, análise SWOT, sinergia
Acknowledgement
I wish to highlight and express my gratitude to some people directly or indirectly, in this study. To my parents, Shengli Wang and Xiaoqun Liu, who have provided me with all the needed financial and emotional support, I would have no way to insist on my study without their generous support.
To my boyfriend, Cheng Zhao, who accompanied me over the years and visited me from China last winter holiday, and gave me confidence to study.
My special thanks to my supervisor, professor Pedro Manuel de Sousa Leite Inácio, for his patient guidance and careful revision, for helping me, a original medical student, to be able to complete the thesis more smoothly and quickly.
Finally, I want to express my appreciation to all friends who had helped me to connect with officials in Portugal when I was in China, thanks for all your helps!
Index
1. Introduction ... 1 2. Literature review ... 3 2.1 M&A ... 3 Differences ... 3 Categories ... 3 Payment methods ... 3 Benefits or not ... 4 Motives ... 52.2 Event study methodology ... 5
2.3 SWOT ... 9
2.4 Synergy ... 10
Operating synergy ... 11
Financial synergy ... 13
Corporate Valuation (DCF) approach ... 14
3. Background research ... 17
3.1 M&A in China ... 17
3.2 Pharmaceutical industry in China ... 19
3.3 Chinese Pharmaceutical Enterprises M&A ... 23
4. Event study ... 24 5. Overview of case ... 30 5.1 Acquirer company ... 30 5.1.1 SWOT analysis ... 31 5.2 Target companies ... 33 6. Synergy analysis ... 36
6.1.1 Operating synergy ... 36
Growth rate analysis ... 36
Profitability Analysis ... 38
6.1.2 Financial synergy ... 39
Capital structure and Debt coverage ... 39
6.2 Synergies forecasting ... 41
6.2.1 Enterprise valuation (DCF) ... 41
a)Shanghai Industrial Pharmaceutical Investment Co. Ltd. ... 41
b)Shanghai Zhong Xi Pharmaceutical Co., Ltd. ... 43
6.2.2 Synergies estimation ... 46
a)Shanghai Industrial Pharmaceutical Investment Co. Ltd. ... 47
b)Shanghai Zhong Xi Pharmaceutical Co., Ltd. ... 49
7. Conclusion ... 52
Bibliography ... 54
Index of Figures
Figure 1 The windows of event study methodology ... 7
Figure 2 SWOT Analysis ... 10
Figure 3 Economies and Diseconomies of Scale ... 12
Figure 4 Trend of domestic M&A of Chinese enterprise (20072013) ... 17
Figure 5 Trend of M&A market of China (20072013) ... 17
Figure 6 Global pharmaceutical market share ... 21
Figure 7 Ongoing healthcare reform will emphasize drugrelated lost containment ... 22
Figure 8 Plot of CAR and AR for announcement of merging Comely ... 25
Figure 9 Plot of CAR and AR for announcement of merging CHS... 26
Figure 10 Plot of CAR and AR for the offering announcement ... 27
Figure 11 Equity transfer diagram ... 31
Figure 12 Asset restructuring program ... 35
Figure 13 Main business's increasing rate of income ... 36
Figure 14 Net Profit Growth Rate ... 37
Figure 15 Net Asset Growth Rate ... 37
Figure 16 ROS, ROA, and ROE of Shanghai Pharma ... 38
Figure 17 Current ratio ... 39
Figure 18 Quick ratio ... 40
Figure 19 Equity ratio ... 40
-Index of Tables
Table 1 Regression results ... 24Table 2 CAR T test table ... 28
Table 3 SWOT matrix of Shanghai Pharma... 31
Table 4 Free cash flow table for SIPI ... 41
Table 5 Regression results of returns for SIPI and SSE composite index ... 42
Table 6 Rd estimation for SIPI ... 43
Table 7 Free cash flow table for SZXP ... 44
Table 8 Regression results of returns for SZXP and SSE composite index ... 45
Table 9 Rd estimation for SZXP ... 45
Table 10 Major indexes comparison ... 46
Table 11 Expected synergies ... 46
Table 12 Scales of SZXP, Shanghai Pharma, and SIPI (2009/6/17) ... 47
Table 13 FCFF of SIPI with expected synergies ... 48
Table 14 Distribution of the synergies between SIPI and Shanghai Pharma ... 49
Table 15 FCFF of SZXP with expected synergies ... 50
-List of Abbreviations
AR -- Abnormal Returns
AAR -- Average Abnormal Returns
ACAR -- Average Cumulative Abnormal Returns CAR -- Cumulative Abnormal Returns
CAGR -- Compounded Annual Growth Rate CAPM -- Capital Asset Pricing Model DCF -- Discounted Cash Flow
FCFF -- Free Cash Flow of Firm GDP -- Gross Domestic Product GMP -- Good Manufacturing Practice GSP -- Generalized System of Preference
NDRC -- National Development and Reform Commission NPV -- Net Present Value
OLS -- Ordinary Least Squares ROA -- Return on Assets ROE -- Return on Equity ROS -- Return on Sales
RMB -- Chinese currency name, same as Yuan (¥)
SASAC -- State-owned Assets Supervision and Administration Commission SOE -- State-Owned Enterprises
WACC -- Weighted Average Cost of Capital WTO -- World Trade Organization
1. Introduction
M&A continues to be a popular method to achieve expense reduction, increase market power and operating efficiencies. China, as the world’s second largest economy, has maintained a high economic growth rate since the economic reform of 1978. Facing the increasing market competition pressure, Chinese companies have to enhance their own strength constantly to survive and develop in the fierce market competition. Generally speaking, there are two ways to develop and expand, the first is to realize the gradual development by accumulation of themselves; the second is to achieve leap-type development by external mergers and acquisitions, M&A can be more effective, many researchers have evidenced the role of mergers in improving firm performance (Datta, Narayanan and Pinches, 1992; King, Dalton, Daily, & Covin, 2004).
Pharmaceutical industry has high knowledge and technology intensity, high capital intensity, high added value, high risk and other high-tech industries basic characteristics.Since China entered into WTO, a large number of foreign enterprises have poured into China, a huge market, the state-owned pharmaceutical companies are facing huge competition pressure either from domestic pharmaceutical enterprises or foreign pharmaceutical enterprises. In order to improve the competition capability of state-owned pharmaceutical companies, M&A is an inevitable trend. In recent years, state-owned pharmaceutical companies implement M&A actively under the help of State-owned Assets Supervision and Administration Commission (SASAC), they make full use of the advantage of each other, by reducing operating costs, and expanding business scale, in order to achieve the good performance of M&A. In this context, it is meaningful to study M&A of state-owned pharmaceutical companies, with the purpose of providing implications and references for mergers activities in China.
In this paper, we study the merger case of Shanghai Pharmaceuticals Holding Co., Ltd (Shanghai Pharma) at 2009 as a project, which had an important impact on the Chinese pharmaceutical industry. In October 2009, led by the Shanghai State owned assets supervision and Administration Commission (SASAC), Shanghai Pharmaceutical Co., Ltd. announced merger and reorganization plan, after the restructure, the new Shanghai Pharma became a large comprehensive pharmaceutical company covering the entire industry chain, and also becoming the only public pharmaceutical company subordinated by Shanghai SASAC.
There are four parts in this paper: the first part is a brief literature review, expounding the theoretical research on the merger and reorganization of enterprises, which provides a powerful support for the analysis and demonstration of the next study in this project; the second part is background research, we respectively analyzed the situations of M&A in China, Pharmaceutical industry of China, and M&A of Chinese pharmaceutical enterprises, to provide a general understanding of the research background; the third part is the performance analysis of Shanghai Pharma, event study methodology was used to test the important effect of the mergers reflected on the stock price of Shanghai Pharmaceutical Co., Ltd., we chose three events during 2008 to 2012, and use the statistical test to measure the significance of CARs, the announcement of tender offer for the merger between Shanghai Pharma and SIPI/SZXP had positive influence on the stock price at a significant level, it brought short term benefits for Shanghai Pharma; the fourth part is a case study, after overviewing the case, some financial indicators were used to evaluate the operating and financial synergies derived from the merger, we found a great improvement of the enterprise growth rate, the company’s profitability and capital utilization improved a lot as we revealed after calculating ROS, ROA and ROE from 2006 to 2012, the capital structure and solvency of Shanghai Pharma were also improved. Next, DCF was used to estimate the enterprise value for forecasting synergies, and we calculated the synergies for each pair of companies and figured out how these synergies was separated among this three companies. Shanghai pharma and SIPI occupied the most part of synergies during this acquisition, but the increase of the enterprise value of SZXP was not significant. Finally, the conclusion derived from the performance of the bidding company summarizes the integration effects for this case, and explores the profound implications for guiding practical activities in the future.
2. Literature Review
2.1 M&AM&A is an important form of capital operation and business expansion, an important way of industrial structure coordination and resource allocation optimization under market economy. Merger is an economic behavior, it refers that an enterprise may take various forms for receiving other enterprise's property rights, making the target company lose the status of a legal person or changing the legal entity.
Acquisition refers to a company buying another enterprise’ shares or assets with cash or securities, to obtain all the assets or the control of the enterprise.
Differences:
Merger often has a result that the target company loses the legal status, and becomes a part of the buyer; but in the act of acquiring, the legal person status of the target company can be retained.
Categories:
Federal trade Commission sorted M&A into horizontal merger, vertical merger, and conglomerate merger. Horizontal M&A is the situation that two or more than two companies in the same industry with similar production combine together (Stacey, 1966). Vertical merger refers to the merger between companies with the relationship of purchase - sale, for example: Merck Co merged the world's largest seller of prescription drugs—Medco Containment Services, Inc. at price of $6 billion in 1993. Conglomerate merger occurs between companies which are neither competitors nor in a purchases - sales relationship. Based on the case in this project, we focus on horizontal mergers. Eckbo (1983) also demonstrated that the combination of related firms usually can get a more cost-efficient corporate entity compared to the acquisition between unrelated firms.
Payment methods:
It can be paid in cash or securities, and also can be a mixture of them, the securities used by the payment can be the own stock of the acquiring company, or other securities. Stock exchange method, in which the exchange rate can be fixed or floating, usually saves considerable costs compared with cash merger, it also generates the expected growth effect of stock (Xu Minglei,
2014), and provides some tax benefits for the seller under the precondition that both parties have a unified understanding of the value of the securities used in the transaction (Gaughan, 2011).
Benefits or not:
M&A has always been a quick way for a company to seek development and increase value, Jensen and Ruback (1983) demonstrated that acquisitions in general create economic value. Andrade, Mitchell, and Stafford (2001) also argued that corporate mergers add wealth to stock-holders in general. However, Habeck et al. (2000) pointed out that most of M&A result in reducing shareholder value.
The sobering reality is that only about 20 percent of all mergers really succeed. Most mergers typically erode shareholder wealth…the cold, hard reality that most mergers fail to achieve any real financial returns…very high rate of merger failure…rampant merger failure…1
The value created from M&A stated by Bruner (2002), is determined by some factors which describe higher and lower profitability. Focus, relatedness, and adherence to strategy are determinants for value creating; while diversification, size maximization, empire building and hubris destroy value. That means the good deals are achieved not only by pricing, also by strategy and skills of post-merger integration. The critical insight is that choices made by managers can be materially influential to M&A profitability.
Ficery, Herd, & Pursche, (2007) demonstrated that M&A synergies are really controversial since the difficulty to calculate and capture. They pointed six points that why can M&A go wrong when enterprises trying to capture more synergies. First, acquiring companies often fail to capture all the synergies because of the narrow definition to synergies by executives at acquiring companies; the second problem is the missing of opportunity window; the third one is related to incentives as we will talk next in Motives; Fourth, enterprises always having the wrong people involved in synergy capture; Fifth, the cultural adaption in achieving synergies; finally, the process executed may be not right. Same topic also discussed by William (2013) that “Most research on M&A shows that a majority of deals fail to create value for owners of the firm…Failed M&A deals are often the result
of overemphasizing certain parts of the organization of not properly coordinating and involving the various constituencies in the organization appropriately”.
Motives:
Malatesta (1983) concluded that acquisitions are motivated by agency, the same consequence as the point of Lewellen, Loderer, and Rosenfeld (1985), who indicated the returns of takeover are positively related to the level of management ownership in the bidding firm.
An empirical investigation was conducted by Berkovitch & Narayanan (1993), they found there is a positive correlation between the target and total gains in synergy motivated takeovers, negative if agency is the motive, where “managerialism” leads to overpayment for extending the benefits of managers at the sacrifice of shareholders (Seth, Song and Pettit, 2000: 387), and not significantly different from zero in hubris subsample, where vanity induces managers to overpay the premium (Roll, 1986).
Xu Minglei (2014) indicated that there is a motivation of tax avoidance in China, as the current enterprise income tax regulations, M&A enterprises can get tax benefits by using their own losses to reasonably avoid taxes.
2.2 Event study methodology
As Fama (1991) pointed, there was little empirical evidence in the corporate finance central issue before the event study methodology was applied.
Event study methodology refers that using financial market data to determine the impact of a specific economic event on the value of a listing corporation. Although the first published study about event studies was from Dolley (1933), who examined the stock price reaction to stock splits using 95 samples, the landmark papers originally emerged were Ball and Brown (1968) and Fama et al. (1969), they provided the central skeleton of typical event study. MacKinlay (1997) also argued “using financial market data” to “measure the impact of a specific event on the value of a firm”, “given rationality in the marketplace, the effects of an event will be reflected immediately in security prices.”
company's M&A, and verify some financial theories about the merger and acquisition. Warren-Boulton and Dalkir (2001) explained the logic of the event study methodology in M&A, they found highly significant returns only for the rival firm in the relevant market. Based on these returns, they were able to estimate the price effect of the merger in the product market.
The rationale of event study methodology is: assuming the market is rational, the effect of relevant event would be reflected immediately in the security price. As a result, using a relative shorter observation period of stock price can determine the economic impact of an event.
The basic idea is: First we assume that the market is semi-strong efficient, then we define the time period for the event as the event window, and calculate the abnormal returns and the cumulative abnormal returns for the event window, finally use the statistical test of these two indicators to measure the impact of the event.
General steps as follows:
a. Define event and event window
We should focus on what kind of event it is, and we also need to identify the related event, or event window in which the event may affect the variables (price, profit). Usually, the event window includes a period of time before and after the event, since the time period before the event can display the changes of variables (e.g., price, profit), at the same time, the inspection of the stock price in the time period after the event can capture the impact of the prior warning and prior leaked information.
b. Define the estimation window and the post-event window
The purpose of defining the estimation window is to use data to estimate the variables under the situation that the event does not appear (the value of the expected profits), usually larger than or equal to 120 days. Comparing the expected profits and the practical profits, we can draw the abnormal returns caused by the event. In some cases, we need further define the post-event window, to improve the reliability of the expected profit estimates in case there is trend variation.
Figure 1 The windows of event study methodology Source: Author
Khotari and Warner (2006) blurred the boundaries of the event window and post-event window, and according to the length of the event window, they classified the event study as the short-horizon event study (event window less than 1 year) and the long-horizon event study (event window greater than or equal to 1 year). It is believed that the study of the short-horizon event has been relatively mature and worthy of trust, while the long-horizon event study has limitations and needs to be further developed and perfected.
c. Calculation of abnormal returns
Abnormal returns are the difference between the practical return and the expected return. The normal performance measuring models can be loosely grouped into two categories—statistical: constant mean return model, market model; and economic. Take the market model (MacKinlay 1997) as an example, the calculation formulas of the normal return (Rit) and the abnormal return (ARit) are:
We assume a linear relationship exists between the market return and the stock return. 𝑅𝑖𝑡 = 𝑎𝑖𝑡+ 𝛽𝑖𝑡𝑅𝑚𝑡+ 𝜀𝑖𝑡 (Equation 1)
Where: E(𝜀𝑖) = 0
Var(𝜀𝑖𝑡) = 𝜎𝜀2𝑖
𝐴𝑅𝑖𝑡 = 𝑅𝑖𝑡− (𝑎𝑖𝑡+ 𝛽𝑖𝑡𝑅𝑚𝑡) (Equation 2)
Generally we employ ordinary least squares (OLS) as a consistent estimation procedure to estimate the parameters for the market model.
d. Cumulate abnormal returns
The calculation of the abnormal return above is just for a certain event date, in order to better describe the impact of events on the stock returns, we need to accumulate time to calculate the cumulative abnormal returns of the stocks.
𝐶𝐴𝑅𝑖(𝑡1, 𝑡2) = ∑𝑡2 𝐴𝑅𝑖𝑡
𝑡=𝑡1 (Equation 3)
𝑇1 < 𝑡1 ≤ 𝑡2 ≤ 𝑇2
When L1 is large enough, 𝐶𝐴𝑅𝑖 variance is: 𝜎𝑖2(𝑡
1, 𝑡2) = (𝑡2− 𝑡1+ 1)𝜎𝜀2𝑖 (Equation 4)
e. Statistical test
After calculating the abnormal returns, the statistical test can be used to determine whether the event has an impact on stock returns at a significant level, as well as ensuring the scientific reliability of event studies.
The steps are as follows:
First, put forward the null hypothesis (𝐻𝑜): the event had no effect to the stock returns.
Second, construct statistic 𝐶𝐴𝑅𝑖(𝑡1, 𝑡2)
𝐶𝐴𝑅𝑖(𝑡1, 𝑡2)~𝑁(0, 𝜎𝑖(𝑡1, 𝑡2))
Standardize the above statistics, and obtain:
𝜃𝑖 =𝐶𝐴𝑅𝜎 𝑖(𝑡1,𝑡2)
Third, according to a given level of significance (α), determine the rejection region of 𝐻𝑜.
{𝜃‖𝜃|>𝑍𝛼 2}
Since 𝜎𝜀2𝑖 is unknown, we can approximately use the variance of sample to replace it.
Finally, when θ falls into rejection region, we can refuse the null hypothesis, we can say the outcome is “statistically significant”, thus the event has an impact on stock returns; otherwise we accept 𝐻𝑜.
2.3 SWOT
SWOT stands for Strengths, Weaknesses, Opportunities and Threats, and determines the strategic positioning of enterprise, maximizes the use of the internal advantages and opportunities, reduces the disadvantages and threats to the minimum. Learned et al. (1969) described that SWOT analysis is a key tool for addressing complex strategic situations, but Turner (2002) insisted SWOT was attributed to Ansoff (1987). We do not know the origin of the term “SWOT”, Haberberg (2000) pointed out that SWOT was used for the first time by Harvard academics in the 1960s.
SWOT is the key technique for presenting the results of strategic analysis, which provides a platform for going on to formulate the strategy for the future. The strengths and weaknesses should be based upon the internal analysis of the organization whilst the opportunities and threats should be based upon an analysis of the organization’s external environment.2
Typically, managers first consider internal strengths and weaknesses (at the top row of the 2 × 2 grid) which can include image, structure, access to natural resources, capacity and efficiency, and financial resources. At the bottom row of the SWOT grid, external opportunities and threats include customers, competitors, trends in the market, partners and suppliers, social changes and new technology, and various environmental economic, political and regulatory issues (Helms & Nixon, 2010.).
2 Evans, Campbell, & Stonehouse (2003) - Strategic Management for Travel and Tourism, Chapter 9, Routledge, Oxford.
Figure 2 SWOT Analysis Source: Author SWOT analysis procedures:
1. List the strengths and weakness, opportunities and threats of the enterprise.
2. Combined strengths, weaknesses, opportunities and threat, form SO, ST, WO, WT strategies. 3. Identify and choose among SO, ST, WO, WT strategies, and determine the concrete strategy that the enterprise should take at present.
2.4 Sinergy
An acquisition of a suitable company may bring some synergies to the buyer, but what is synergy? Sirower (1997) argued that synergy can be defined as “Increases in competitiveness and resulting cash flows beyond what the two companies are expected to accomplish independently”
In the theory of static synergy, which was initially put forward by “the ancestor of strategic management” -- Ansoff (1960s), the synergy of enterprise merger and acquisition is, through the merger and acquisition, the enterprise's benefit can be greater than the sum of the two companies independently, to be short, synergy has the effect of 2+2=5, the Soviet Government also used the same expression as Ansoff when propagandizing for the first Five-Year Plan (1928). This definition is biased however, because according to this formula, this synergy effect not only includes the synergy of M&A, but also includes the growth potential of both sides before the merger, which leads to growth performance after the merger, so the synergy effect is overestimated.
The concept of dynamic synergy was initially proposed by an American merger expert Sirower (1997). He believed that synergy of enterprise merger and acquisition is that the company's operating performance should be better than the expected operating performance of the two companies when they were independent. He also pointed out that if the performance improvement of enterprises after the merger and acquisition was expected before the merger when these two companies were independent, it is not a synergy of mergers and acquisitions. Only the value beyond the expected could be the true realization of synergies.
Synergy may allow the combined firm to have a positive net acquisition value (NPV).
NPV = [Vab – (Va + Vb)] – (P + E) (Equation 6)
Where:
Vab: the combined value of the two firms Va: the value of firm A
Vb: the value of firm B P: the premium paid for B
E: expenses of the acquisition process
The synergy which is in the brackets must be greater than the sum of P + E, otherwisethe bidding firm will fall under the risk of overpaying (Gaughan, 2011).
Whether M&As can lead to synergy is by no means guaranteed (Bradley, Desai and Kim, 1998). Sirower (1997) observed that companies, who paid too much, forecast too brightly, lose the acquisition game. He pointed out the “synergy limitation view”, which hold that there are “severe limits to attainable synergies (i.e., a low expected value) in a competitive market relative to what most acquisition premiums would require”. Besides, a value-destroying effect was identified: “an acquisition made at a premium to the market price will effectively raise the market’s expectations of the combined firm’s performance.”
2.4.1 Operating synergy:
The combination of companies improves the efficiency of their producing and operating activities, which is the so-called operating synergies.These synergies always benefit from economies of scale and scope, reducing operating costs and/or capital investments, thus improving cash flow.
Economies of scale
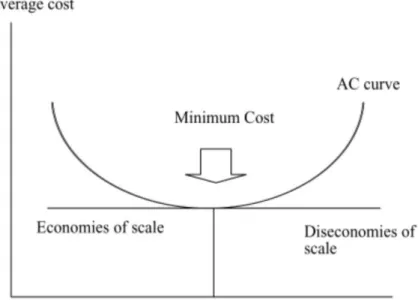
Pursuing economies of scale is an important motive for M&A, and it is overwhelming as the motive of monopoly (Pratten, 1971). Silvestre (1987) defined in "the new Palgrave Dictionary of economics" that considering a given (invariant) technology condition, if the average cost of producing a single or composite product is reduced (or increased) in a certain interval, it can be said that there are economies of scale (or diseconomies of scale).Smith (1976) pointed out that the division of labor and specialization is the main reason of economies of scale, and on this basis, put forward the "Smith's theorem" argument: with the increase of market capacity, firm size has a tendency to unlimited expansion (White, Smith, Skinner,& Whilson, 1976).
Figure 3 Economies and Diseconomies of Scale Source: Patrick A.Gaughan3
As shown in Figure 1, economies of scale, the proper size expansion of the company leads to the decline of the unit cost. Diseconomies of scale mean that, with the expansion of the production scale, the marginal benefit is gradually declining, even below zero.
3 Patrick A. Gaughan, 2011, Mergers, Acquisitions, and Corporate Restructurings, 136, John Wiley & Sons, Inc., Hoboken, New Jersey.
Economies of scope
Economies of scope are "efficiencies wrought by variety, not volume" (Goldhar and Jelinek, 1983), refers to a condition where the cost of producing two kinds of products together is lower than that of producing each product separately.
American economists Panzar and Willig(1975)initially defined from the perspective of industrial organization, that economies of scope are a kind of economy which is emerged when a firm who manufactures one kind of product changes to manufacture two or more kinds of products, and the long-term average cost is reduced. Baumol et al(1982)rely on the cost effect function to study economies of scope, they believe that in the multi - output environment, multi - product output synergies will produce a range of economic benefits.
2.4.2 Financial synergy:
Jensen and Ruback (1983, p. 24) stated that financial reasons could motivate mergers. Financial synergies for a company are the benefits coming from the financial aspects of the business. According to the viewpoint of Rong Xiang and Xinping Xia (2003), the project cash flow is composed as following:
CF = EBIT + DBT - T - Cn= R - Co - T - Cn (Equation 7) Where:
EBIT = Earnings Before Interest and Taxes DBT = Depreciation Before Taxes
T = Taxes
Cn = Capital requirements R= Revenues
then: △CF =△EBIT+△DEP-△T-△Cn=△R-△Co-△T-△Cn (Equation 8) So, the calculation of the synergistic effect of the incremental cash flow △CF is decomposed into four parts: increase the revenue, reduce the product cost, tax cuts and capital requirements reductions. Thus, the pursuit of financial synergies from M&A is due to the fact that it can achieve the following financial objectives.
a) Revenue increase (△R), the increase of operating income mainly comes from marketing, strategic advantage, and the enhancement of market control power.
b) Product cost reduction (△Co), the achievement of economies of scale; the post-merger integration, coordination of related business activities is made easier as well as the realization of technology transfers, thereby reducing management costs and technology development costs; the co-ordinate use of other existing resources.
c) tax cuts (△T)
d) reducing capital requirements (△Cn )
2.4.3 Corporate Valuation (DCF) approach:
There are many approaches to estimate the synergy of M&A, one of the most famous is from Seth (1990), who measured synergy by comparing the value of the combined firm, which reflects all gains through the acquisition, with the group value of the bidder and target had there been no acquisition. Thus, the valuation of corporate become a primary task, we chose the Discounted Cash Flow approach to estimate the enterprise’ value in this paper.
V = ∑ 𝐹𝐶𝐹𝐹𝑡
(1+𝑊𝐴𝐶𝐶)𝑡
∞
𝑖=1 (Equation 9)
WACC (Weighted Average Cost of Capital) model:
WACC = 𝑅𝐸 ×𝐸+𝐷𝐸 + 𝑅𝐷(1 − 𝑡) ×𝐸+𝐷𝐷 (Equation 10)
E = Market Value of Equity D = Market Value of Debt
𝑅𝐷 = Average Interest Rate on Debt 𝑅𝐷(1 − 𝑡) = After Tax Cost of Debt
t = Income Tax Rate
In order to estimate𝑅𝐸, the Capital Asset Pricing Model (CAPM) is mainly used in this study: The capital asset pricing model (CAPM) emerged in the early 1960s. After researching the interdependence between the income securities, Lintner, (1965), Sharpe, (1964) and Mossin (196?) proposed respectively the CAPM theory which can be used to determine the individual stock expected returns, the model shows that stock expected returns and beta coefficient have linear positive correlation.
The basic formula of CAPM:
𝑅𝐸 = 𝑅𝑓+ 𝛽 × (𝑅𝑚− 𝑅𝑓) (Equation 11)
Where:
𝑅𝑓 = Risk Free rate
𝑅𝑚 = Expected Market Return β = Firm Levered Beta
𝑅𝐸 = Security Expected Return
In view of the relative high risk of Chinese capital market, companies are generally considered to be sustainable, for this purpose, generally the long-term bond interest rates issued by Government is used as being the country risk-free interest rate. Also because the bond interest rate is a single
interest rate, while the discount rate of the corporate valuation is the compound interest rate, therefore, the bond interest rate should be amended by the following formula:
𝑅𝑓 = √1 + 𝑛𝑟𝑛 − 1 (Equation 12)
Where:
𝑅𝑓 = Compound Risk Free rate n = Years of Long-term Bond
r = Single Interest Rate of Long-term Bond Estimate β:
𝑅𝑡= 𝛼 + 𝛽𝑅𝑚𝑡+ 𝑒𝑡 (Equation 13)
Where:
𝑅𝑡 = Security Return
𝛼 = Intercept
𝛽 = Firm Levered Beta 𝑒𝑡 = Error Term
𝑅𝑚𝑡 = Market Index Return
Through the historical data of the same period of the asset returns and market portfolio returns, we use linear regression equation to predict β.
This method needs a large amount of data in calculation process, if this data is not accurate, then the internal calculation model can be difficult to provide an appropriate method for the accurate measurement of synergy effect.
Moreover, this method is to evaluate the synergy effect after the M&A,that is to say, the method emphasis on the assessment of the post-merger. However, the synergy effect of M&A should be measured before the M&A, which can help us to make a decision and implement M&A smoothly.
3. Background research
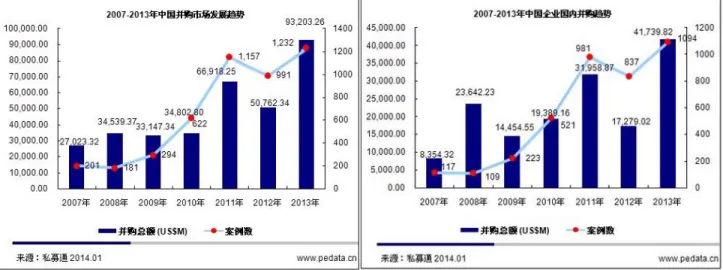
M&A in ChinaChil and Rodrigues (2005) indicated that M&A is a quick way for Chinese companies to obtain technology, security research and development skills. According to statistical data, Chinese M&A market developed rapidly from 2007 to 2013, the amount of Chinese M&A market in 2012 was
$50.762 billion, and in 2013 was $93.203 billion, year-on-year growth of 83.6%. In domestic M&A, $17.3 billion for 2012, $41.7 billion for 2013, so it increased 1.5 times.
China has a large scale of state-owned assets and a large amount of state-owned enterprises, according to the requirements of Chinese social and economic system of ownership, the government monopoly will continue as well as the control over the industries that relate to national security and that involve the lifeblood of the national economy. “China insists on the fundamental status of SOEs in the whole economy and supports them with materially beneficial policies”, Zhou, et al. (2015) proposed “the value of political connections is positive in Chinese M&A market”. The motives of Chinese state owned enterprise merger and acquisition:
1.To meet the state-owned economic structure and overall configuration. This is the most important reason for M&A of Chinese state-owned enterprises, under the traditional planned
Figure 5 Trend of M&A market of China (2007-2013) Source: 2013年中国并购市场年度研究报告(2013 Annual
Research Report of China M&A market)
Figure 4 Trend of domestic M&A of Chinese enterprise (2007-2013) Source: 2013年中国并购市场年度研究报告(2013 Annual
economy system, China adopts administrative means to allocate resources, which hinder the overall development of state-owned enterprises, made the industry resource allocation extremely dispersed and seriously wasted. State owned enterprise merger and acquisition is the need of industrial structure adjustment, in the case of the certain total amount of funds, it is the important way to optimize the industrial structure by improving the structure of enterprise capital.
2.To eliminate losses. Since the reform and open policy (1978), Chinese economy has been growing at a high speed, and on the other hand, the growth of the economy has been plagued by the deficit problem of the constantly expanding state-owned enterprises. Most of the loss-making enterprises occupy a large number of idle funds, while the good-operating enterprises cannot develop because of the restriction of funds, equipment, and sites. M&A has become a major way of eliminating these losses of state owned enterprises.
3.The need of international strategy. The state-owned large enterprises frequently merge and acquire to achieve strategic objectives for obtaining more strategically significant resources. There are no international strategic issues for our case in this study, so it is not detailed here. However, under the socialist market economy system, the government, as the ultimate owner of the state-owned assets, has influenced the M&A process of state-owned enterprise even more than the market itself. Boycko et al (1993) showed that government-owned companies would be more enthusiastic to pursue social and political purpose than to create their own value. Liu Xiaodan, CEO of the Huatai United Securities Co., Ltd, delivered a speech in September 23rd, 2014, she pointed that the current M&A market in China is still in the primary stage, and there will be a huge space for development in the future. In China, government intervention is a very common phenomenon in mergers and acquisitions. Of course we know, M&A is a natural historical process, if the enterprise, which is the subject of a merger, lacks the inherent requirements, it is not available for government to simply rely on administrative means to promote the enterprise to scale up. Besides, the merger and acquisition of enterprises should focus on the improvement of efficiency, not only the expansion of the scale. But such behaviors like blindly pursuing large-scale and diversified business, make the enterprises fall into the predicament, are not uncommon in Chinese mergers and acquisitions market.
In addition, the acquisition of Chinese enterprises through the stock market lacks of the necessary market conditions. This objective reason has greatly restricted the development of enterprise merger and acquisition activities in China, because the perfect capital market is an effective way to carry out the reorganization of enterprise assets and to realize scale expansion. Nevertheless, in the mature market, where competition is fierce and the securities market is effective, it is difficult to find if the value of a corporation is significantly underestimated, Chinese economy is in transition, therefore it should be easier to find the value of the listed corporations which are underestimated, and then improve the value of the company through mergers and acquisitions. Thus, it is impossible to reply the answer only by logic reasoning whether there is value creation in Chinese M&A, a comprehensive and in-depth empirical evidence is needed.
Pharmaceutical industry in China
The existing raw materials and pharmaceutical production enterprises in mainland China have many problems, such as the lag of development, the short supply of funds, and the high cost of production, etc.
The scales of Chinese medicine enterprises are generally small, which does not allow scale economies. According to the Shepherd classification standard of the relative market power theory, the pharmaceutical industry in mainland of China is definitely a perfect competition market, and the market concentration of Chinese pharmaceutical industry is significantly lower than that of foreign developed countries (Yang Shu-jie, Li Kai, 2009). Low market concentration will affect the ability of R&D investment. Objectively, only with a certain scale and financial strength, can enterprises withstand the cost of technology R&D and risks. Therefore, the market concentration of Chinese pharmaceutical industry needs to be further improved.
At present, Chinese pharmaceutical market is lacking price competition. We all know that before generating an effective society with maximizing social welfare and optimal level of production, the price of goods in this market would constantly rise and fall until the formation of a balanced price. There is a premise that consumers can accurately or low-costly determine the quality of goods, that is, the degree of information asymmetry in the commodity market is very low. But in Chinese pharmaceutical market, Yang Shu-jie, Li Kai (2009) mentioned the information asymmetry leads to an almost complete lack of price competition, consumers find it difficult to make a judgment on
the medical services and drug efficacy, and this is the reason for the low price elasticity of pharmaceutical products.
Mainly producing generic drugs4, lacking of new products and influential famous brands, can be a
disadvantage for Chinese pharmaceutical enterprises. We can find from product market sales information, the benefits of foreign-funded enterprises from new drug sales are huge, while the profits from generic drug sales of Chinese enterprises are very little. Moreover, foreign-funded enterprises operating in different countries and regions have already set up high brand awareness, Chinese pharmaceutical enterprises are limited in this respect.
While facing all sorts of troubles, Chinese pharmaceutical market still has a tremendous potential, a large amount of opportunities and accompanying policies make Chinese pharmaceutical market thrive rapidly.
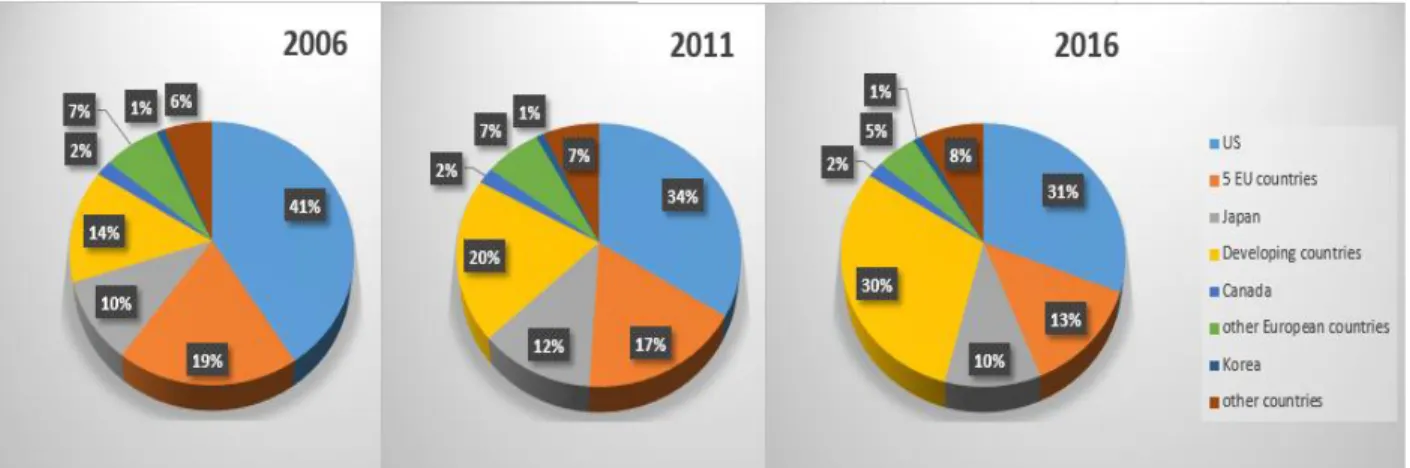
The regional consumption proportion of the world medicine market is positively related to the overall situation of the world economy. Data shows that the United States, Europe and Japan in a very long period of time have been occupying the top three positions. In 2006, the medical expenses of these three economies accounted respectively for 41%, 19% and 10% of the global market. But as the market is gradually saturated, the world's pharmaceutical giants are trying to develop new markets, with a view to being a new point of sale. IMS5 health expected that until 2016, the global
share of medical expenses of the traditional developed countries, the United States, Europe and Japan, will continue to go down or flat, and respectively be 31%, 13% and 10%. In contrast, the proportion of emerging markets for medical expenses will rise from 14% in 2006 to 30% (Figure 6 Global pharmaceutical market share), it will be a good opportunity for China to obtain economies of scale and expand market share, in fact, China is already on this road.
4 Generic drug: a special name in China which refers to conventional drugs or the drugs have been widely used for many years on clinic, it usually has some common characteristics, such as low technology, low prices, has formed the prescribing habits. Source from: Baidu cyclopedia (http://baike.baidu.com/view/1028863.htm)
5 IMS Health Inc.: Global leader in providing professional information and strategic consulting services to medical and health industry, founded in 1954.
Figure 6 Global pharmaceutical market share Source: IMS market forecasting (May, 2012)
Chinese pharmaceutical market will continue to grow rapidly, mainly due to two strong trends (view: http://www.360doc.com/content/14/0823/12/92853_404022660.shtml):
The first trend is continuing demographic change, this kind of change is driving demand growth, and Chinese population is aging: in 2020, 33% of the Chinese population will reach 50 years old or more, this ratio in 2010 was 24%; in addition, the chronic diseases are becoming more common; the number of middle class and affluent people is increasing, the number of small and medium-sized cities is also soaring, so that the popularization of modern medical treatment can be improved. At the same time, the Chinese government has promised to bear a greater proportion of national health care expenditure. In particular, the government funded health insurance has been provided to almost all Chinese citizens, these factors will drive the total expenditure of health care grow at the compound annual rate of 14% before 2010, by then, the medical expenditure will account for about 7% of Chinese nominal GDP, higher than 5.1% in 2011.
The Chinese government has set two goals for health system reform, one is to improve the efficiency of the medical service system, the other is to reduce the relative cost of the medical main elements, and drugs are the most important element.
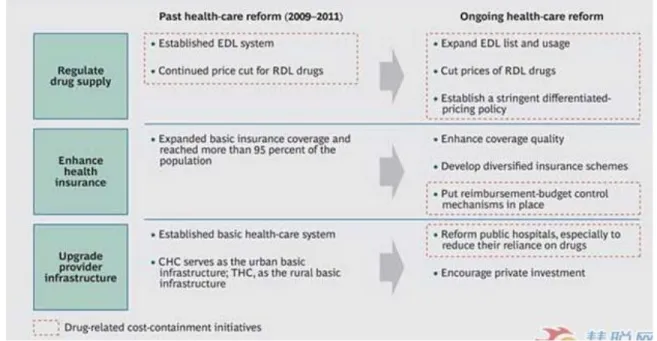
China health system reform has been conducted for many years, the influence of the reform will be reflected in the following aspects:
a. Cut the prices of drugs. The Chinese government efforts to reduce drug prices -- retail prices (the price of individual purchase of drugs) and the bid price (the price of public hospitals to buy drugs). This effort is focused on the generic drugs and the original drugs of patent expired drugs, which were previously subject to patent protection, but are now being sold without patent by the initial development enterprises. The government has paid a high premium on the patent expired original drugs since 2001.
b. Reduce the dependence of hospital on drug income. Previously, most of the hospital's revenue came from drugs, because the distorted incentives of doctors to prescribe more expensive drugs for patients. However, health care reform will reduce and eventually eliminate these distorted incentives. Reforming measures include: limiting the proportion of revenue from hospital drugs, changing the method of strategy-making of the overall drug budget, the government and hospital share the budget overruns.
c. Improve the coverage of medical insurance and the diversification of insurance plan. The Chinese government has taken effective measures to expand the coverage of basic insurance
Figure 7 Ongoing health-care reform will emphasize drug-related lost containment Source: National health and family planning commission
to the whole population. At present, more than 95% of the population has been insured. Four levels of coverage are currently available: Basic insurance, Critical illness insurance (MDI), Negotiated reimbursement, Private insurance.
Chinese Pharmaceutical Enterprises M&A
M&A of Chinese pharmaceutical industry become increasingly fierce, the Characteristics of Chinese pharmaceutical enterprises merger and acquisition collated by Li Ting and Xu Huaifu (2013) were: smaller scales and more times; mainly in horizontal M&A; government plays a promoting role. But the most outstanding characteristics of mergers and acquisitions of Chinese pharmaceutical companies in recent years is the purpose of the implementation of M&A changed from the scale expansion to the effective resource synergy, to adjust the product structure of the enterprise, to effectively integrate the resources and expand the market position. The same conclusion as in a study from Zhang Yi (2006), the internal cause of the large-scale mergers and acquisitions in Chinese pharmaceutical industry is the developing requirements of scale economy to improve the industry concentration degree; and the external causes are a series of industry consolidation policies and the pressure from foreign investment in the industry, which promotes industry internal integration to enhance resistance capabilities.
Medicine distribution industry in the Twelfth Five-year Plan6, focused on cultivating one or two
enterprise with hundred-billion value, 20 enterprises with ten-billion value, solving the problems of low industry concentration and drug-maintaining-medicine. In 2009, the market share of the top three corporations in domestic medicine distribution industry was only 23%, while this ratio in the United States was more than 50%, in Japan and Europe it was also between 90% to 80% (Beijing Morning Post, 16/12/2010).The Twelfth Five-year Plan broke the local monopoly, promoting the effective integration of medical resources, encouraging national and regional advantage-leading companies to achieve economies of scale through mergers and acquisitions. The same content is mentioned by Cheng Chunhua (2009): “mergers and acquisitions will make companies, which are small and have certain characteristics, aggregate together, to generate a few really competitive pharmaceutical enterprises in China…using policy, background, and relationships advantages…”
6 The Twelfth Five-year Plan: the Twelfth Five-Year Plan for National Economic and Social Development in People's Republic of China,
Cheng Chunhua (2009) also put forward, as capital markets mature, more and more new financial instruments will be used in the pharmaceutical industry mergers and acquisitions; more deep the overseas mergers and acquisitions; more companies need legal, financial experts and other professionals, a full range of services with the help of agencies.
4. Event study
Shanghai Pharma had implemented many M&A activities every year, we can analyze the impact of the M&A as a joint operation, using daily share data to assess the impact of each operation on the share price.
From the annual reports we have chosen three critical mergers announcements, which are exhibited as follows:
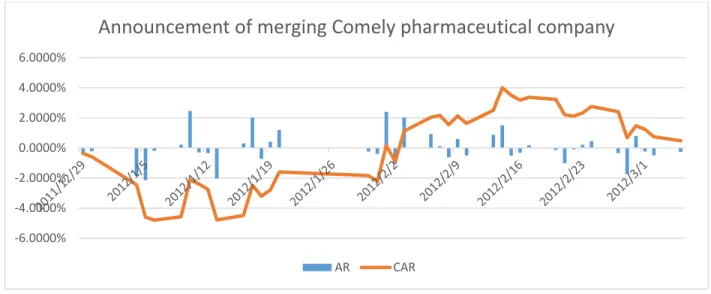
2012/2/06 announcement of merging Comely pharmaceutical company
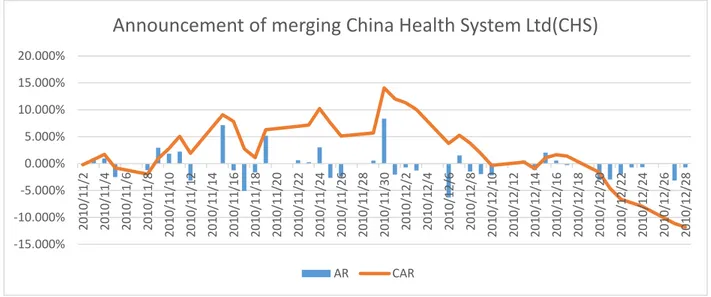
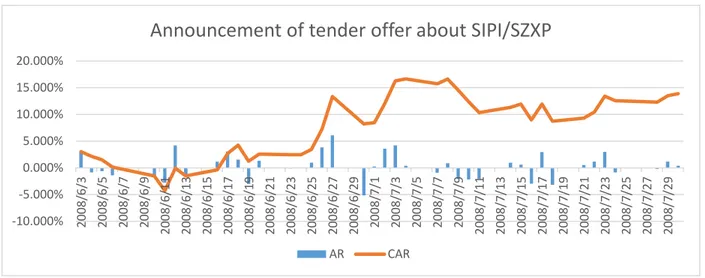
2010/11/30 announcement about the company would buy China Health System Ltd.(CHS) 2008/7/2 announcement of tender offer about Shanghai Pharma and SIPI/SZXP
We set the event window as 41 days: the announcement date is 0 day, then the event window is [-20, 20]. According to the Shanghai Composite Index (000001.SS) closed prices and Shanghai Pharma (601607.SS) closed prices, we can then do an event study analysis.
Using market model (MacKinlay 1997), it is necessary to estimate the parameters by OLS for the estimation window. The table below shows the regression results of Shanghai Pharma and Shanghai Composite Index.
Table 1 Regression results Source: Author
2012.2.6 2010.11.30 2008.7.2 βi 1.295123 0.603866 1.097526 αi -0.00092 0.002606 -0.00137
Due to the different data availability, we chose the different estimate window for each event. , we decided to use 123 observations to estimate the market model parameters for this event. According to the regression results, we could write the formula to estimate the normal returns as following:
E(R) = -0.00092+1.295123×Rm (Equation 14)
Thus, the abnormal returns can be obtained, the trend of the stock price AR and CAR for the announcement is shown below:
Figure 9 Plot of CAR and AR for announcement of merging Comely Source: Author
As showed in the figure above, the CARs basically keep steady and positive after the announcement day. But we checked in the table 2, the CARs only show significantly negative at time periods of [-17,-15] and [-11,-10], the positive values after the announcement day are not significant at all, thus we cannot say this merger activity brought the company any added value.
b. 2010/11/30 announcement about the company would buy China Health System Ltd.(CHS) The observations for the estimation window of this event are 157, according to the regression results, we could write the formula to estimate the normal returns as following:
E(R) = 0.002606+0.603866×Rm (Equation 15)
Thus, the abnormal returns is the difference between the actual return and E(Ri) at that day, the abnormal return trend is shown as following figure:
-6.0000% -4.0000% -2.0000% 0.0000% 2.0000% 4.0000% 6.0000%
Announcement of merging Comely pharmaceutical company
Figure 10 Plot of CAR and AR for announcement of merging CHS Source: Author
From figure above, the CAR line shows a trend of decline from the announcement day. We can check in the table 2, the maximum value of CAR appears at the day of the announcement (day 0), which is 14.07%, the test result is highly significant (at the significance level of 5%). The CARs of three days after day 0 are significantly positive. But CAR values for day 19 to 20 are significantly negative, which shows that the market was not optimistic about the value creation coming from the Shanghai Pharma merger with CHS.
c. 2008/7/2 announcement of tender offer about Shanghai Pharma and SIPI/SZXP
The length of the estimation window for this case is 200, the formula to estimate the normal returns is: E(R) = -0.00137+1.097526×Rm (Equation 16)
The following is the trend figure of stock price abnormal returns.
-15.000% -10.000% -5.000% 0.000% 5.000% 10.000% 15.000% 20.000% 2010/11/2 2010/11/4 2010/11/6 2010/11/8 2010/11/10 2010/11/12 2010/11/14 2010/11/16 2010/11/18 2010/11/20 2010/11/22 2010/11/24 2010/11/26 2010 /11 /28 2010/11/30 2010/12/2 2010/12/4 2010/12/6 2010/12/8 2010/12/10 2010/12/12 2010/12/14 2010/12/16 2010/12/18 2010/12/20 2010/12/22 2010/12/24 2010/12/26 2010/12/28
Announcement of merging China Health System Ltd(CHS)
Figure 11 Plot of CAR and AR for the offering announcement Source: Author
We can clearly see from the figure above, the cumulative abnormal returns rise and near to 16.7% within one or two days before and after the announcement, and maintain steady basically after that although slightly declining.
As we can see in table 2, there are five trading days where average excess returns were negative in the 20 trading days before the announcement of the plan. The maximum value of CAR comes out at the second day after the announcement, which was 16.66%, the test results are highly significant (at the significance level of 1%). Starting from the announcement day, almost all of the CAR are significantly positive.
We can conclude that the shareholders obtained positive wealth effects at this time, maybe the investors believed that Shanghai pharma can improve the industrial chain and expand the scale of assets by this plan, and further enhance the core competitiveness of the company, as a result, the stock market investors of Shanghai pharma would be very likely to increase its stake in Shanghai pharma stocks, which promoted the price rising of Shanghai pharma stocks, finally made the original shareholders of Shanghai pharma win huge wealth effect, thus from the point of view of the shareholder wealth effect, it can be seen that Shanghai pharma's short-term performance is good.
-10.000% -5.000% 0.000% 5.000% 10.000% 15.000% 20.000% 2008/6/3 2008/6/5 2008/6/7 2008/6/9 2008/6/11 2008 /6/1 3 2008/6/15 2008/6/17 2008/6/19 2008/6/21 2008/6/23 2008/6/25 2008/6/27 2008/6/29 2008/7/1 2008/7/3 2008/7/5 2008/7/7 2008/7/9 2008/7/11 2008 /7/1 3 2008/7/15 2008/7/17 2008/7/19 2008/7/21 2008/7/23 2008/7/25 2008/7/27 2008/7/29
Announcement of tender offer about SIPI/SZXP
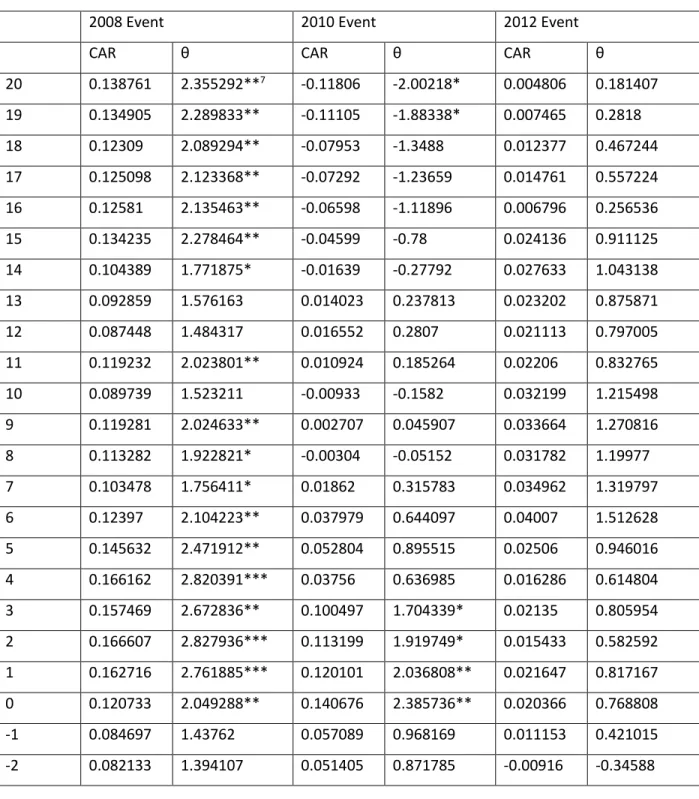
Table 2 CAR T test table Source: Author
7 *, ** And *** represent the test results significant respectively at 10%, 5% and 1% significance level; 0 represents the announcement, -1 represents one day before announcement, l represents one day after the announcement, and so on.
T test of the double tail significant
2008 Event 2010 Event 2012 Event
CAR θ CAR θ CAR θ
20 0.138761 2.355292**7 -0.11806 -2.00218* 0.004806 0.181407 19 0.134905 2.289833** -0.11105 -1.88338* 0.007465 0.2818 18 0.12309 2.089294** -0.07953 -1.3488 0.012377 0.467244 17 0.125098 2.123368** -0.07292 -1.23659 0.014761 0.557224 16 0.12581 2.135463** -0.06598 -1.11896 0.006796 0.256536 15 0.134235 2.278464** -0.04599 -0.78 0.024136 0.911125 14 0.104389 1.771875* -0.01639 -0.27792 0.027633 1.043138 13 0.092859 1.576163 0.014023 0.237813 0.023202 0.875871 12 0.087448 1.484317 0.016552 0.2807 0.021113 0.797005 11 0.119232 2.023801** 0.010924 0.185264 0.02206 0.832765 10 0.089739 1.523211 -0.00933 -0.1582 0.032199 1.215498 9 0.119281 2.024633** 0.002707 0.045907 0.033664 1.270816 8 0.113282 1.922821* -0.00304 -0.05152 0.031782 1.19977 7 0.103478 1.756411* 0.01862 0.315783 0.034962 1.319797 6 0.12397 2.104223** 0.037979 0.644097 0.04007 1.512628 5 0.145632 2.471912** 0.052804 0.895515 0.02506 0.946016 4 0.166162 2.820391*** 0.03756 0.636985 0.016286 0.614804 3 0.157469 2.672836** 0.100497 1.704339* 0.02135 0.805954 2 0.166607 2.827936*** 0.113199 1.919749* 0.015433 0.582592 1 0.162716 2.761885*** 0.120101 2.036808** 0.021647 0.817167 0 0.120733 2.049288** 0.140676 2.385736** 0.020366 0.768808 -1 0.084697 1.43762 0.057089 0.968169 0.011153 0.421015 -2 0.082133 1.394107 0.051405 0.871785 -0.00916 -0.34588
Comparing these three mergers operated by Shanghai Pharma, only the announcement of tender offer in 2008 (Shanghai Pharma and SIPI/SZXP) had positive influence on the stock price at the significant level, it could bring the short term benefits for the company.
In a relatively sound capital market, the stock price is an objective response to the future and to the current operating performance of an enterprise. However, Chinese securities market is still in a period of continuous improvement, the fluctuation of stock price is largely influenced by both the political and the technical aspects, so the stock price cannot reflect the change of the enterprise value. Therefore, the event study methodology has its limitations.
Next we mainly take this event (Shanghai Pharma and SIPI/SZXP) as a case to analyze whether the merger of Shanghai Pharma and SIPI/SZXP not only brought short-term benefits for Shanghai Pharma, but also delivered long-term synergies to both bidding and target companies.
-3 0.133565 2.267094** 0.075576 1.281706 0.001671 0.06307 -4 0.07258 1.231943 0.102148 1.732341* -0.02232 -0.84243 -5 0.034323 0.582586 0.071802 1.217694 -0.01838 -0.69398 -6 0.02455 0.416709 0.069272 1.17479 -0.01605 -0.60571 -7 0.024628 0.418021 0.063011 1.068611 -0.02798 -1.05619 -8 0.025752 0.437106 0.011348 0.192451 -0.03204 -1.20941 -9 0.012461 0.211501 0.027612 0.46828 -0.02469 -0.93216 -10 0.042576 0.722669 0.078408 1.329727 -0.04492 -1.69585* -11 0.027025 0.458707 0.090649 1.537323 -0.04792 -1.80904* -12 -0.00356 -0.0604 0.019145 0.32468 -0.02756 -1.04023 -13 -0.01508 -0.25594 0.050537 0.857064 -0.02406 -0.9081 -14 -0.00058 -0.00983 0.027984 0.474585 -0.0211 -0.79646 -15 -0.04259 -0.72298 0.009635 0.163397 -0.04575 -1.72702* -16 -0.01496 -0.25394 -0.01966 -0.33336 -0.04799 -1.81159* -17 0.001314 0.022305 -0.00774 -0.13121 -0.04605 -1.73850* -18 0.015366 0.260814 0.017217 0.291979 -0.02456 -0.92712 -19 0.021622 0.367004 0.007442 0.126201 -0.0059 -0.22256 -20 0.030212 0.512811 -0.00226 -0.0383 -0.00362 -0.13652
5. Overview of Case
Due to historical reasons, there was an overlap and cross phenomenon existed between the original three listed companies, Shanghai Pharma (600849.SS), SIPI (600607.SS) and SZXP (600842.SS), which led to the failure in fully integrating industrial resources and implementing synergies; Besides, the market value of a single listing entity is not large enough and the market position is not well because of a decentralized listing platform, such situation cannot adapt to the demands for Shanghai's development of bio-pharmaceutical strategic industry and Shanghai Pharma's own development.
Therefore, it is urgent to integrate the pharmaceutical assets through the comprehensive reorganization, to establish a unified platform for industrial resources integration and financing, relying on R&D, manufacturing, sales and industry linkage advantages, to achieve synergies of the industry resource integration.
Acquirer Company
Shanghai Pharmaceutical Co., Ltd.
Shanghai Pharmaceutical Co., Ltd. (601607.SS) is one of the largest, the most extensive and powerful pharmaceutical companies in China. Since the restructuring and listing in September 1998, the company has built important partnerships with the world’s top 20 multinational corporations, has maintained close business relationship with more than 4000 international and domestic customers, trading more than 6000 kinds of drugs.
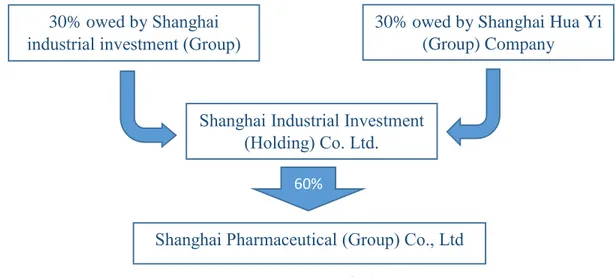
The dominant shareholder of Shanghai Pharmaceutical Co., Ltd. is Shanghai Pharmaceutical (Group) Co., Ltd. On July 1st, 2008, Shanghai State-owned Assets Supervision and Administration Commission (SASAC) decided to gratuitously transfer respectively 30% state-owned shares of Shanghai Pharmaceutical (Group) Co., Ltd, which were owned by Shanghai industrial investment (Group) Co., Ltd., and Shanghai Hua Yi (Group) Company, to the Shanghai Industrial Investment (Holding) Co. Ltd.
After the Stock rights change, Shanghai Industrial Investment (Holding) Co. Ltd held 60% shares of Shanghai Pharmaceutical (Group) Co., Ltd. While China Worldbest Group Co., Ltd held the remaining 40%. Shanghai Industrial Investment (Holding) Co. Ltd. became the indirect controlling shareholder of Shanghai Pharmaceutical Co., Ltd., such arrangement of controlling shareholder of Shanghai pharmaceutical Co., Ltd. provided a good foundation for the next merger activity of Shanghai pharmaceutical Co., Ltd.
SWOT Analysis
Table 3 SWOT matrix of Shanghai Pharma Source: Author
Strengths:
1. The largest scale, financial strength.
2. Comprehensive business covers the whole industrial chain.
3. R&D of drug including a platform of Academia Sinica as research institution and three state-level technology centers.
4. Pharmaceutical manufacturing including chemical, biological, Chinese medical, health care and chemical raw medicines, etc.
Weaknesses:
1. The majority of managers lack of market concept, not yet really established system to adapt to the market economy.
2. Generic drug dominant, specialties and leading products’ percentage is limited.
3. State-owned enterprise with many subsidiaries, it remains to
30% owed by Shanghai Hua Yi (Group) Company 30% owed by Shanghai
industrial investment (Group) Co., Ltd
Shanghai Industrial Investment (Holding) Co. Ltd.
60%
Shanghai Pharmaceutical (Group) Co., Ltd
5. Pharmaceutical distribution: the strongest ability of consumption in China.
6. Pharmacy retail: more than 1600 famous retailers.
be improved about the group resource integration within the enterprise and adjustment of industrial structure.
Opportunities:
1. Chinese medicine industrial output steadily growth year by year, the medicine business marketing grow with stability, the potential of medical market is tremendous.
2. The new health care reform policy makes the demand of drug to continue to grow, giving rise to a sharp market expansion. 3. The potential of development of TCM products trade. SO strategy a. Seize the opportunity, relying on the existing scale,
to develop
(S1,S2,O1,O2) b. Using limited funds
to expand a variety of appropriate business (S5,S6,O1) c. Increasing investment in technology,
improving the level of R&D, developing high-tech medical trade (S3,S4,O3) WO strategy a. Strengthen the adjustment of the company's business organizations (W1,O2) b. Actively develop the combined traditional Chinese and Western medicine products trade (W2,O3) c. Establish market concept, improve the operating network system (W1,W3,O1) Threats: 1. Policy pressure: NDRC issued command to reduce the medicine price many times, GMP and GSP, under the dual pressures of rising costs and declining prices.
ST strategy
a. Improve technology,
reduce costs
(S3,S4,T1)
b. Consolidate the existing status of the domestic market, WT strategy a. Actively introduce special talents, optimize capital operation (W1,W3,T3)