Efficiency of selection within sugarcane families via simulated
individual BLUP
Felipe Lopes da Silva1*, Márcio Henrique Pereira Barbosa1, Marcos Deon Vilela de Resende2, Luiz Alexandre Peternelli3
and Cássia Ângela Pedrozo4
Received 2 November 2013
Accepted 9 February 2014
Abstract – The aim of this study was to assess the efficiency of the simulated individual BLUP (BLUPIS) method in selecting genotypes within full-sib families of sugarcane in ratoon stage, through comparison with selection using the individual BLUP method. The optimal number of genotypes to be selected in the best families were established for mean stems mass, total soluble solids assay (BRIX), ton of stalks per hectare, and BRIX tons per hectare traits. Seventeen full-sib families were assessed in the Centre for Experimentation in Sugarcane, located in Oratórios, MG, Brazil. Mixed model methodology was used to predict the genotypic effects of each family and the genotypic values of each individual within family. BLUPIS method is efficient for individual selection. The optimal number of genotypes to be selected in the best family for obtaining higher efficiency of the BLUPIS method is 100 in the majority of cases. Key words: Saccharum sp., best linear unbiased predictors (BLUP), BLUPIS, selection strategies, sugarcane breeding.
Crop Breeding and Applied Biotechnology 15: 1-9, 2015 Brazilian Society of Plant Breeding. Printed in Brazil
ARTICLE
http://dx.doi.org/10.1590/1984-70332015v15n1a1
1 Universidade Federal de Viçosa (UFV), Departamento de Fitotecnia, Avenida P.H. Rolfs, 36.570-900, Viçosa, MG, Brazil. *E-mail: [email protected] 2 Empresa Brasileira de Pesquisa Agropecuária/UFV, Estrada da Ribeira, km 11, 83.411-000, Colombo, PR, Brazil
3 UFV, Departamento de Estatística
4 Empresa Brasileira de Pesquisa Agropecuária, Rodovia BR-174, km 8, Distrito Industrial, 69.301-970, Boa Vista, RO, Brazil INTRODUCTION
Individual selection at early stages in sugarcane (
Sac-charum sp.) breeding was initially based on mass selection methods (Mariotti et al. 1999), Australian sequential selection (between families, followed by mass selection) (Kimbeng
and Cox 2003), and modified sequential selection (Bressiani
et al. 2005). These last two methods use family information for selection and, therefore, are superior in relation to mass selection for traits with family mean heritability higher than individual plant heritability. Family selection has been proven to be essential in sugarcane breeding (Barbosa et al. 2004, Atkin et al. 2010, Stringer et al. 2011).
The optimal strategy for the selection of individuals in the early stages of sugarcane breeding would be through genotypic values predicted by BLUPI (Resende 2002). How-ever, this method has not been used in sugarcane breeding
due to the practical difficulties and uneconomical aspects of
obtaining data from individual plants. Otherwise, sugarcane breeding strategies have relied on family selection (Atkin et al. 2010, Stringer et al. 2011).
A practical method that resembles BLUPI was proposed
by Resende and Barbosa (2006). This selection method, called simulated individual BLUP (BLUPIS), aims to promote a dynamic allocation of the number of individuals selected per family, considering BLUP as the basis for the genotypic effects of these families. Additionally, accord-ing to the authors, by usaccord-ing the mean genotypic value of experimental plots within each progeny, BLUPIS method indicates in which replication the best individuals of each family are. BLUPIS method has been successfully applied in plant breeding (Resende et al. 2006, Oliveira et al. 2008, Farias Neto et al. 2009, Oliveira et al. 2011).
The aim of this study was to assess the efficiency of
BLUPIS method in selecting genotypes within sugarcane full-sib families in ratoon stage, through comparison with selection using BLUPI method. In parallel, the optimal number of genotypes to be selected in the best family was established for four assessed traits.
MATERIAL AND METHODS
Experimental details
These families derived from crossings performed in 2003 at the Flowering and Crossings Station, located in Serra do Ouro, city of Murici (lat 9° 13’ S, long 35° 50’ W, and alt 450-500 m asl), AL, Brazil.
Seedlings obtained from each family were transplanted, in March 2004, at the Centre for Experimentation in Sugar-cane (CECA), located in Oratórios, MG, Brazil (lat 20o 25’ S, long 42o 48’ W, and alt 494 m asl), of the Universidade Federal de Viçosa.
The trial was established in a randomized complete block design with six replications. Each experimental plot consisted in two rows spaced 1.40m apart, and plants were spaced 0.5 m apart, totalling 120 genotypes assessed per
family. Due to eventual death of genotypes, the total final
number of assessed genotypes was 1637.
Traits used to assess the efficiency of BLUPIS selec -tion method were: mean stem mass (MSM), total soluble solids assay (BRIX), tons of stalks per hectare (TSH), and BRIX tons per hectare (TBH), assessed in April 2006, at ratoon stage.
Traits individually assessed in the plot were: mean stalk height (SH) in cm, mean stalk diameter (SD) in cm, number of stalks of each genotype (NS) and total soluble solids (BRIX). Assessment at the individual level was also necessary for the genetic values of each genotype (BLUPI method) to be estimated, providing the selection of the best genotype, as well as a comparison with the selection recommended by BLUPIS method.
By using the assessed traits, it was possible to estimate the MSM variable, expressed in kg, through the estimator proposed by Chang and Milligan (1992). This
estima-tor is defined by: ,
where d is the stalk specific density, the value of which is 1.0 g cm-³, and π is expressed by approximate dimension -less value of 3.141593.
T h e T S H e s t i m a t o r o f e a c h i n d i v i d u a l w a s : , where tau is the ground area that each individual explores, expressed in m². In this work, the tau value was 0.7 m².
For the TBH characteristic, the TSH value of each in-dividual was multiplied by the corresponding BRIX value. Information at the plot level, necessary for application of BLUPIS method, was obtained through sampling of 14 random individuals of each plot per family. This number
of individuals was adopted since the total number of indi-viduals per family was low due to the high mortality rate in the experimental plots. Thus, through the means of the assessed variables in these individuals (SH, SD, NS and BRIX), it was possible to estimate the values at the plot level for MSM, BRIX, TSH and TBH, following previously described estimators.
Procedure for data analysis
Statistical analyses were performed using the mixed linear model methodology (Resende 2002) with aid of a computer program in genetics and statistics Selegen-Reml/ Blup (Resende 2007a and b).
The applied linear mixed models were
1. y = Xr + Zg + e, where y is the vector of data; r is
the vector of replication effects (assumed as fixed) summed
to the general mean; g is the vector of genotypic effects of family (assumed as random); and e is the vector of errors or residuals (random effects). Capital letters represent the incidence matrices for these effects. This model is necessary for estimating the genotypic effects of each family based on plot means, which are essential for the usage of BLUPIS selection method.
2. y = Xr + Zg + Wp + e, where y is the vector of data;
r is the vector of replication effects (assumed as fixed)
summed to the general mean; g the is vector of individual genotypic effects (assumed as random); p is the vector of random plot effects; and e is the vector of errors or residu-als (random effects). Capital letters represent the incidence matrices for these effects. This model was used as a mean to obtain the genotypic values (g) of each individual within the family necessary in the BLUPI selection method. The individual genotypic values were predicted by adjusting g to the model (2).
The variance components were obtained by the Re-stricted Maximum Likelihood (REML) method (Paterson and Thompson 1971), and were used to calculate the heri-tability at individual and family means levels, and also for obtaining the BLUP of the genotypic effects.
Simulated individual BLUP selection method (BLUPIS) The BLUPIS method (Resende and Barbosa 2006) con-sists of dynamically determining the number of individuals to be selected in each family, with no individual assessment.
The expression which determines the number nk of in-dividuals to be selected in each family k is nk = (gˆk / gˆj) nj, where: gˆjrefers to the genotypic effect of the best family;
equals the number of selected individuals in the best family. In this paper, it was considered 50, 100, and 120 individuals selected in the best family, for each characteristic, with the aim of obtaining the best performance of BLUPIS method in comparison to BLUPI.
The number of individuals (r) to be selected from each
plot is obtained from , where:
gˆparc
r is the genotypic effect of each plot of each family; u is the general mean of each characteristic; and ∑ (u + gˆk
+ gˆplot
r ) refers to the sum of genotypic values (u + gˆk +
gˆplot
r ) of all plots of family k.
Comparison between BLUPIS and BLUPI
For comparison between methods, linear regression analyses were used following the model: yi = β0 + β1xi + ei, where yi is the number of genotypes selected by BLUPI method in the ith family; x
i is the number of genotypes indi-cated for selection by the BLUPIS method in the ith family;
β0 is the intercept; β1 is the slope of the regression line; and ei is the random error of the simple linear regression. Regression analyses were performed using the software Genes (Cruz 2006).
Through these regression analyses, it was possible to
verify the efficiency of the BLUPIS selection method when
compared to selection performed by the BLUPI method, as well as to verify the optimal number of genotypes to be selected in the best sugarcane family for each assessed characteristic.
RESULTS AND DISCUSSION
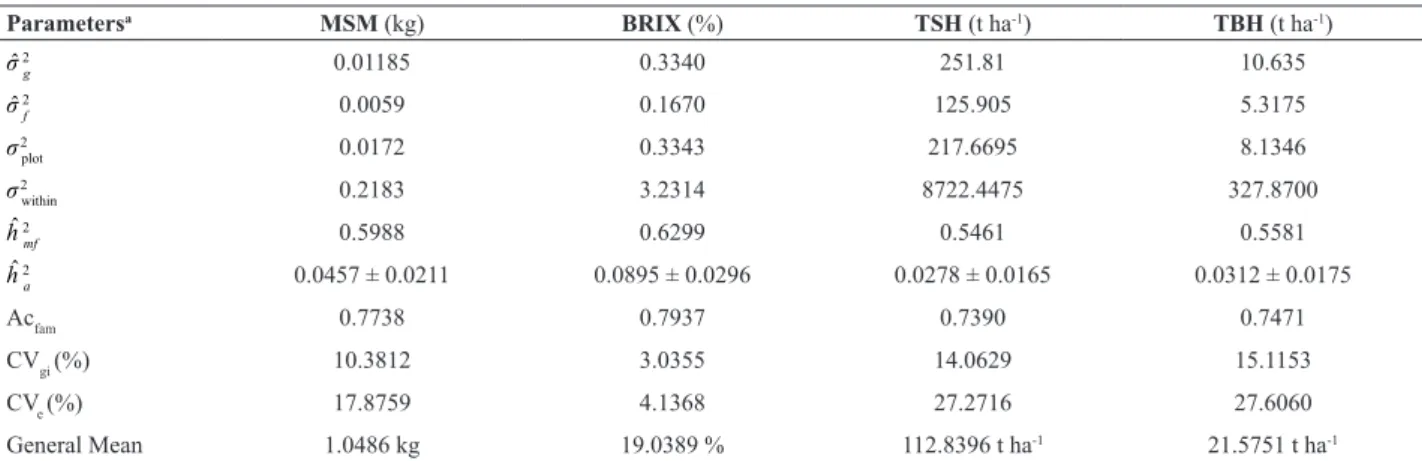
The values of the residual variation coefficients (CVe)
for MSM, TSH and TBH were of high magnitude, reflecting
high plot and within-plot variations (Table 1). For MSM and TSH, similar values were found by Barbosa et al. (2005). For BRIX, the CVe was of low magnitude, suggesting a high experimental accuracy for this characteristic.
The CVe values are an inadequate parameter for assess-ing the quality of experiments, since they do not inform the selective accuracy and do not take into account genotypic variation level or number of replications (Resende and Duarte 2007). Resende (2002) states that an adequate statistic for assessing the quality of experiments would be that which simultaneously considers the experimental variation
coef-ficient, the number of replications, and the genotypic varia
-tion coefficient. Such a parameter is the selective accuracy.
The selective accuracy values (Acfam) obtained were of high magnitude (> 0.74) (Table 1), according to the limiting values suggested by Resende and Duarte (2007), which provide family selection with great precision. Family selective accuracy values were 0.77, 0.79, 0.74, and 0.75, for MSM, BRIX, TSH, and TBH, respectively. Santos et al. (2014) to study the genetic control of resistance to rust in Eucalyptus pellita through inoculations under controlled conditions four full-sib families, found a high magnitude of the value of selective accuracy, concluding that it would be possible to obtain genetic gain with selection of resistant families for this disease.
Estimates of the narrow-sense individual heritabilities (hˆ 2
a) were of low magnitude, as expected for
quantita-Table 1. Estimates (according to model 2) of variance components and genetic parameters, for mean stalks mass (MSM), total soluble solids assay
(BRIX), ton of stalks per hectare (TSH) and BRIX tons per hectare (TBH), of 17 full-sib families of sugarcane at the ratoon stage
Parametersa MSM (kg) BRIX (%) TSH (t ha-1) TBH (t ha-1)
σˆ 2
g 0.01185 0.3340 251.81 10.635
σˆ 2
f 0.0059 0.1670 125.905 5.3175
σ 2
plot 0.0172 0.3343 217.6695 8.1346
σ 2
within 0.2183 3.2314 8722.4475 327.8700
hˆ 2
mf 0.5988 0.6299 0.5461 0.5581
hˆ 2
a 0.0457 ± 0.0211 0.0895 ± 0.0296 0.0278 ± 0.0165 0.0312 ± 0.0175
Acfam 0.7738 0.7937 0.7390 0.7471
CVgi (%) 10.3812 3.0355 14.0629 15.1153
CVe (%) 17.8759 4.1368 27.2716 27.6060
General Mean 1.0486 kg 19.0389 % 112.8396 t ha-1 21.5751 t ha-1
a Individual genotypic variance (σˆ 2
g); genotypic variance between families (σˆ 2f); environmental variance between plots (σ
2
plot); residual variance within plot (σ 2
within); family
mean heritability(hˆ 2
mf); narrow-sense individual heritability (hˆ
2
a = σˆ
2
g / ( σˆ 2f + σ
2 plot + σ
2
tive traits. However, their standard errors were of low magnitude, indicating that these heritability values were statistically different from zero, enabling the selection of
superior individuals. This significance in genetic effect was also confirmed by the deviance analysis using the
likelihood ratio test (Peternelli et al. 2011). Estimates of
hˆ 2
a were 0.05; 0.09; 0.03 and 0.03, for MSM, BRIX, TSH and TBH, respectively. After adjustment (as done by the
BLUP procedure) of the individual phenotypic values for environmental plot effects, the heritability for within-family selection was higher.
Selection via BLUPIS and BLUPI procedures
The selection of individuals via BLUPI procedure was
carried out from the classification of the predicted genotypic
value of all the assessed individuals, taking as a basis the Table 2. Genotypic effects (gˆj), number of genotypes to be selected (nk) by the BLUPIS method, and the number of genotypes selected through individual
genotypic values predicted via BLUPI, for mean stalks mass (MSM) and total soluble solids assay (BRIX), considering the number of genotypes to be selected in the best family (nj), equal to 50, 100 and 120, of sugarcane at the ratoon stage
Families gˆj (nj = 50) (nj = 100) (nj = 120)
BLUPIS (nk) BLUPI BLUPIS (nk) BLUPI BLUPIS (nk) BLUPI
MSM
97 0.1026 50 85 100 89 120 89
14 0.0966 47 84 94 108 113 109
44 0.0697 34 32 68 72 82 81
116 0.0677 33 7 66 62 79 77
22 0.0567 28 7 55 51 66 71
78 0.0328 16 1 32 12 38 17
19 0.0138 7 1 13 26 16 49
62 0.0078 4 0 8 3 9 4
33 -0.0052 0 2 0 5 0 6
112 -0.0052 0 0 0 7 0 14
82 -0.0151 0 0 0 1 0 2
98 -0.0231 0 0 0 0 0 0
121 -0.0351 0 0 0 0 0 4
123 -0.0391 0 0 0 0 0 0
76 -0.0561 0 0 0 0 0 0
48 -0.0750 0 0 0 0 0 0
109 -0.1938 0 0 0 0 0 0
Total selected 219 219 436 436 523 523
BRIX
78 0.4175 50 87 100 94 120 99
121 0.3240 39 53 78 78 93 87
33 0.2768 33 61 66 89 80 93
116 0.2589 31 6 62 48 74 55
123 0.2495 30 20 60 58 72 69
98 0.2464 30 3 59 38 71 54
22 0.1414 17 21 34 62 41 74
44 0.1162 14 7 28 34 33 47
19 0.0931 11 8 22 28 27 47
112 0.0899 11 0 22 2 26 11
109 -0.0382 0 0 0 0 0 0
76 -0.1064 0 0 0 0 0 1
97 -0.1064 0 0 0 0 0 0
48 -0.2303 0 0 0 0 0 0
62 -0.3227 0 0 0 0 0 0
14 -0.6670 0 0 0 0 0 0
82 -0.7426 0 0 0 0 0 0
same number of genotypes indicated for selection via the BLUPIS method (Tables 2 and 3).
For MSM, and considering the total number of se-lected genotypes, selection rates (total number of sese-lected individuals in the best families divided by 1637) were ap-proximately 13, 27, and 32% for njequal to50, 100, and 120, respectively. For BRIX, selection rates were 16, 32, and 39%, respectively (Table 2).
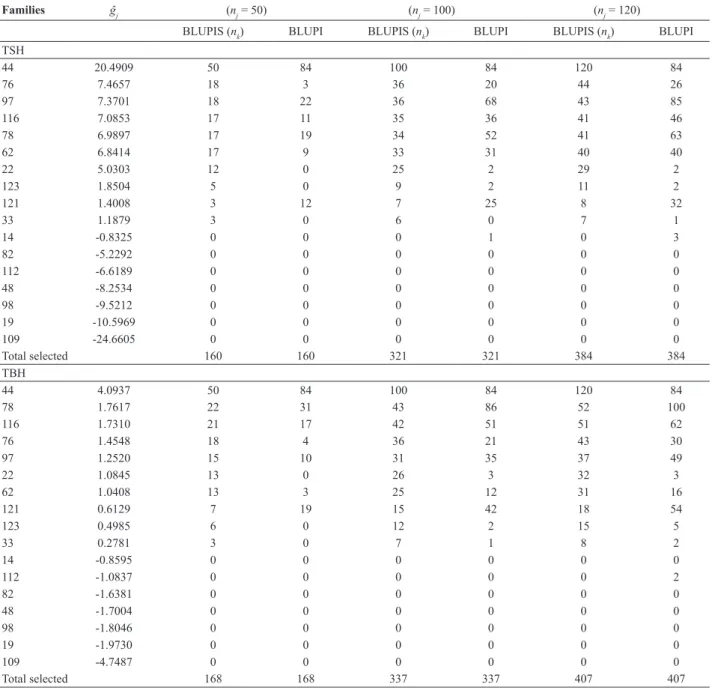
For TSH and TBH, families 14, 19, 48, 82, 98, 109, and 112 had negative values for the genotypic effect (Table 3). Therefore, these families did not contribute to the indication of genotypes to be selected by the BLUPIS method. This method automatically eliminates families with a negative genotypic effect, i.e., those which present genotypic effect lower than the general mean of the experiment. This is reasonable when the very low probability of obtaining a Table 3. Genotypic effects (gˆj), number of genotypes to be selected (nk) by the BLUPIS method and the number of genotypes selected through
indi-vidual genotypic values predicted via BLUPI, for ton of stalks per hectare (TSH) and BRIX tons per hectare, considering the number of genotypes to be selected in the best family (nj), equal to 50, 100 and 120, of sugarcane at the ratoon stage
Families gˆj (nj = 50) (nj = 100) (nj = 120)
BLUPIS (nk) BLUPI BLUPIS (nk) BLUPI BLUPIS (nk) BLUPI
TSH
44 20.4909 50 84 100 84 120 84
76 7.4657 18 3 36 20 44 26
97 7.3701 18 22 36 68 43 85
116 7.0853 17 11 35 36 41 46
78 6.9897 17 19 34 52 41 63
62 6.8414 17 9 33 31 40 40
22 5.0303 12 0 25 2 29 2
123 1.8504 5 0 9 2 11 2
121 1.4008 3 12 7 25 8 32
33 1.1879 3 0 6 0 7 1
14 -0.8325 0 0 0 1 0 3
82 -5.2292 0 0 0 0 0 0
112 -6.6189 0 0 0 0 0 0
48 -8.2534 0 0 0 0 0 0
98 -9.5212 0 0 0 0 0 0
19 -10.5969 0 0 0 0 0 0
109 -24.6605 0 0 0 0 0 0
Total selected 160 160 321 321 384 384
TBH
44 4.0937 50 84 100 84 120 84
78 1.7617 22 31 43 86 52 100
116 1.7310 21 17 42 51 51 62
76 1.4548 18 4 36 21 43 30
97 1.2520 15 10 31 35 37 49
22 1.0845 13 0 26 3 32 3
62 1.0408 13 3 25 12 31 16
121 0.6129 7 19 15 42 18 54
123 0.4985 6 0 12 2 15 5
33 0.2781 3 0 7 1 8 2
14 -0.8595 0 0 0 0 0 0
112 -1.0837 0 0 0 0 0 2
82 -1.6381 0 0 0 0 0 0
48 -1.7004 0 0 0 0 0 0
98 -1.8046 0 0 0 0 0 0
19 -1.9730 0 0 0 0 0 0
109 -4.7487 0 0 0 0 0 0
superior clone in these families is considered (Resende and Barbosa 2006).
Selection rates for njequal to 50, 100, and 120 for TSH were approximately 16, 32, and 39%, respectively, and for TBH, these rates were 19, 38, and 45%.
The number of selected individuals by family decreased progressively and slowly from 100 or 120 for the best family, to zero for the null genetic-effect family. These results
reflect the importance of the BLUPIS proce -dure in dynamically allocating the number of selected individuals per family, at the expense
of the acceptance, a priori, of fixed selection
proportions within families, as practiced in Australia (Kimbeng and Cox 2003).
For TSH and TBH, family 44 indicated the maximum number of selected individuals (nk), as a result of its outstanding genotypic effect in relation to other families. This fact suggests indication of the parents involved in this crossing for performing a recurrent selection program aimed at the accumulation of alleles favorable for these traits.
The distribution of the numbers of indi-viduals to be selected from each family via BLUPIS and BLUPI methods were similar (Table 4). This result reveals that the methods are close in this respect; thus, BLUPIS is
ef-ficient for showing the number of individuals
to be selected in each plot. For other traits, this distribution was performed in the same man-ner, considering the mean genotypic values of experimental plots within each family (data not shown).
Efficiency of the BLUPIS selection method
BLUPIS was compared to BLUPI through linear regression yi = β0 + β1xi + ei as defined before. These methods will be considered
equivalent if β0 = 0 and β1 = 1 statistically,
and if the determination coefficient is above
70%. This enables the same number of indi-viduals selected by BLUPI to be selected by this alternative method.
All regression parameter estimates (β0 and
β1), except in three situations, were not statisti- Table
4.
Distribution of the number of genotypes to be selected (n
k
) by the BLUPIS
method, and selected through individual genotypic values predicted via BLUPI within repetitions, for mean
stalks mass (MSM) considering the number of individuals to be selected in the best family (n
j
), equal to 50, 100 and 120, of sugarcane at the ratoon stage
Families ( nj = 50) ( nj = 100) ( nj = 120) BLUPIS ( nk ) BLUPI BLUPIS ( nk ) BLUPI BLUPIS ( nk ) BLUPI Repetition Repetition Repetition Repetition Repetition Repetition 1 2 3 4 5 6 1 2 3 4 5 6 1 2 3 4 5 6 1 2 3 4 5 6 1 2 3 4 5 6 1 2 3 4 5 6 97 8 a 8 8 8 8 8 13 17 11 14 13 17 17 17 17 17 17 17 13 18 13 14 14 17 20 20 20 20 20 20 13 18 13 14 14 17 14 8 8 8 8 8 8 13 11 15 17 13 15 16 16 16 16 16 16 19 17 17 20 17 18 19 19 19 19 19 19 19 17 18 20 17 18 44 6 6 6 6 6 6 5 4 7 7 6 3 11 11 11 11 11 11 10 13 11 12 13 13 14 14 14 14 14 14 13 13 12 13 16 14 11 6 5 6 5 6 5 6 1 2 1 1 1 1 11 11 11 11 11 11 11 15 9 10 8 9 13 13 13 13 13 13 12 18 11 11 11 14 22 5 5 5 5 5 5 0 1 2 0 3 1 9 9 9 9 9 9 7 10 7 9 9 9 11 11 11 11 11 11 10 12 11 12 14 12 78 3 3 3 3 3 3 0 1 0 0 0 0 5 5 5 5 5 5 3 6 1 1 1 0 6 6 6 6 6 6 3 6 1 1 4 2 19 1 1 1 1 1 1 0 0 1 0 0 0 2 2 2 2 2 2 3 7 3 5 4 4 3 3 3 3 3 3 7 11 8 10 6 7 62 1 1 1 1 1 1 0 0 0 0 0 0 1 1 1 1 1 1 0 0 1 1 0 1 1 1 1 2 2 2 1 0 1 1 0 1 33 0 0 0 0 0 0 1 0 0 1 0 0 0 0 0 0 0 0 1 1 1 1 1 0 0 0 0 0 0 0 1 1 1 2 1 0 11 2 0 0 0 0 0 0 0 0 0 0 0 0 0 0 0 0 0 0 0 1 1 1 2 2 0 0 0 0 0 0 1 1 4 2 3 3 82 0 0 0 0 0 0 0 0 0 0 0 0 0 0 0 0 0 0 0 0 0 1 0 0 0 0 0 0 0 0 0 0 0 1 1 0 98 0 0 0 0 0 0 0 0 0 0 0 0 0 0 0 0 0 0 0 0 0 0 0 0 0 0 0 0 0 0 0 0 0 0 0 0 121 0 0 0 0 0 0 0 0 0 0 0 0 0 0 0 0 0 0 0 0 0 0 0 0 0 0 0 0 0 0 1 2 0 0 0 1 123 0 0 0 0 0 0 0 0 0 0 0 0 0 0 0 0 0 0 0 0 0 0 0 0 0 0 0 0 0 0 0 0 0 0 0 0 76 0 0 0 0 0 0 0 0 0 0 0 0 0 0 0 0 0 0 0 0 0 0 0 0 0 0 0 0 0 0 0 0 0 0 0 0 48 0 0 0 0 0 0 0 0 0 0 0 0 0 0 0 0 0 0 0 0 0 0 0 0 0 0 0 0 0 0 0 0 0 0 0 0 109 0 0 0 0 0 0 0 0 0 0 0 0 0 0 0 0 0 0 0 0 0 0 0 0 0 0 0 0 0 0 0 0 0 0 0 0
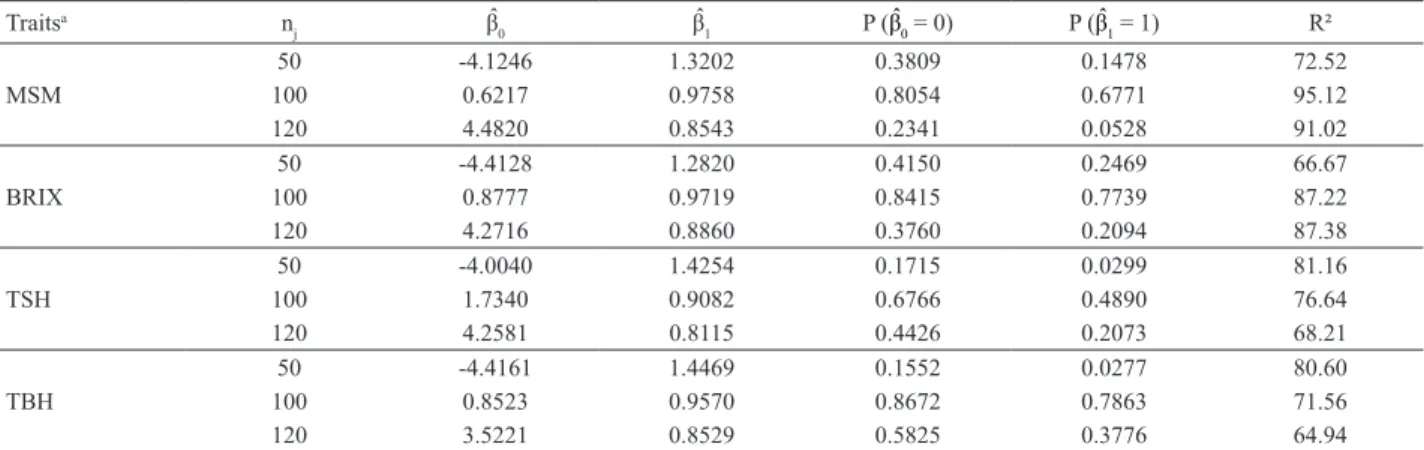
cally different from zero and from unity, respectively (Table 5). There was optimal concordance between the BLUPI and BLUPIS methods for all equations in all traits. Therefore, values of nj equal to or higher than 50 are adequate for
ef-ficient use of the BLUPIS method.
For the dataset considered in this work, the selection of 100 genotypes in the best family provided the best results
for β0, β1 and R² statistics, considered simultaneously. So, nj equal to 100 maximized the efficiency of the BLUPIS method.
According to results presented by Vencovsky (1978), with an nj equal to 100, it is possible to reach 99% of the maximum representation of a full-sib family. For a nj equal to 50, this representation would be 98%. Resende and Barbosa (2006) stated that increasing sampling within the family from nj equal to 50 contributed nearly nothing to adding different genotypes in the sample. This means that many genotype means and few extreme genotypes (including superior genotypes) are added when increasing the sample from this nj value. Thus, these authors stated that 50 individuals from the best family, mass-selected for
several restrictive traits, are sufficient to retain the best
individuals of the progeny.
Considering the results presented in Table 5 and in
Figure 1, it can be verified that the higher efficiency of the
BLUPIS selection method, as compared to the BLUPI selec-tion of the best individuals via predicted genotypic values, occurred when there was selection of 100 genotypes in the best family. In other words, the maximum concordance between genotypes selected by the two methods occurred when nj equaled 100 in six situations out of eight cases (four traits in two growth stages).
BLUPIS was efficient in the indication of the number of
individuals to be selected by each experimental plot (Table 4). Such results were also reported in Stylosanthes (Resende et al. 2006) and coconut (Farias Neto et al. 2009). However, the results obtained in this work are relevant only for this research, and it is necessary to assess a larger number of experiments for possible indications of the optimal number of individuals to be selected in the best full-sib family. If using BLUPIS suggests an optimal sample size of 100, then it would be a great misuse of time and resources, as 50 seedlings can give 98% of the variation within a family. Thus, the use of nj equal to 50 or 100 should be studied in other experiments with a larger number of families.
The present study used the number of selected indi-viduals from selected families as a criterion to compare BLUPIS and BLUPI, as these numbers might imply dif-ferent sets of clones. For BLUPI, the clones are selected by their own predicted genetic effects, so all selected clones are determined; for BLUPIS, the number only determines how many clones should be selected, and the clones still have to be chosen based on individual phenotypes of the main correlated trait with production. Such an approach approximately coincides with the within-family selection component for BLUPI, thus, the methods can, in fact, lead to the selection of almost the same set of clones.
Obviously, the accuracy of all traits in individual seedlings is not high; therefore, BLUPI itself needs to be validated. However, there is no other option for quantitative traits; one must rely on family phenotypes to predict the within-family component of the genotypic value of an individual. It is therefore reasonable to select potential clones to enter
into clone trials when there is high accuracy and sufficient
Table 5. Estimates of the regression constant (βˆ
0) and linear regression coefficient (βˆ1), and p-values (P) associated with the hypotheses H0 :β0 = 0 and
H0 :β1 = 0, and determination coefficients (R²), associated with regressions between the total number of genotypes selected in each full-sib family of
sugarcane through the individual genotypic value via BLUPI, and the total number of genotypes to be selected in each family via BLUPIS, for the assessed traits, considering the number of individuals to be selected in the best family (nj), equals to 50, 100 and 120, of sugarcane at the ratoon stage
Traitsa n
j βˆ0 βˆ1 P (βˆ0= 0) P (βˆ1= 1) R²
MSM
50 -4.1246 1.3202 0.3809 0.1478 72.52
100 0.6217 0.9758 0.8054 0.6771 95.12
120 4.4820 0.8543 0.2341 0.0528 91.02
BRIX
50 -4.4128 1.2820 0.4150 0.2469 66.67
100 0.8777 0.9719 0.8415 0.7739 87.22
120 4.2716 0.8860 0.3760 0.2094 87.38
TSH
50 -4.0040 1.4254 0.1715 0.0299 81.16
100 1.7340 0.9082 0.6766 0.4890 76.64
120 4.2581 0.8115 0.4426 0.2073 68.21
TBH
50 -4.4161 1.4469 0.1552 0.0277 80.60
100 0.8523 0.9570 0.8672 0.7863 71.56
120 3.5221 0.8529 0.5825 0.3776 64.94
precision to identify the best clones for commercial planting. ACKNOWLEDGEMENTS
To the National Council of Technological and Scientific
Development (CNPq) and to the Research Foundation of
the State of Minas Gerais (FAPEMIG) for financial sup -port to the Sugarcane Genetic Breeding Program of the Universidade Federal de Viçosa.
Eficiência da seleção dentro de famílias de cana-de-açúcar via BLUP individual
simulado
Resumo – A eficiência do método BLUP individual simulado (BLUPIS) na seleção de genótipos dentro de famílias de irmãos ger-manos de cana-de-açúcar no estágio de cana soca, comparada com a seleção utilizando o método BLUP individual, foi avaliada. O número ótimo de genótipos a serem selecionados na melhor família foi estabelecido para as características massa media de colmos, teor de sólidos solúveis totais (BRIX), tonelada de colmos por hectare e tonelada de BRIX por hectare. Foram avaliadas dezessete famílias de irmãos germanos no Centro de Experimentação em Cana-de-açúcar, localizado em Oratórios, MG, Brasil. A metodologia de modelo misto foi utilizada para predizer os efeitos genotípicos de cada família e os valores genotípicos de cada individuo dentro de família. O método BLUPIS mostrou-se eficiente para a seleção individual. O número ótimo de genótipos a serem selecionados na melhor família para obter a maior eficiência do método BLUPIS foi 100, na maioria dos casos.
Palavras-chave: Saccharum sp., melhor preditor linear não-viesado (BLUP), BLUPIS, estratégias de seleção, melhoramento de cana-de-açúcar.
REFERENCES
Atkin FC, Dieters MJ and Stringer JK (2010) Impact of depth of pedigree and inclusion of historical data on the estimation of additive variance and breeding values in a sugarcane breeding program. Theoretical
and Applied Genetics 119: 555-565.
Barbosa MHP, Resende MDV, Bressiani JA, Silveira LCI and Peternelli LA (2005) Selection of sugarcane families and parents by Reml/Blup.
Crop Breeding and Applied Biotechnology 5: 443-450.
Barbosa MHP, Resende MDV, Peternelli LA, Bressiani JA, Silveira LCI, Silva FL and Figueiredo ICR (2004) Use of REML/BLUP for the selection of sugarcane families specialised in biomass production.
Crop Breeding and Applied Biotechnology 4: 218-226.
Bressiani JA, Vencovsky R and Burnquist WL (2005) Modified Sequential
Selection in sugarcane. Proceedings of International Society of
Sugarcane Technologists. ISSCT,Guatemala, p.459-467.
Chang YS and Milligan SB (1992) Estimating the potential of sugarcane families to produce elite genotypes using univariate cross prediction methods. Theoretical and Applied Genetics 84: 662-671.
Cruz CD (2006) Programa Genes: versão Windows - Biometria. Editora UFV, Viçosa, 381p.
Farias Neto JT, Lins PMP, Resende MDV and Muller AA (2009) Seleção genética em progênies híbridas de coqueiro. Revista Brasileira de
Fruticultura 31: 190-196.
Kimbeng CA and Cox MC (2003) Early generation selection of sugarcane families and clones in australia: a review. Journal American Society
of Sugarcane Technologists 23: 20-39.
Mariotti JA, Cuenya MI and Salas MBG (1999) Análisis de componentes familiares e intra-familiares em progênies de combinaciones biparentales de cana de azucar (Saccharum spp.). Revista Industrial
y Agrícola de Tucumán 76: 52-57.
Oliveira RA, Daros E, Bespalhok-Filho JC, Zambon JLC, Ido OT, Weber H, Resende MDV and Zeni-Neto H (2008) Selecao de familias de cana-de-acucar via modelos mistos. Scientia Agraria 9: 269-274.
Oliveira RA, Daros E, Resende MDV, Bespalhok-Filho JC, Zambon JLC, Souza TR and Lucius ASF (2011) Procedimento Blupis e selecao massal em cana-de-acucar. Bragantia 70: 796-800.
Patterson HD and Thompson R (1971) Recovery of inter-block information when block sizes are unequal. Biometrika 58: 545-554.
Peternelli LA, Resende MDV and Paula TO (2011) Experimentação e análise estatística em cana-de-açúcar. In Santos F, Borém A, Caldas C (Org.) Cana-de-Açúcar: bioenergia, açúcar e etanol - tecnologias
e perspectivas. 2nd ed., Editora UFV, Viçosa, p. 333-353.
Resende MDV (2002) Genética biométrica e estatística no melhoramento
de plantas perenes. Embrapa Informação Tecnológica, Brasília, 975p.
Resende MDV (2007a) Matemática e estatística na análise de
experimentos e no melhoramento genético. Embrapa Florestas,
Colombo, 591p.
Resende MDV (2007b) Selegen-REML/BLUP: sistema estatístico e
seleção genética computadorizada via modelos lineares mistos.
Embrapa Florestas, Colombo, 359p.
Resende MDV and Barbosa MHP (2006) Selection via simulated Blup base on family genotypic effects in sugarcane. Pesquisa Agropecuária
Brasileira 41: 421-429.
Resende MDV and Duarte JB (2007) Precisão e controle de qualidade em experimentos de avaliação de cultivares. Pesquisa Agropecuária
Tropical 37: 182-194.
Resende RMS, Resende MDV, Laura VA, Jank L and Valle CB (2006) Genotypic evaluation of accessions and individual selection in Stylosanthes spp. by simulated BLUP method. Crop Breeding and
Applied Biotechnology 6: 253-260.
KC and Alfenas AC (2014) Resistance of Eucalyptus pellita to rust
(Puccinia psidii). Crop Breeding and Applied Biotechnology 14:
244-250.
Stringer JK, Cox MC, Atkin FC, WEI X and Hogarth DM (2011) Family
selection improves the efficiency and effectiveness of selecting
original seedlings and parents. Sugar Tech 13: 36-41.
Vencovsky R (1978) Effective size of monoecious populations submitted