Avaliação da Satisfação com os Cuidados Anestésicos
Satisfaction with Anesthesia Care
Ana S Cunha1, Joana I Mourão2, Joselina P Barbosa3, Catarina C Costa4 Maria A Ferreira5
1
Student of 6th grade of Faculty of Medicine of Porto, corresponding author
2
PhD, Department of Anesthesia, Hospital São João EPE Porto, 4200-319 Porto,
Portugal 3
MD in Public Health, Department of Education, Hospital São JoãoEPE Porto,
4200-319 Porto, Portugal 4
Resident Physician, Department of Anesthesia, Hospital São João EPE Porto
5
Cathedratic Professor,Department of Education, Faculty of Medicine of Porto.
Corresponding author:
Ana Sofia Miguel da Cunha
Maria Feliciana Street, entrance 31, 2º A, 4465-280 São Mamede de Infesta
For other authors:
Professor Hernâni Monteiro Lane
4200-319 Porto
Abstract
Patients’ satisfaction is considered an important indicator of health care outcome and is quickly providing a closer look to our anesthesia practice. Our aim is to apply a
validated questionnaire by Moura et al.: “Heidelberg Peri-Anesthetic Questionnaire” on
patients’ receiving elective procedures in vascular, plastic and general surgery and study
the influences of their social-demographic and clinical characteristics on satisfaction
outcome.
The patients were given the32-item consensus version questionnaire, by a
member of the study who did not intervene in the patient’s anesthesiology team.
A heterogenic sample was used and we found that a four dimensions
questionnaire suited better than the five presented originally. The results revealed that
all items contribute to instrument internal consistency (Cronbach’s α 0,614-0,826). The
highest satisfaction was associated with Team Dimension (D1, mean=90,8; ST±=12,0)
and the lowest satisfaction with Discomfort (D4, mean=62,1; ST±=21,9). Univariate
analysis found compelling influences of gender, school education, previous consult and
surgical service in three domains. Moreover, after a multiple linear regression analysis,
gender showed influence on Discomfort (D4) and Anxiety/Fear (D2), with men
showing less fear (β=11,5; CI 95%: [3,2;19,8]) and less discomfort (β=14,8; CI 95%: [8,2;21,5]). Also, less literate patients were more satisfied with D1 (β=5,8; CI 95%:
Globally we can determine that patients are satisfied with their anesthesia care
and this questionnaire could easily be used in a day-to-day basis and could give a
reliable feedback on the anesthesiologists’ performance.
Keywords: Satisfaction; Anesthesia; Questionnaire; Surgery; Perioperative
Introduction
The Royal College of Anesthetists states that “Reliable patient feedback will be a valuable indicator and source of supporting information of certain professional skills
for appraisal and revalidation” [1].
Evaluation of healthcare is essential for quality improvement of services, but
assessments usually give preference to technical and physiological reports of outcome.
[2] The statement above reflects the importance of both technical and non-technical
dimension of outcome. The technical outcome measures the abilities and skills of
professionals and diagnostic or therapeutic procedures, whereas the non-technical
dimension relates to a newly emerging concept in Anesthesia, the patients’ subjective experience: satisfaction [3]. In fact, the majority of papers, published to date in this field
of knowledge, compare anesthesia-related incidents and complications and not the
quality of outcome, viewed as the satisfaction measure. [4]
Satisfaction is defined as a complex concept, including physical, emotional,
mental, social and cultural factors. It is now regarded as a valid measure of outcome of
healthcare, as it influences patients’ compliance with procedures, treatments,
relationship with physicians, among others. [5] As a complex concept, in anesthesia this
is further intensified by the effect of drugs on cognition, short time interval of the
satisfaction, based on the theory of expectations, depends on the congruence between
patients’ expectations and reality. [6]
Anesthesiologists have been working for more than 40 years in the purpose of
developing objective measures of patient satisfaction, though there is still lack of
uniformly accepted methods for this evaluation. [7]
This study builds on important previous efforts made by Schiff et al., for
measuring of patient satisfaction with perioperative services and takes as a foundation a
38-item pilot questionnaire designed as a psychometrically model, which has been
proved as a valid and reliable tool. [8]
The questionnaire developed by Schiff et al., does not directly ask patients if
they are satisfied with different aspects of care, but instead if certain events occurred
during the course of the perioperative period. The events mentioned were proven to
address important issues to patients, based on qualitative in-depth interviews with
patients and focus group. [8]
Our aim is, regarding the “Heidelberg Peri-Anesthetic Questionnaire” developed by Schiff et al [8] and the Portuguese validation study [9] conducted by Moura et al., to
namely his multidimensional character. Furthermore, our goal consists in evaluating the
influence of social-demographic and clinical characteristics, such as pre-operative
Materials and Methods
Instrument
The “Heildberg Peri-Anesthetic Questionnaire” is a questionnaire developed by Schiff et al [8], to assess patients’ peri-anesthetic satisfaction. This questionnaire
consists of 38 items that were rated for preference on a four-point Likert scale (from 1 –
unimportant - to 4 -very important). Factor analyses identified 5 dimensions to which
every question could be assigned [8]: Trust and Atmosphere; Fear; Discomfort;
Treatment by Personnel; and Information and Waiting. Internal consistency was
demonstrated for the 5 factors (dimensions), with a Cronbach’s α: 0,42-0,79.
Regarding avalidation study for Portuguese language developed by Moura et al.
[9] we proceeded to study the psychometric properties of “Heidelberg Peri-Anesthetic Questionnaire”, in 111 patients in General Surgery, emerging only 3 dimensions, with a Cronbach’s α between 0,776-0,875 and a total explained variance of 42,6%.
Seven out of 39 items of the questionnaire were excluded for presenting low
commonality values.
Our aim is to apply a validated questionnaire by Moura et al. [9] on patients’
receiving elective procedures in vascular, plastic and general surgery and study the
influences of their social-demographic and clinical characteristics on satisfaction
outcome. As suggested in the previous study [9], we added an item to the quality of sleep after surgery. The instrument employment used Schiff et al recommendations [8].
Sample size was determined by the number of participants needed for the
development of factor analyses, using the recommendation of 5 participants per each
item. [10]
After approval by the Hospital’s Ethics Committee, informed consent was obtained from all patients. The hospital of our study covers a population of 3 million
people and has 1124 beds.
Within 12-24 hours after surgery, patients were given the32-item consensus
version questionnaire by a member of the study. The anesthesiology team responsible
for the patient did not have any knowledge of the study. Patients were informed that
they could, at any moment, refuse their participation in the survey, with no burden on
the medical care they received. For confidentially purposes, codification of the
complete questions or to participate in the study. To maximize the return rate, all
questionnaires were administered and collected before patients left the hospital.
Questionnaires were delivered every Tuesday through Saturday from 9th July to the end
of October.
The inclusion criteria comprised: age older than 18 years, ability to read and
write Portuguese and elective surgery in one of three services (Vascular Surgery,
General Surgery and Plastic Surgery).
Out patients and those cognitively impaired or unable to read and write
Portuguese were excluded. For each patient following data was collected: gender, civil
state, highest education level, previous surgeries, type and duration of anesthesia, the
existence or absence of a previous anesthesia consult, ASA physical state, surgical risk,
time between end of surgery and questionnaire fulfill and the time consumed in
completing the questionnaire.
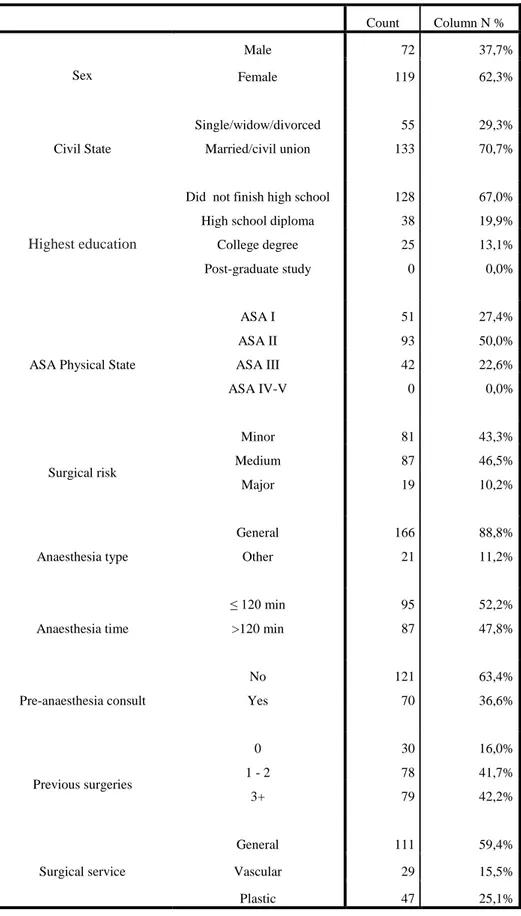
In this study participated 192 patients and their social-demographic and clinical characteristics can be assessed in table 1.
Cronbach’s α was calculated for item internal consistency and exploratory factor analysis (EFA) was performed to determine item structure relation. We chose to replace the missing values by mean values to reinforce data analyses. The dimensions were determined after varimax-rotation [11] and the number of dimensions to retain was established by Scree Plot criteria.
To assess EFA adequacy we used Kaiser-Meyer-Olkin (KMO) test and The Bartlett Sphericity test. [12] Only items with factorial load ≥ 0,35 were included in dimensions. Items whose factorial loads were below 0,35 and commonality values below 0,2 were rejected.
Items with negative meaning had reverse score. Score for each dimension was obtained as the sum of the answers for each item that compose that dimension and converted as a percentage (0-100%). Maximum value (100%) represents maximum satisfaction in a dimension.
Data was summarized with mean and standard deviation (SD±). Univariate analysis was performed between patient’s characteristics and dimensions found. To estimate the difference significance between mean values of the dimensions and social-demographic and clinical values we used T-student test and Variance Analysis.
Variables that revealed significance for p<0.20 in univariate analyses were included in a multiple linear regression model. Relation between patients’
characteristics and dimensions was determined by regression coefficients and respective
confidence intervals 95% (CI 95%).
For statistical analysis we used the software Statistical Package for the Social
Sciences (SPSS) version 20.0. A value of p < 0.05 was considered statistically
Results
Construct Validity and Internal Consistency
Initially we verified if item distribution suited 5 dimensions such as found by
Schiff [8]. However, the 5 dimension solution like it was presented in the original
version of the scale proved to be inadequate, as the 5th dimension would be composed of
only two items with different theoretical contents, reason why we preferred the 4
dimension solution.
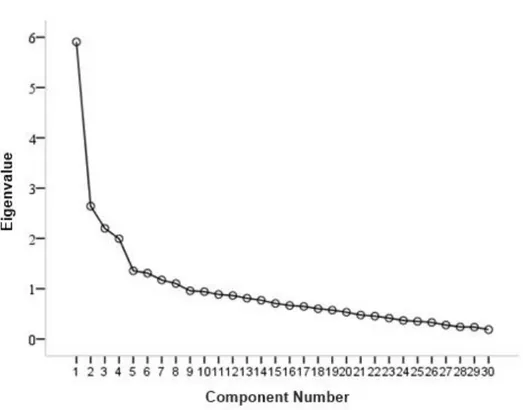
Analysis of the Scree Plot graphic (Figure 1) suggested, in a more clear way, the
4 dimension solution proves to be more accurate.
Bartlett Sphericity test showed statistic significant results (p <0,001), indicating the items shared a common variance and KMO measure was 0,767, suggesting the
variables measured more than one component. [12]
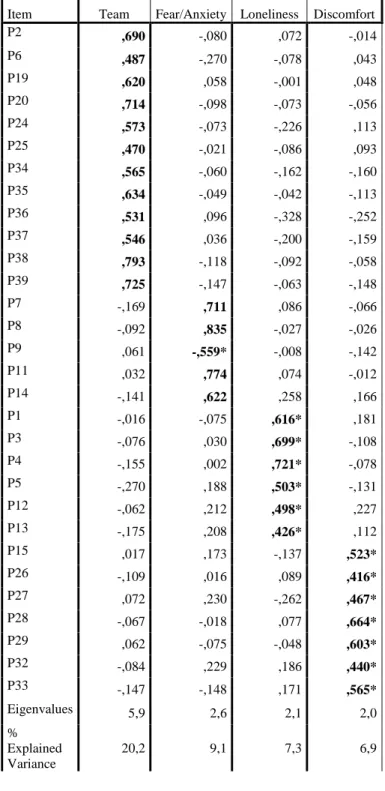
The validated scale remained with 30 items that had an expressive load in just
one dimension. We excluded 8 items that obtained commonality values <0,2 and factor
The four dimension solution explained 43,5% of total variance. The 1st principal
component with eigenvalue of 5,9 explained 20,2% of total variance. The 2nd principal
component with eigenvalue of 2,6 explained 9,1% of variance. The 3rd principal
component with eigenvalue of 2,1 explained 7,3% of variance and the 4th with
eigenvalue of 2,0 explained 6,9% of variance, resulting in 43,5% of explained variance.
(Table 2)
The results obtained revealed that all items contribute to instrument consistency.
Cronbach’s α coefficient values for 4 dimensions presented consistency internal indexes between 0,614 and 0,826: D1 (Dimension 1) (α = 0,826), D2 (Dimension 2) (α = 0,776);
D3 (Dimension 3) (α = 0,665) e D4 (Dimension 4) (α = 0,614).
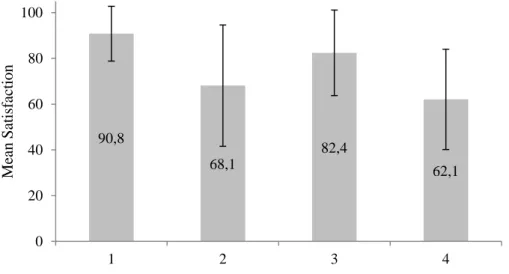
Peri-anesthetic satisfaction
Considering the 4 dimension mean, in a scale from 0 to 100 points, we verified
the dimensions presented the following mean values: D1 (mean=90,8, ST±=12,0); D2
(mean=68,1, ST±= 26,5); D3 (mean=82,4; ST±=18,7); D4 (mean=62,1; ST±=21,9)
Effect of social-demographic and clinical characteristics in peri-anesthetic satisfaction
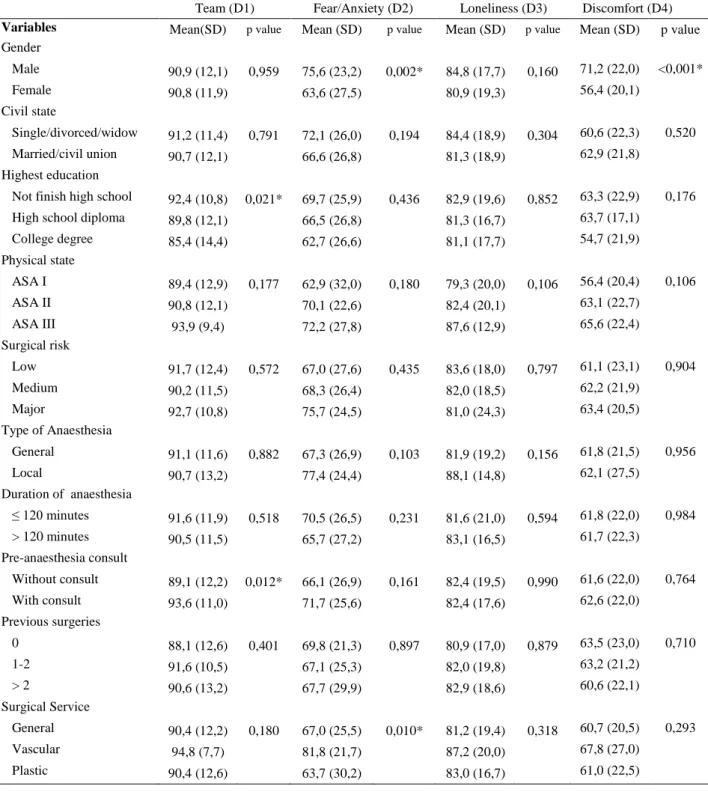
Univariate analyses demonstrated D1 dimension is influenced by highest
education level (p=0,021) and pre-anesthetic consultation (p=0,012). D2 is influenced
by gender (p=0,002) and surgical service (p=0,010). D4 is influenced by gender
(p<0,001). (Table 3)
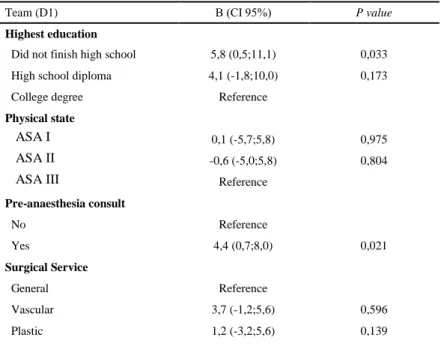
After multivariate analysis, highest level of education and pre-anesthetic
consultation maintained a significant effect in D1 domain. Patients which did not finish
high school were more satisfied with D1 compared with graduate and post-graduate
patients (β=5,8; CI 95%: [0,5;11,1]). Correspondingly, patients that attended a
pre-anesthetic consult had higher levels of satisfaction in D1 (β=4,4; CI 95%: [0,7;8,0]).
(Table 4)
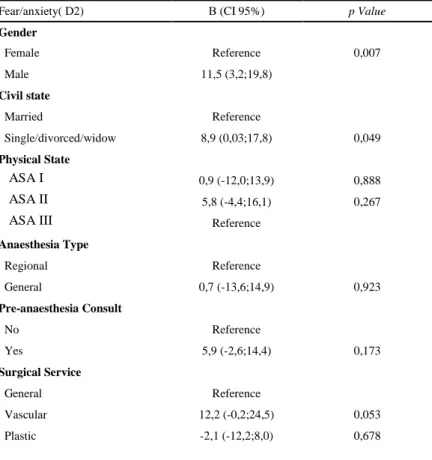
After multivariate analysis, gender and civil state maintained the significant
effect in D2. Men felt less fear than women (β=11,5; CI 95%: [3,2;19,8]). Furthermore,
singles also felt braver than married patients (β=8,9; CI 95%: [0,03;17,8]). (Table 5)
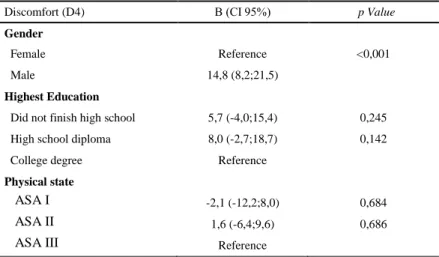
Posterior to multivariate analysis, only gender provided a significant effect on
Discussion
Patient satisfaction is an important indicator of health care outcome and provides
an insight of service quality in anesthesiology. As competition increases for patients in
our career, satisfaction appears as a very important concept. [13]
Furthermore, as patient satisfaction is proved to correlate with patient behaviors
and compliance, more satisfaction will probably mean improved continuity of care.
[13]
Many studies emphasized lack of standardized and valid instruments to assess
patient satisfaction in anesthetic care. [6] The development of satisfaction
questionnaires is relatively recent, as patient satisfaction was acknowledged as an
indicator of the quality of practice for specialties such as anesthesia. Therefore, these
questionnaires should be used to assess patient satisfaction as an outcome of anesthesia
care. [6]
Most of previous projects to develop questionnaires on patient satisfaction paid
little or no attention to involvement of patients when developing the question items and
used single-item questions and yes/no or Likert response formats, which have yielded
When multi-item scales are used, we can achieve more discrimination. [3]
However, lower scores are significant only if those items represent the determinants
most important to patient satisfaction, which is represented by content validity.
Otherwise, evaluations reproduce only the biases of the physicians who constructed
them. [6]
The “Heidelberg Peri-Anesthetic Questionnaire” has undergone validation at
three different hospitals [8]. Besides considering potential confounding variables and
cognitive methods, it puts emphasis on patients’ concerns.
This original questionnaire was previously translated to Portuguese language and
validated in another study [9]. We decided to proceed with this validated study and
explore the effects of different social-demographic and clinical factors on satisfaction in
anesthesia practice.
As we used a more heterogenic sample than Moura et al., we found 4
dimensions which suited better than the 5 dimensions presented by Schiff et al [8],
The questionnaire in this study was given to Portuguese patients in Hospital de
São João EPE, Porto.
The results of confounding variable analysis showed that there are statistical
significant relationships between pre-anesthetic consult, highest school education,
gender and civil state and different dimensions. In literature, the effects of these
characteristics on satisfaction are inconsistent.
In a recent European study [14], regarding fear and anxiety with anesthetic
experience, there were no significant differences regarding gender, age, literacy and
previous surgeries, which is similar to our study (Fear and Anxiety = D2).
Regarding gender, we realized men are more satisfied when compared to women
only on D2 and D4, reproducing the results of Moura et al, which also displayed better
values for men only in these two dimensions. We also established a correlation between
pre-anesthesia consults and D1, evidencing these patients were more satisfied due to
communication and better doctor-patient relationship. In Moura et al [9], values of
satisfaction on D1 are also significantly influenced by pre-anesthesia consult, although
we found a more sustained evidence (p=0,012 in our study vs p=0,040 in Moura et al.).
Therefore, this proved to be an accurate and strong conclusion in both studies. In our
study, D1 is also influenced by highest education, supporting that the higher education
that has proven its influence on the results and should therefore be regarded in future
studies, as a potential confounding factor.
There was no significant effect of type and duration of anesthesia, pointing the
satisfaction was universal regarding the different procedures. We also did not find
relationships between surgical service, surgical risk and satisfaction, and, more
surprisingly, there was no significant effect of ASA physical state on each satisfaction
dimension. However, many previous studies supported a positive correlation between
health status and satisfaction. [4]
As in other studies [14] we did not prove a significant correlation between the
results and number of previous surgeries.
The authors of the original scale [8] and Moura et al [9] noted patients submitted
to regional anesthesia had some limitations filling the questionnaire, a bias not sustained
in our work.
The results here displayed support that this questionnaire could easily be used in
a day-to-day basis and could give a reliable feedback on anesthesiologists performance,
However, we should also notice that high levels of satisfaction are found in
many studies, independently of the evaluation instrument for satisfaction used. Fung et
al [6] referred satisfaction could be perceived as a sense of gratitude towards the
medical staff. In fact, “social desirability bias” is a recognized concept that transmits the tendency of respondents to answer questions in a manner that will be viewed favorably
by other. This bias poses a serious problem with our study and others alike, interfering
with interpretation of results. To minimize this “social desirability bias” we followed Moura et al [9] recommendations and the questionnaire was given to the patient by a
member of the study, who did not intervene in the anesthesia care. Also, the patient was
left alone filling the questionnaire.
Our study also presents limitations: the small sample size (192 patients)
probably contributed to a low power to detect differences between dimensions and
effects of variables. Although promising and consistent with previous results shown by
Moura et al. [9] in the same hospital, other studies should be conducted in larger
samples and other Portuguese hospitals.
Further studies are then needed to confirm these effects and validate this
instrument to other Portuguese hospitals. As Schiff et al suggested [8] we could also
cross-validate this questionnaire with others regarding aspects such as social
desirability, hospital stay and surgery aspects (wound infection, etc), improving its
of satisfaction will be recognized with detailed research with patients either in-hospital
References
1. Revalidation. The Royal College of Anesthetists. http://www.rcoa.ac.uk/index.asp?PageID=1393
2. Jenkinson C, Coulter A, Bruster S, Richards N, Chandola T. Patients’
experiences and satisfaction with health care: results of a questionnaire study of specific aspects of care. Qual Saf Health Care 2002;11:335–339
3. Heidegger, T. Patient-centred outcomes in clinical research: does it really matter? British Journal of Anesthesia 2008; 100 (1): 1–3
4. Heidegger T, Husemann Y, Nuebling M, et al. Patient satisfaction with
anesthesia care: development of a psychometric questionnaire and
benchmarking among six hospitals in Switzerland and Austria. British Journal of
Anesthesia. 2002: 89 (6): 863±72
5. Auquier P, Pernoud N, Bruder N, et al. Development and Validation of a Perioperative Satisfaction Questionnaire. Anesthesiology 2005; 102:1116–23 6. Fung, D Cohen, M. Measuring Patient Satisfaction with Anesthesia Care: A
review of current methodology. Anesth Analg 1998;87:1089-98
7. Neuman M. Patient satisfaction and value in Anesthesia Care. Anesthesiology
2011; 114:1019 –20
8. Schiff JH, Fornaschon AS, Frankenhauser S, et al. The Heidelberg
Peri-anesthetic Questionnaire: Development of a new refined psychometric questionnaire. Anesthesia 2008; 1096–1104
9. Moura C, Barbosa J, Mourão J, Ferreira MA. Patient Satisfaction with
10. Tamaka JS. How big is big enough? Sample size and goodness of fit in
structural equation models with latent variables. Child Development 1987;
58:134-46.
11. Lienert GA, Ratz U. Testaufbau und Testanalyse. Weinheim BELTZ, 1998. 12. Kaiser HF. An index of factorial simplicity. Psychometrika 1974; 39:31-5. 13. Klock A, Roizen MF. More or Better-Educating the patient about the
anesthesiologist’s role as perioperative physician. Anesth Analg
1996;83:671-2671
14. Mavridou, P, Dimitriou V, Manataki A, Arnaoutoglou E, Papadopoulos G.
Patient's anxiety and fear of anesthesia: effect of gender, age, education, and previous experience of anesthesia. A survey of 400 patients. J Anesth, 2013.
27(1): p. 104-8.
15. Rahmqvist, M., Patient satisfaction in relation to age, health status and other
background factors: a model for comparisons of care units. Int J Qual Health
Count Column N % Sex Male 72 37,7% Female 119 62,3% Civil State Single/widow/divorced 55 29,3% Married/civil union 133 70,7% Highest education
Did not finish high school 128 67,0%
High school diploma 38 19,9%
College degree 25 13,1%
Post-graduate study 0 0,0%
ASA Physical State
ASA I 51 27,4% ASA II 93 50,0% ASA III 42 22,6% ASA IV-V 0 0,0% Surgical risk Minor 81 43,3% Medium 87 46,5% Major 19 10,2% Anaesthesia type General 166 88,8% Other 21 11,2% Anaesthesia time ≤ 120 min 95 52,2% >120 min 87 47,8% Pre-anaesthesia consult No 121 63,4% Yes 70 36,6% Previous surgeries 0 30 16,0% 1 - 2 78 41,7% 3+ 79 42,2% Surgical service General 111 59,4% Vascular 29 15,5% Plastic 47 25,1%
Table 1- Distribution of patients’ Social-Demographic and Clinical characteristics.
Item Team Fear/Anxiety Loneliness Discomfort P2 ,690 -,080 ,072 -,014 P6 ,487 -,270 -,078 ,043 P19 ,620 ,058 -,001 ,048 P20 ,714 -,098 -,073 -,056 P24 ,573 -,073 -,226 ,113 P25 ,470 -,021 -,086 ,093 P34 ,565 -,060 -,162 -,160 P35 ,634 -,049 -,042 -,113 P36 ,531 ,096 -,328 -,252 P37 ,546 ,036 -,200 -,159 P38 ,793 -,118 -,092 -,058 P39 ,725 -,147 -,063 -,148 P7 -,169 ,711 ,086 -,066 P8 -,092 ,835 -,027 -,026 P9 ,061 -,559* -,008 -,142 P11 ,032 ,774 ,074 -,012 P14 -,141 ,622 ,258 ,166 P1 -,016 -,075 ,616* ,181 P3 -,076 ,030 ,699* -,108 P4 -,155 ,002 ,721* -,078 P5 -,270 ,188 ,503* -,131 P12 -,062 ,212 ,498* ,227 P13 -,175 ,208 ,426* ,112 P15 ,017 ,173 -,137 ,523* P26 -,109 ,016 ,089 ,416* P27 ,072 ,230 -,262 ,467* P28 -,067 -,018 ,077 ,664* P29 ,062 -,075 -,048 ,603* P32 -,084 ,229 ,186 ,440* P33 -,147 -,148 ,171 ,565* Eigenvalues 5,9 2,6 2,1 2,0 % Explained Variance 20,2 9,1 7,3 6,9
Table 3 – Comparison of Satisfaction Scores according to Social-Demographic Data
and Clinical Characteristics
Variables Mean(SD) p value Mean (SD) p value Mean (SD) p value Mean (SD) p value
Gender Male 90,9 (12,1) 0,959 75,6 (23,2) 0,002* 84,8 (17,7) 0,160 71,2 (22,0) <0,001* Female 90,8 (11,9) 63,6 (27,5) 80,9 (19,3) 56,4 (20,1) Civil state Single/divorced/widow 91,2 (11,4) 0,791 72,1 (26,0) 0,194 84,4 (18,9) 0,304 60,6 (22,3) 0,520 Married/civil union 90,7 (12,1) 66,6 (26,8) 81,3 (18,9) 62,9 (21,8) Highest education
Not finish high school 92,4 (10,8) 0,021* 69,7 (25,9) 0,436 82,9 (19,6) 0,852 63,3 (22,9) 0,176 High school diploma 89,8 (12,1) 66,5 (26,8) 81,3 (16,7) 63,7 (17,1)
College degree 85,4 (14,4) 62,7 (26,6) 81,1 (17,7) 54,7 (21,9) Physical state ASA I 89,4 (12,9) 0,177 62,9 (32,0) 0,180 79,3 (20,0) 0,106 56,4 (20,4) 0,106 ASA II 90,8 (12,1) 70,1 (22,6) 82,4 (20,1) 63,1 (22,7) ASA III 93,9 (9,4) 72,2 (27,8) 87,6 (12,9) 65,6 (22,4) Surgical risk Low 91,7 (12,4) 0,572 67,0 (27,6) 0,435 83,6 (18,0) 0,797 61,1 (23,1) 0,904 Medium 90,2 (11,5) 68,3 (26,4) 82,0 (18,5) 62,2 (21,9) Major 92,7 (10,8) 75,7 (24,5) 81,0 (24,3) 63,4 (20,5) Type of Anaesthesia General 91,1 (11,6) 0,882 67,3 (26,9) 0,103 81,9 (19,2) 0,156 61,8 (21,5) 0,956 Local 90,7 (13,2) 77,4 (24,4) 88,1 (14,8) 62,1 (27,5) Duration of anaesthesia ≤ 120 minutes 91,6 (11,9) 0,518 70,5 (26,5) 0,231 81,6 (21,0) 0,594 61,8 (22,0) 0,984 > 120 minutes 90,5 (11,5) 65,7 (27,2) 83,1 (16,5) 61,7 (22,3) Pre-anaesthesia consult Without consult 89,1 (12,2) 0,012* 66,1 (26,9) 0,161 82,4 (19,5) 0,990 61,6 (22,0) 0,764 With consult 93,6 (11,0) 71,7 (25,6) 82,4 (17,6) 62,6 (22,0) Previous surgeries 0 88,1 (12,6) 0,401 69,8 (21,3) 0,897 80,9 (17,0) 0,879 63,5 (23,0) 0,710 1-2 91,6 (10,5) 67,1 (25,3) 82,0 (19,8) 63,2 (21,2) > 2 90,6 (13,2) 67,7 (29,9) 82,9 (18,6) 60,6 (22,1) Surgical Service General 90,4 (12,2) 0,180 67,0 (25,5) 0,010* 81,2 (19,4) 0,318 60,7 (20,5) 0,293 Vascular 94,8 (7,7) 81,8 (21,7) 87,2 (20,0) 67,8 (27,0) Plastic 90,4 (12,6) 63,7 (30,2) 83,0 (16,7) 61,0 (22,5)
Team (D1) Β (CI 95%) P value Highest education
Did not finish high school 5,8 (0,5;11,1) 0,033
High school diploma 4,1 (-1,8;10,0) 0,173
College degree Reference
Physical state
ASA I 0,1 (-5,7;5,8) 0,975
ASA II -0,6 (-5,0;5,8) 0,804
ASA III Reference
Pre-anaesthesia consult No Reference Yes 4,4 (0,7;8,0) 0,021 Surgical Service General Reference Vascular 3,7 (-1,2;5,6) 0,596 Plastic 1,2 (-3,2;5,6) 0,139
Fear/anxiety( D2) Β (CI 95%) p Value Gender Female Reference 0,007 Male 11,5 (3,2;19,8) Civil state Married Reference Single/divorced/widow 8,9 (0,03;17,8) 0,049 Physical State ASA I 0,9 (-12,0;13,9) 0,888 ASA II 5,8 (-4,4;16,1) 0,267
ASA III Reference
Anaesthesia Type Regional Reference General 0,7 (-13,6;14,9) 0,923 Pre-anaesthesia Consult No Reference Yes 5,9 (-2,6;14,4) 0,173 Surgical Service General Reference Vascular 12,2 (-0,2;24,5) 0,053 Plastic -2,1 (-12,2;8,0) 0,678
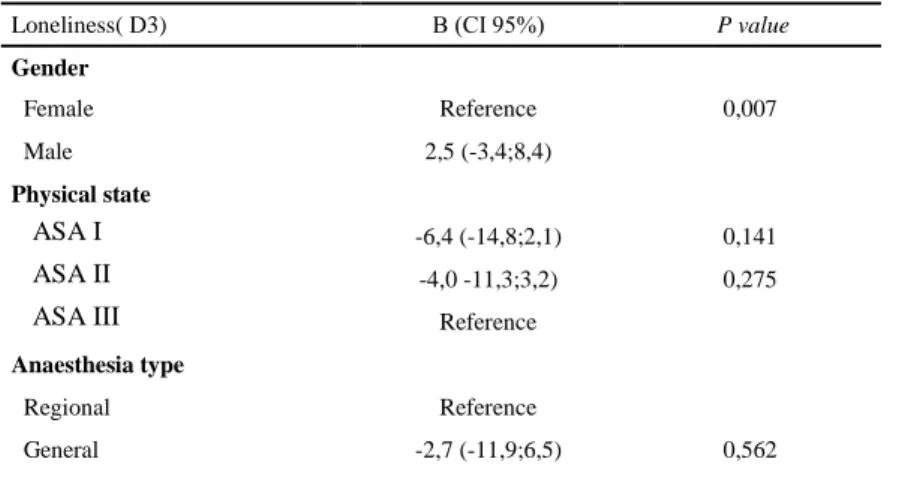
Loneliness( D3) Β (CI 95%) P value Gender Female Reference 0,007 Male 2,5 (-3,4;8,4) Physical state ASA I -6,4 (-14,8;2,1) 0,141 ASA II -4,0 -11,3;3,2) 0,275
ASA III Reference
Anaesthesia type
Regional Reference
General -2,7 (-11,9;6,5) 0,562
Discomfort (D4) Β (CI 95%) p Value Gender
Female Reference <0,001
Male 14,8 (8,2;21,5)
Highest Education
Did not finish high school 5,7 (-4,0;15,4) 0,245
High school diploma 8,0 (-2,7;18,7) 0,142
College degree Reference
Physical state
ASA I -2,1 (-12,2;8,0) 0,684
ASA II 1,6 (-6,4;9,6) 0,686
ASA III Reference
Figure 2 – Distribution of the 4 scale dimensions 90,8 68,1 82,4 62,1 0 20 40 60 80 100 1 2 3 4 Me an Sat isf act ion Dimension