VÂNIA CATARINA VIEIRA BAPTISTA
INFLUENCE OF OCEANOGRAPHY AND LARVAE BEHAVIOUR
ON RECRUITMENT OF TEMPERATE FISHES: THE
IMPORTANCE OF PHYSICS-BIOLOGY LINKS TO MANAGE
FISHERIES AT A LOCAL SCALE
UNIVERSIDADE DO ALGARVE
Faculdade de Ciências e Tecnologia
2019
VÂNIA CATARINA VIEIRA BAPTISTA
INFLUENCE OF OCEANOGRAPHY AND LARVAE BEHAVIOUR
ON RECRUITMENT OF TEMPERATE FISHES: THE
IMPORTANCE OF PHYSICS-BIOLOGY LINKS TO MANAGE
FISHERIES AT A LOCAL SCALE
Doutoramento em Ciências do Mar, da Terra e do Ambiente (ramo Ciências dos Mar, especialidade em Ecologia Marinha) Trabalho efetuado sob orientação de: Prof. Dra. Maria Alexandra Teodósio Dr. Francisco Leitão
Prof. Dr. Eric Wolanski
UNIVERSIDADE DO ALGARVE
Faculdade de Ciências e Tecnologia
2019
i
DECLARATION OF AUTHORSHIP
INFLUENCE OF OCEANOGRAPHY AND LARVAE BEHAVIOUR ON RECRUITMENT OF TEMPERATE FISHES: THE IMPORTANCE OF
PHYSICS-BIOLOGY LINKS TO MANAGE FISHERIES AT A LOCAL SCALE
I declare to be the author of this work, which is original and unpublished. Authors and works consulted are duly cited in the text and are included in the list of references.
Declaro ser a autora deste trabalho, que é original e inédito. Autores e trabalhos consultados estão devidamente citados no texto e constam da listagem de referências incluída.
ii © Vânia Catarina Vieira Baptista, 2019
A Universidade do Algarve tem o direito, perpétuo e sem limites geográficos, de arquivar e publicitar este trabalho através de exemplares impressos reproduzidos em papel ou de forma digital, ou por qualquer outro meio conhecido ou que venha a ser inventado, de o divulgar através de repositórios científicos e de admitir a sua cópia e distribuição com objetivos educacionais ou de investigação, não comerciais, desde que seja dado crédito ao autor e editor.
iii
SUPPORT
Funding
Vânia Catarina Vieira Baptista was funded by a PhD grant (Reference: SFRH/BD/104209/2014) from the Portuguese Foundation for Science and Technology (FCT – Fundação para a Ciência e Tecnologia).
Institutional support
This work would not be possible without the support from the following Institutions:
Centro de Ciências do Mar do Algarve (CCMAR)
v
“We all come from the sea, but we are not all of the sea. Those of us who are, we children of the tides, must return to it again and again, until the day we don't come back leaving only that which was touched along the way.”
vii
ix
ACKNOWLEDGMENTS
Ao logo destes quatros muitas pessoas contribuíram param para a realização deste projeto. Gostaria de deixar um agradecimento especial…
…aos meus orientadores: Prof. Alexandra Teodósio por aceitar ser minha orientadora, por ter acreditado em mim, pelo apoio, por todos os desafios que me colocou aos longo destes quatro anos e pelas oportunidades que me deu, ainda um agradecimento especial pela força e coragem nos momentos mais difíceis, e pela amizade; Dr. Francisco Leitão por ter acreditado em mim, por me proporcionar oportunidades de desenvolver a minha carreira como investigadora, por me ter lançado este desafio de fazer um Doutoramento e por todo o apoio; to Prof. Eric Wolanski for having accepted to co-supervise this project, it was an honour for me to have him as supervisor, and for all the knowledge that he transmitted to me.
…to Claudio Carere, for helping me within the ‘world’ of animal personality, it was a pleasure to work with you. Grazie mille!!!
…aos investigadores e técnicos do Estação Piloto de Piscicultura de Olhão (EPPO) – Instituto Português do Mar e da Atmosfera (IPMA, Portugal), em especial: à Dra. Laura Ribeira pela ajuda no planeamento das experiências com as larvas de peixe (um mundo novo para mim); ao Dr. Pedro Pousão pela disponibilização de espaço para a realização das experiências e de larvinhas; à Sara Castanho, Marisa Barata e Tetyana Urshulyak por todo apoio no decorrer das experiências, eu sei que por vezes era um peso extra nas vossas tarefas diárias (não foi por mal). …ao Pedro Morais, o colega com que partilhava comigo a secretária minúscula e que nos “trocou” pelas Américas mas que nunca deixou de estar presente. Pela importante contribuição nesta tese, por ter acreditado em mim e pelo incentivo. Mas mais importante, muito obrigada por me fazeres crescer como cientista, pelo rigor, pelos emails com artigos ao fim-de-semana e pelas críticas, por vezes duras, cheguei a ter “medo” de abrir os teus emails e foram muitas as vezes em que (como podes imaginar) revirava os olhos aos teus “pedidos”. No fim valeu a pena. Obrigada por me teres “obrigado” a apresentar o meu trabalho no CERF nos Estados Unidos. Muito obrigada por tudo.
…aos colegas do ECOREACH: Joana Cruz, pela ajuda, pelas correções, pelo incentivo e motivação, por todo o apoio e mais importante pela paciência e amizade; à Inês Cerveira pela ajuda nas correções, pela companhia na experiência que foi a conferência (CERF) nos Estados
x
Unidos, pela experiência de pescar corvinas americanas no Sado, e pela amizade (depois compenso com sopinha e arroz de atum com tomate); à Maria das Tartarugas que me mostrou o mundo das tartarugas de São Tomé; ao João Encarnação pela ajuda com algumas imagens; e a todos os restantes colegas que foram passando pelo nosso grupo ao longo destes 4 anos. …à Prof. Ana Barbosa, pelas fantásticas sugestões e ajuda nas correções e também pela boa disposição, é impossível não ficar contagiada.
…aos meus pais por terem acreditado sempre em mim e nas minhas escolhas, por me terem enchido de força, por estarem sempre comigo nos bons e nos maus momentos, sem eles não teria sido possível concluir mais esta etapa do meu caminho.
…à minha irmã Rita por ter acreditado em mim e pela força que me deu.
…à restante família, avós, tios e primos, por acreditarem em mim, pela força que me deram e pela compreensão das ausências em eventos familiares.
…aos amigos Guida, Fábio, Soraia, Ricardo, Arminda, João e Léa, pela motivação, força, coragem e por terem acreditado em mim. E aos amigos da segunda geração, a minha princesa Maria “Sardinha”, ao Simão, ao Francisco, ao João Martim e à mais recente princesa Mariana, pelos mimos que me deram que se transformaram em força (foi doloroso não poder estar presente em alguns dos grandes momentos).
…à Pipas, bióloga marinha de macacos, a primeira pessoa que conheci na Licenciatura em Biologia Marinha (na UALg, 2006) e que até hoje, mesmo com o Atlântico entre nós, mantemos uma grande amizade. Obrigada também pelas correções e sugestões
…à Vanessa Afonso, por ter aparecido na minha vida numa altura importante, pela grande amizade, por me dar também na cabeça quando é preciso, e pela companhia nas aventuras por este mundo fora.
…à Sónia Ribeiro, uma grande amiga que sempre me deu força e que nunca deixou de acreditar em mim (os teus abraços são uma fonte energia).
…às moças do Pilates, Sofia, Ana, Nélia e Filipa, pela companhia e amizade, por me divertirem e me fazerem sair de casa nesta última fase.
…e a todas as pessoas que passaram na minha vida durante estes quatros anos, e que de alguma forma deixaram o seu contributo para a realização deste desafio.
xi
ABSTRACT
A central question in the ecology of fishing resources is understanding the mechanisms behind recruitment variability. This thesis aimed to analyse the factors responsible for recruitment variability of two economically relevant species, in Portugal, white seabream (Diplodus sargus) and two-banded seabream (Diplodus vulgaris). The temporal variability in sea surface temperature (SST) was studied over specific regions of the Portuguese coast, along the last decades. The effects of changes in environmental variables and fishing pressure on these resources were evaluated, using a multi-model approach. Swimming capabilities of fish larvae and their behavioural responses to environmental cues, potentially relevant for the selection of nursery areas and recruitment, were determined using Ria Formosa coastal lagoon and white seabream as a case study. The analysis of SST during the period 1980-2010 showed a generalized warming along the Portuguese coast, with region- and season-variable tendencies. The effects of environmental and fishing variability on the landings were species-specific, and also varied depending on region and season. The swimming ability of white seabream larvae, as well as their exploratory activity, increased during ontogeny. However, this species did not select any of the environmental stimuli tested. The exploratory behaviour of white seabream larvae presented consistent individual differences throughout ontogeny, indicating that the personality traits emerge early in their life cycle.The integration of these results into an individual-based model showed that both the location of spawning sites and directional swimming capabilities are important determinants of the ingress success of white seabream into a nursery area, as the Ria Formosa lagoon. Thus, the integration of region- and season-specific oceanographic and fishing processes, as well as fish larvae behaviour and dispersion modelling, and supported climate change scenarios, are required for improving the estimates of fish recruitment.
Keywords: dispersion; swimming performance; habitat choice; environmental variability; fisheries
xiii
RESUMO
Uma questão central na ecologia dos recursos pesqueiros é compreender os mecanismos que causam variabilidade no recrutamento. Esta tese teve como objetivo analisar os fatores responsáveis pela variabilidade do recrutamento de espécies economicamente relevantes em Portugal, o sargo-legítimo (Diplodus sargus) e a safia (Diplodus vulgaris). A variabilidade na temperatura da superfície do mar (SST) foi estudada em regiões específicas da costa portuguesa nas últimas décadas. Os efeitos das alterações nas variáveis ambientais e da pescada nestes recursos foram avaliados, usando uma abordagem multimodelo. As capacidades natatórias das larvas de peixe e as suas respostas comportamentais às pistas ambientais, potencialmente relevantes para a seleção de zonas nursery e recrutamento, foram determinadas utilizando a Ria Formosa e o sargo-legítimo como estudo de caso. A análise da SST durante o período 1980-2010 mostrou um aquecimento generalizado ao longo da costa portuguesa, com tendências regionais e sazonais variáveis. Os efeitos da variabilidade ambiental e da pesca nos desembarques foram específicos para cada espécie, e também variaram dependendo da região e estação do ano. A capacidade natatória das larvas de sargo-legítimo, bem como a sua atividade exploratória, aumentou durante a ontogenia. No entanto, esta espécie não selecionou nenhum dos estímulos testados. O comportamento exploratório das larvas de sargo-legítimo apresentou diferenças individuais consistentes ao longo da ontogenia, indicando que os traços de personalidade aparecem cedo no seu ciclo de vida. A integração destes resultados num modelo individual mostrou que a localização dos locais de postura e a natação direcional são determinantes do sucesso do ingresso das larvas de sargo-legítimo numa zona de nursery, como a Ria Formosa. Assim, a integração dos processos oceanográficos e da pesca específicos para cada região e estação, bem como o comportamento das larvas de peixe e a modelação da dispersão, suportados pelos senários de alterações climáticas, são necessários para melhorar as estimativas de recrutamento de peixes.
Palavras-chave: dispersão; capacidade natatória; escolha de habitat; variabilidade ambiental; pescas
xv
RESUMO ALARGADO
As espécies de peixes de zonas costeiras temperadas têm uma história de vida bipartida: a postura ocorre no mar onde as larvas, eclodidas de ovos planctónicos, permanecem no ambiente pelágico durante semanas a meses antes de assentarem. Inicialmente os ovos e larvas são transportados passivamente dos locais de postura para as áreas de recrutamento (áreas de nursery costeiras: lagunas costeiras, estuários e áreas de costa rochosa) por processos oceanográficos costeiros.
Uma questão central na ecologia dos recursos pesqueiros é compreender as causas da variabilidade do recrutamento. Tem sido assumido que a sobrevivência e crescimento durante as fases larvar e juvenil são determinantes para a variabilidade espacial e temporal do recrutamento, que por sua vez afetam o tamanho e a dinâmica das populações locais. Esta variabilidade é também influenciada pela mortalidade devido às condições ambientais, fraca capacidade de alimentação e vulnerabilidade aos efeitos dos predadores, e pela interação dos processos físicos e biológicos relacionados com o transporte e retenção larvar. No entanto, a maioria dos fatores que determina o sucesso do recrutamento permanece pouco clara.
Por outro lado, os fatores ambientais têm sofrido alterações ao longo do tempo, como por exemplo, o aumento da temperatura da superfície do mar (SST) tem sido registado ao longo do século passado, bem como padrões do vento, chuvas e fluxos dos rios. No entanto, estas alterações ambientais no oceano não são homogéneas, e em conjunto com a atividade da pesca interagem de diferentes maneiras causando variabilidade nos recursos marinhos costeiros. O desenvolvimento da acuidade sensorial e das capacidades natatórias das larvas de peixes costeiros, bem como as suas respostas às pistas das nurseries costeiras, são também essenciais para o sucesso do recrutamento. No entanto, a maioria dos estudos tem investigado estas capacidades comportamentais em larvas de peixes de recifes de coral, enquanto apenas alguns trabalhos têm estudado este tópico em larvas de peixes de regiões temperadas.A Hipótese da Acuidade Sensorial e Comportamental (SAAB) propõe que as larvas pelágicas de peixes de
xvi
regiões temperadas também conseguem detetar pistas de áreas de nursery e ingressar nesses ecossistemas usando diversas estratégias ativas de natação.
Assim, o objetivo da presente tese foi avaliar os fatores responsáveis pela variabilidade do recrutamento de duas espécies de peixe com relevante valor económico em Portugal, o sargo-legítimo (Diplodus sargus; Linnaeus, 1758) e a safia (Diplodus vulgaris; Geoffroy Saint-Hilaire, 1817). Para este propósito estudou-se a variabilidade temporal e regional da SST ao longo das ultimas décadas na costa portuguesa; avaliaram-se os efeitos das alterações ambientais e da pressão da pesca nas capturas de sargo-legítimo e de safia ao longo da costa portuguesa; e determinaram-se as capacidades natatórias (velocidade crítica de natação – Ucrit,
e resistência) e o comportamento de resposta a pistas ambientais para a seleção de zonas nursery, ao longo do desenvolvimento, utilizando a Ria Formosa (sul de Portugal) e as larvas de sargo-legítimo como caso de estudo.
A análise da SST mostrou um aquecimento generalizado ao longo da costa portuguesa durante as últimas décadas (1980-2010), independentemente da fonte de dados utilizada. No entanto, o padrão de aquecimento não foi uniforme em todas as regiões: aproximadamente +0.1 °C década-1 nas costas noroeste e sudoeste e +0.2°C década-1 na costa sul. As taxas de incremento da SST também variaram sazonalmente, com os valores mais elevados registados na primavera e no verão (aproximadamente +0.4 °C década-1). Esta variabilidade sazonal da SST é relevante para a dinâmica dos processos biológicos devido às diferenças na vulnerabilidade ao stress térmico entre espécies, que afeta o seu ciclo de vida, como por exemplo a postura, e desenvolvimento larval
Os efeitos da variabilidade ambiental e da pesca nas capturas de sargo-legítimo e de safia também variaram regionalmente e sazonalmente. Em ambas as espécies, o esforço de pesca não foi relacionado com as capturas, o que significa que a variabilidade das capturas foi induzida pela variabilidade ambiental e por fatores intrínsecos. Para o sargo-legítimo, os efeitos sazonais do outono, inverno e primavera foram relacionados com as captura nas costas noroeste, sudoeste e sul de Portugal, indicando um possível gradiente longitudinal costeiro. Enquanto que para a safia, as capturas foram relacionadas com o outono e o verão no noroeste, com o inverno no sudoeste e com o outono e inverno na costa sul. Embora algumas variáveis ambientais tenham a mesma relação com as capturas em ambas as espécies (por exemplo, o efeito positivo da magnitude do vento no outono), essas relações também foram específicas para cada espécie: a SST e o Índice de Oscilação do Atlântico Norte (NAO) tiveram efeitos negativos em ambas
xvii
as espécies mas em diferentes estações e regiões; a componente do vento de leste e as descargas do rio foram apenas relacionados com as capturas de safia. Assim, cada uma das duas espécies estudadas no presente trabalho reage de maneira diferente à variabilidade ambiental.
Em relação à capacidade natatória, os resultados mostraram que as larvas de sargo-legítimo tornam-se nadadores mais competentes ao longo do desenvolvimento. A capacidade natatória das larvas aumentou de forma constante com a idade, alcançando os valores de Ucrit máximos
aos 50 e 55 dias após a flexão (DPH; 23.0 cm s-1); e a distância nadada nos testes de resistência mostrou um aumento abrupto dos 35 DPH (5.0 ± 6.0 km) para os 45 DPH (54.1 ± 22.1 km), com uma distancia máxima nadada de 86.5 km in 240.2 h. As larvas em pós-flexão de espécies de peixes temperados provaram ser melhores nadadoras que o esperado, com velocidades de natação várias vezes superiores ao seu comprimento do corpo por segundo e velocidades sustentadas superiores que as correntes típicas do seu ambiente natural, especialmente após os 35 DPH, nadando continuamente por dezenas de quilómetros durante várias horas ou dias, mesmo sem se alimentarem.
Contrariamente às nossas hipóteses, as larvas de sargo-legítimo não mostraram preferência por nenhum das pistas testadas (habitats da ria ou zonas costeiras rochosas, aumento da temperatura da água ou diminuição da salinidade da água). A atividade exploratória também aumentou ao longo do desenvolvimento e foi maior quando as larvas apresentaram comportamentos não responsivos ou inconclusivos, o que significa que as larvas podiam estar à procura de um estímulo diferente do que foi apresentado. Durante as fases iniciais do desenvolvimento, as larvas de sargo-legítimo exibiram uma variabilidade inter-individual altamente consistente nos seus comportamentos, o que indica que o aparecimento de traços de personalidade ocorre relativamente cedo na sua ontogenia.
Os resultados dos testes de capacidade natatória, da acuidade sensorial e traços de personalidade das larvas pós-flexão foram combinados num modelo de dispersão (individual based model – IBM) desenvolvido para a Ria Formosa e águas costeiras adjacentes, para quantificar o sucesso do ingresso das larvas de sargo-legítimo em função da distância e profundidade entre áreas de postura e a ria. Os dados demonstram que a localização dos locais de postura e a natação direcional são igualmente importantes no sucesso do ingresso das larvas de sargo-legítimo numa zona de nursery como a Ria Formosa. O sucesso do ingresso foi maior nos locais de postura localizados a 15.1-16.9 m de profundidade e quando as larvas em pós-flexão usaram a natação direcional. Neste cenário, as larvas ingressaram na lagoa usando correntes de maré
xviii
(larvas em pré-flexão passivas) ou natação direcional (larvas em pós-flexão ativas). A natação direcional também impediu a exportação de larvas para a área costeira. Quando a postura ocorre longe da pluma olfativa de ervas marinhas as larvas são dispersadas para o oceano.
Concluindo, a gestão dos recursos marinhos deve considerar a combinação da regionalidade e sazonalidade dos processos oceanográficos e da pesca, bem como as capacidades natatórias, as respostas comportamentais às pistas ambientais e o potencial de dispersão das larvas de peixes temperadas através da modelação da dispersão larvar. Esta abordagem contribuirá para estimativas mais fiáveis do recrutamento, considerando também os cenários das alterações climáticas. Devido à diversidade de variáveis importantes para a variabilidade do recrutamento de espécies de peixes temperados, esta tese sugere a integração de todas essas fontes de variabilidade (por exemplo, fisiologia, biologia, comportamento, ambiente) numa framework de avaliação da vulnerabilidade dos stocks de pesca às alterações climáticas.
xix
TABLE OF CONTENTS
Acknowledgements ... ix Abstract ... xi Resumo ... xiii Resumo alargado ... xv Table of contents ... xix List of figures ... xxiv List of tables ... xxix List of abbreviations ... xxxiiiCHAPTER 1. GENERAL INTRODUCTION ... 1
1.1 Mechanisms behind recruitment variability ... 3 1.2. Role of swimming and active habitat preferences ... 5 1.2.1 Larvae swimming capabilities ... 5 1.2.2 Detection of environmental cues for habitat selection ... 9 1.3 Impacts of environmental variability and changes on fish larvae, recruitment and
fisheries ... 13 1.4 Objectives and thesis structure ... 16 1.5 References ... 19
SECTION I: IMPACTS OF ENVIRONMENTAL VARIABILITY AND CHANGES ON FISH LARVAE, RECRUITMENT AND FISHERIES ... 33 CHAPTER 2. SEA SURFACE TEMPERATURE VARIABILITY ALONG THE
PORTUGUESE COAST SINCE 1950 ... 35
Abstract ... 37 2.1 Introduction ... 38 2.2 Materials and methods ... 40 2.2.1 Study area ... 40 2.2.2 Data acquisition ... 41
xx 2.2.3 Data analyses ... 42 2.3 Results ... 45 2.3.1 Inter-annual variability of SST ... 45 2.3.2 Seasonal variability of SST ... 52 2.4 Discussion ... 56 2.4.1 Inter-annual variability of SST ... 56 2.4.2 Seasonal variability of SST ... 59 2.4.3 Comparison with future scenarios ... 61 2.5 Conclusions ... 61 2.6 Acknowledgements ... 62 2.7 References ... 62 2.8 Appendix ... 69
CHAPTER 3. THE ROLE OF ENVIRONMENTAL AND FISHERIES MULTI-CONTROLS IN WHITE SEABREAM (DIPLODUS SARGUS) ARTISANAL
FISHERIES IN PORTUGUESE COAST ... 71
Abstract ... 73 3.1 Introduction ... 74 3.2 Materials and methods ... 77 3.2.1 Study area ... 77 3.2.2 Acquisition of environmental and fisheries data ... 77 3.2.3 Time series analyses ... 79 3.2.3.1 Min/max autocorrelation factor analysis (MAFA) ... 81 3.2.3.2 Dynamic factor analysis (DFA) ... 81 3.2.3.3 Generalized least square (GLS) ... 81 3.3 Results ... 82 3.4 Discussion ... 89 3.4.1 Northwestern coast (IXaCN) ... 90 3.4.2 Southwestern coast (IXaCS) ... 92 3.4.3 Southern coast, Algarve (IXaS-Algarve) ... 93 3.5 Conclusions ... 93 3.6 Acknowledgements ... 94 3.7 References ... 94 3.8 Appendix ... 102
xxi
CHAPTER 4. THE INFLUENCE OF ENVIRONMENTAL FACTORS AND
FISHING PRESSURE ON CATCH RATES OF DIPLODUS VULGARIS ... 105
Abstract ... 107 4.1 Introduction ... 108 4.2 Materials and methods ... 111 4.2.1 Study area ... 111 4.2.2 Environmental and fisheries data sources ... 112 4.2.3 Time series analyses ... 114 4.2.3.1 Min/max autocorrelation factor analysis (MAFA) ... 115 4.2.3.2 Dynamic factor analysis (DFA) ... 116 4.2.3.3 Generalized least square (GLS) ... 116 4.3 Results ... 117 4.4 Discussion ... 123 4.4.1 Northwestern coast (IXaCN) ... 124 4.4.2 Southwestern coast (IXaCS) ... 124 4.4.3 Southern coast, Algarve (IXaS-Algarve) ... 125 4.5 Conclusions ... 126 4.6 Acknowledgements ... 128 4.7 References ... 129 4.8 Appendix ... 133
SECTION II: RECRUITMENT, SWIMMING CAPABILITIES AND HABITAT
SELECTION IN TEMPERATE FISH LARVAE ... 135 CHAPTER 5. SWIMMING ABILITIES OF TEMPERATE PELAGIC FISH
LARVAE PROVE THAT THEY MAY CONTROL THEIR DISPERSION IN
COASTAL AREAS ... 137
Abstract ... 139 5.1 Introduction ... 140 5.2 Materials and methods ... 142 5.2.1 Model species ... 142 5.2.2 Overview of experimental design ... 142 5.2.2.1 Critical swimming speed (Ucrit) ... 143
5.2.2.2 Swimming endurance ... 145 5.2.2.3 Locomotory behavioural observations ... 145
xxii
5.2.2.4 Physiological condition ... 146 5.2.3 Data analyses ... 147 5.3 Results ... 148 5.4 Discussion ... 154 5.4.1 Swimming performance of temperate fish larvae ... 154 5.4.2 Swimming performance and physiological condition ... 158 5.4.3 Climate change and the swimming abilities of temperate fish larvae ... 158 5.5 Conclusions ... 159 5.6 Ethics statement ... 160 5.7 Acknowledgements ... 160 5.8 References ... 160
CHAPTER 6. DO CONSISTENT INDIVIDUAL DIFFERENCES IN TEMPERATE AND PELAGIC FISH LARVAL BEHAVIOUR AFFECT
RECRUITMENT IN NURSERY HABITATS? ... 169
Abstract ... 171 6.1 Introduction ... 172 6.2 Materials and methods ... 173 6.2.1 Model species ... 173 6.2.2 Animals and housing conditions ... 173 6.2.3 Design and experimental set-up ... 178 6.2.4 Data collection – Behavioural observations ... 180 6.2.5 Data analysis ... 181 6.3 Results ... 182 6.4 Discussion ... 193 6.4.1 Response to habitat and environmental cues ... 193 6.4.2 Individual behaviour consistency ... 194 6.5 Conclusions ... 197 6.6. Ethics statement ... 197 6.7 Acknowledgements ... 197 6.8 References ... 198 6.9 Appendix ... 209
xxiii
CHAPTER 7. MODELLING THE INGRESS OF A TEMPERATE FISH LARVA INTO A NURSERY COASTAL LAGOON ... 211
Abstract ... 213 7.1 Introduction ... 214 7.2 Materials and methods ... 216 7.2.1 Model species ... 216 7.2.2 Study area ... 216 7.2.3 Model ... 218 7.2.4 Altimetry ... 219 7.3 Results ... 219 7.4 Discussion ... 223 7.4.1 The relevance of spawning ground location and fish larvae directional swimming
... 225 7.4.2 Improving IBMs to refine fisheries management and marine protected areas
(MPAs) ... 226 7.5 Conclusions ... 228 7.6 Acknowledgements ... 228 7.7 References ... 229
CHAPTER 8. GENERAL CONCLUSION AND FINAL REMARKS ... 235
8.1 General conclusions ... 237 8.2 Final remarks, recommendations and future perspectives ... 239 8.3 References ... 242
xxiv
LIST OF FIGURES
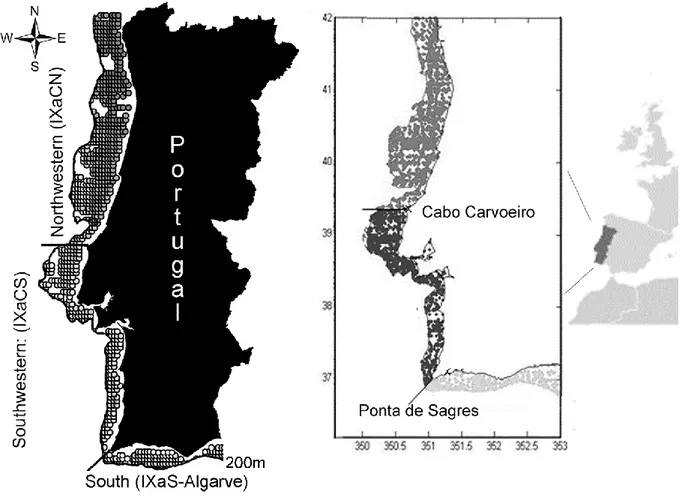
Figure 2.1 Portuguese coast with different studied areas (northwestern and southwestern,
representing the western coast; and southern coast) and information on satellite (left panel) and ICOADS (right panel) points used to extract average mean per area until 200m depth. The delimitation of the different areas of Portuguese coast was adapted accordingly oceanographic studies (Cunha, 2001; Bettencourt et al., 2004) and fisheries stocks division (ICES sub-division). ... 41
Figure 2.2 (a) Observed and smoothed (LOESS) ICOADS (1950-2010) and Satellite
(1985-2010) monthly sea surface temperature (SST) average values for Portuguese coastal areas (northwestern – IXaCN, southwestern – IXaCS and southern – IXaS-Algarve); (b) annual SST cycle for the observed ICOADS and Satellite data for Portuguese coastal areas (northwestern – IXaCN, southwestern – IXaCS and southern – IXaS-Algarve), average for the period 1985-2010. ... 46
Figure 2.3 (a) Observed ICOADS (1950-2010) and Satellite (1985-2010) annual mean sea
surface temperature (SST) values for Portuguese coastal areas with corresponding adjusted linear regression lines (the horizontal black line represent the average yearly value for ICOADS data); (b) half a decade SST anomalies based on ICOADS data for Portuguese coastal areas (northwestern – IXaCN, southwestern – IXaCS and southern – IXaS-Algarve). ... 48
Figure 2.4 (a) Observed and estimated (Regime Shift Indicator) of yearly ICOADS sea surface
temperature (SST) values for Portuguese coastal areas (northwestern – IXaCN, southwestern – IXaCS and southern – IXaS-Algarve). The model was calculated based on Significance level of 0.1, cut-off length of 10 and Huber parameter of three for northwestern (IXaCN) and southwestern (IXaCS) and Significance level of 0.1, cut-off length of 20 and Huber parameter of three for southern coast (IXaS-Algarve). (b) Observed and estimated (LOESS values and Kolmogorov-Zurbenko and Kolmogorov-Zurbenko Adaptive filters values) of monthly ICOADS SST values for Portuguese coastal areas. The model was calculated based on 132, 120 and 144 months for northwestern, southwestern and southern coasts. ... 51
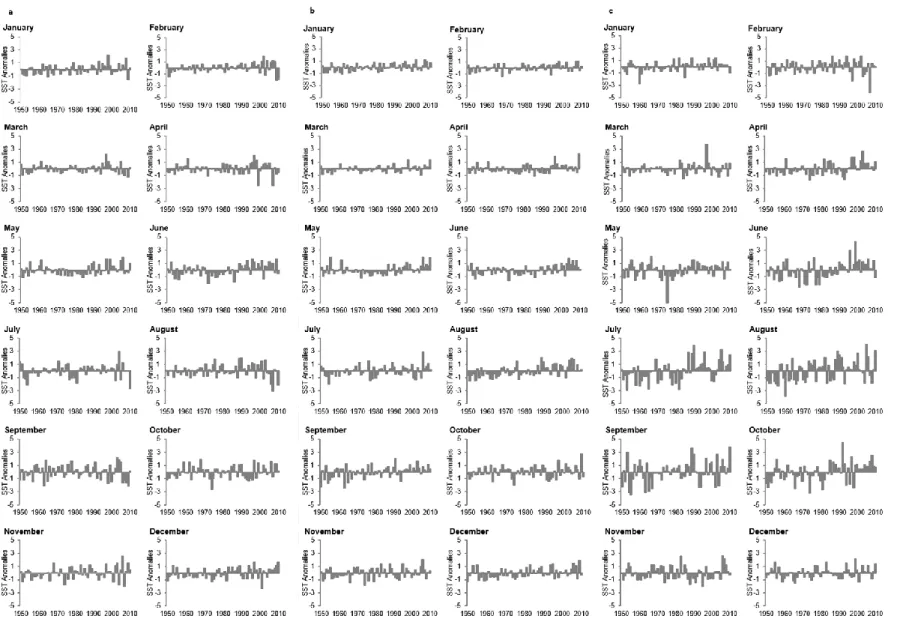
Figure 2.5 Yearly monthly ICOADS (1950–2010) sea surface temperature (SST) anomalies
for Portuguese coastal areas: (a) northwestern (IXaCN), (b) southwestern (IXaCS) and (c) southern (IXaS-Algarve) coasts. ... 55
Figure 2.6 Observed ICOADS (1950–2010) and Satellite (1985–2010) monthly sea surface
temperature (SST) mean values for Portuguese coastal areas: (a) northwestern (IXaCN), (b) southwestern (IXaCS) and (c) southern coasts (IXaS-Algarve), with corresponding adjusted linear regression lines. ... 55
Figure 2.A1 Autocorrelation function analyses (ACF) based on sea surface temperature
ICOADS data (1950-2010) for Portuguese coastal areas (northwestern – IXaCN, southwestern – IXaCS and southern – IXaS-Algarve) for: (a) yearly data; (b) monthly data and (c) each month data. ... 69
xxv
Figure 3.1 Location of the rivers and ports of Portuguese coastal study areas: northwestern
(IXaCN) southwestern (IXaCS) and southern (IXaS-Algarve). ... 76
Figure 3.2 Standardized time series of the yearly environmental variables, during the period
1987-2007 (for time series models the variables were lagged two years, therefore the data match the fisheries period 1989-2009) in the northwestern (IXaCN), southwestern (IXaCS) and southern (IXaS-Algarve) regions, and total area (IXa) of Portugal: sea surface temperature (a), North Atlantic Oscillation index (b), upwelling index (c), wind magnitude (d), easterly wind component (e), northerly wind component (f) and river discharge (g). ... 83
Figure 3.3 Standardized yearly fishing effort (number of fishing days and boats) for Diplodus
sargus during the period 1989-2009 in the northwestern (IXaCN), southwestern (IXaCS) and
southern (IXaS-Algarve) regions, and total area (IXa) of Portugal. ... 86
Figure 3.4 Standardized Diplodus sargus LPUE between 1989 and 2009 in the northwestern
(IXaCN), southwestern (IXaCS) and southern (IXaS-Algarve) regions, and total area (IXa) of Portugal. ... 87
Figure 4.1 Location of the main fishing commercial ports and freshwater inputs to the three
geographical regions on the coast of Portugal: northwestern, southwestern and southern. .... 112
Figure 4.2 Standardised time series of the yearly environmental variables during the period
1989-2009 in the three geographical regions on the coast of Portugal (northwestern, southwestern and southern): sea surface temperature (a), North Atlantic Oscillation Index (b), Upwelling Index (c), wind magnitude (d), easterly wind component (e), northerly wind component (f) and river discharge (g). ... 119
Figure 4.3Standardised yearly fishing effort (number of fishing days and boats) for Diplodus
vulgaris from 1989 to 2009 in three geographical regions (northwestern, southwestern and
southern) on the coast of Portugal. ... 121
Figure 4.4 Standardised Diplodus vulgaris landings per unit effort (LPUE) from 1989 to 2009
in three geographical regions on the coast of Portugal (northwestern, southwestern and southern). ... 121
Figure 5.1 Swimming chamber used in critical swimming speed and swimming endurance
experiments of white seabream Diplodus sargus (Linnaeus, 1758) larvae (based on Stobutzki and Bellwood [18, 30], and adapted by Faria et al. [53]). The chamber comprise six parallel swimming lanes (A) with the following dimensions 180 × 30 × 50 mm (L × W × H) two sets of plastic flow diffusers (B) ( - 5 mm; 40 mm L) placed to uniformize flow in the different lanes, two mesh bands installed in both ends of each lane of the chamber to retain larvae (C), (D) correspond to water intake and (E) correspond to the water outlet. ... 144
Figure 5.2 Relationships between total length (mm) and dry weight (mg) (N = 175) (a), and
between age (days post-hatching) and total length (mm) (N = 175) (b) for white seabream
Diplodus sargus (Linnaeus, 1758) larvae tested for swimming capabilities along ontogeny (15,
20, 25, 30, 35, 40, 45, 50, and 55 days post-hatching). ... 148
Figure 5.3 Variation of critical swimming speed (Ucrit; cm s-1) for white seabream Diplodus sargus (Linnaeus, 1758) larvae along ontogeny (15, 20, 25, 30, 35, 40, 45, 50, and 55 days
post-hatching). The lines inside the boxes represent the median, × represents the mean, the lower and upper box limits represent the 25th and the 75th percentiles, whiskers represent the standard deviation, while dots represent the outliers. ... 150
xxvi
Figure 5.4 Distance (km) swam by white seabream Diplodus sargus (Linnaeus, 1758) larvae
during endurance swimming experiments at 15, 25, 35, and 45 days post-hatching. The lines inside the boxes represent the median, × represents the mean, the lower and upper box limits represent the 25th and the 75th percentiles, whiskers represent the standard deviation, while dots represent the outliers. ... 151
Figure 5.5 Relation between critical swimming speed (Ucrit, cm s-1) (left panels) and distance
(km) swam during endurance experiments (right panels) with condition indexes (RNA, µg RNA mg-1 DW; DNA, µg DNA mg-1 DW; sRD, standardized RNA:DNA ratio; resRNA, residuals of RNA; concentration of proteins, µg protein larva-1) for white seabream Diplodus sargus
(Linnaeus, 1758) larvae tested along ontogeny (15, 20, 25, 30, 35, 40, 45, 50, and 55 days post-hatching (DPH) for Ucrit experiments, at 15, 25, 35, and 45 DPH for endurance experiments).
An increase in sRD and resRNA indexes corresponds to the better nutritional condition. ... 152
Figure 6.1 Choice-chamber used in preference tests of white seabream Diplodus sargus (Linnaeus, 1758) larvae to different odour cues (based on the designed by Gerlach et al., 2007). The dimensions of the chamber are 20 × 4 × 2.5 cm (L × W × H) (A) and (B) correspond to water intake, (C) correspond to the water outlet, areas (1) and (2) are choice lanes, areas (3), (3.1) and (3.2) are considered unresponsive areas [area (3.1) is more influenced by source (A), while area (3.2) is more influenced by source (B)]. ... 180
Figure 6.2Preference of white seabream Diplodus sargus (Linnaeus, 1758) larvae for different habitat conditions (A- lagoon water, Test I; B- coastal water, Tests II; C- increase of 4 °C in water temperature, Test III; D- decrease of 10 units of water salinity, Test IV) in choice-chamber experiments along ontogeny (A1- Age 1, A2- Age 2, A3- Age 3, A4- Age 4). ... 184
Figure 6.3 Preference Index of white seabream Diplodus sargus (Linnaeus, 1758) larvae in
choice-chamber experiment trials for each test (Test I- lagoon habitat, Test II- coastal habitat, Test III- increase of temperature, Test IV- decrease of salinity) and along ontogeny (Age 1, Age2, Age 3, Age4). Negative values of this index indicate a preference for stimulus water, while positive values indicate a preference for control water. The mean is represented by across, the line inside the boxes represent the median, and full circles represent the outliers. ... 186
Figure 6.4 Average Exploratory Activity Index (EAI) exhibited by white seabream Diplodus
sargus (Linnaeus, 1758) larvae in choice-chamber experiments separated by different
behaviours (control water preference, stimulus water preference, unresponsive or inconclusive behaviour) in different habitat conditions (A- Test I, lagoon habitat; B- Test II, coastal habitat; C- Test III, increase of temperature; D- Test IV, decrease of salinity) and across ontogeny (Age 1, Age2, Age 3, Age 4). ... 188
Figure 7.1 Bathymetry of spawning sites (dark spots) adjacent to the Ria Formosa lagoon off
southeastern Portugal. The thick line represents the model domain used in the present study and the thin dashed line represents the model domain used by Teodósio et al. (2016). ... 217
Figure 7.2 Predicted smell seagrass plume emanating from the Ria Formosa Lagoon to the
adjacent coastal area. The colour bar indicates the intensity of the smell plume in the adjacent coastal area. ... 218
xxvii
Figure 7.3 Number of white seabream Diplodus sargus (Linnaeus, 1758) larvae trapped in the
Ria Formosa lagoon (southern Portugal) along 624 h (26 days) of simulation for larvae with and without swimming capabilities and spawning locations at 15.1-15.98 m deep, 16.0-16.99 m deep and 30.0-40.0 m deep (the other eight spawning locations were not present because the ingress into the lagoon was zero or near zero). ... 221
Figure 7.4 Ingress success (%) of white seabream Diplodus sargus (Linnaeys, 1758) larvae
into the Ria Formosa lagoon (South Portugal) according to the offshore depth of the spawning site, and depending if post-flexion larvae swam actively towards the smell cue gradient originated from the lagoon () or not (). ... 222
Figure 7.5 Scenarios for ingress success of white seabream Diplodus sargus larvae in the Ria
Formosa Lagoon (southern Portugal) taking into account the spawning location: (A) spawning occurring at 10 m deep; (B) spawning occurring at 16 m deep resulting in success of ingress; (C) spawning occurring at 50 m deep. ... 224
Figure 7.6 Altimetry-derived surface currents along the southwestern coast of the Iberian
Peninsula during the 2010 spawning season of white seabream Diplodus sargus (Linnaeus, 1758) which usually occurs from March till June (Morato et al., 2003). Image retrieved using data obtained from NOAA-OSCAR. ... 227
xxix
LIST OF TABLES
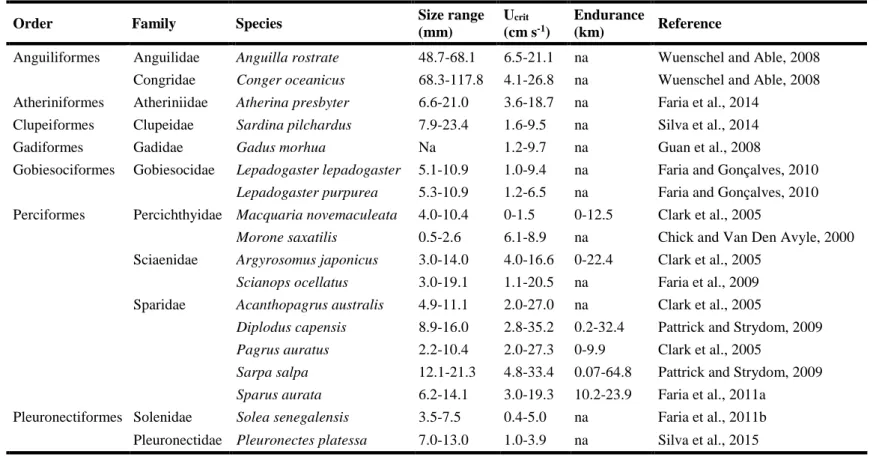
Table 1.1 Summary of reports on swimming performance (critical swimming speed – UCrit, and
swimming endurance) of temperate fish species, including size range. (na – data not available). ... 8
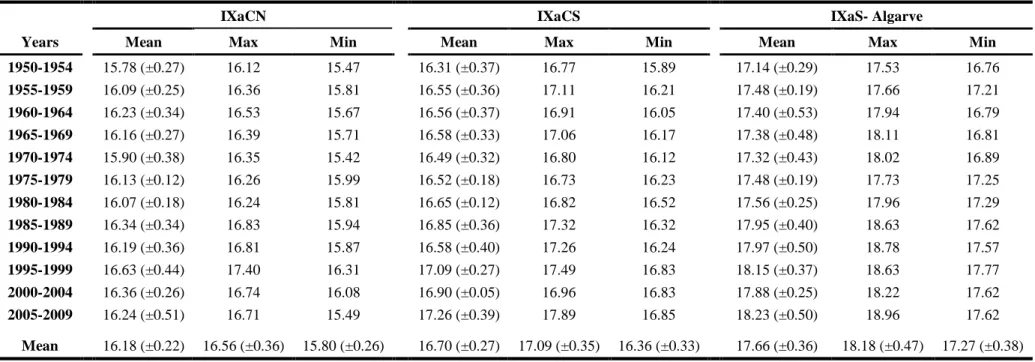
Table 2.1 Mean, maximum and minimum half a decade sea surface temperature (SST) values
based on ICOADS data (1950–2010) for Portuguese coastal areas (northwestern – IXaCN, southwestern – IXaCS and southern – IXaS-Algarve). ... 49
Table 2.2 Slope values of linear regression lines for ICOADS (1950–2010) and Satellite (1985–
2010) annual, monthly and seasonal sea surface temperature (SST) data for Portuguese coastal areas (northwestern – IXaCN, southwestern – IXaCS and southern – IXaS-Algarve). ... 50
Table 2.3 Regime Shift Indicator and confidence level of the difference between the mean
values of the neighbouring regimes based on the Student’s two-tailed t-test with unequal variance (Conf) values based on sea surface temperature (SST) ICOADS data (1950–2010) for Portuguese coastal areas (northwestern – IXaCN, southwestern – IXaCS and southern – IXaS-Algarve). The model was calculated based on Significance level of 0.1, cut-off length of 10 and Huber parameter of 3 for northwestern and southwestern coasts and Significance level of 0.1, cut-off length of 20 and Huber parameter of 3 for southern coast. ... 52
Table 2.A1 Akaike’s information criterion (AIC) and canonical correlation values for dynamic
factor analysis (DFA) models with one common trend tested for the period between 1985 and 2010 with: six (regions and data sets), three (regions) and two (data sets) variables for yearly monthly sea surface temperature (SST) values; and six (regions and data sets) variables for monthly SST values, for Portuguese coastal areas (northwestern – IXaCN, southwestern – IXaCS and southern – IXaS-Algarve), based on a diagonal matrix. ... 70
Table 3.1 Means and standard eviations of annual and seasonal (winter, spring, summer and
autumn) environmental variables, and total river discharge values, during the period 1987-2007 (for time series models the variables were lagged two years, therefore the data match the fisheries period 1989–2009) in the northwestern (IXaCN), southwestern (IXaCS) and southern (IXaS-Algarve) regions, and total area (IXa) of Portugal. ... 84
Table 3.2 Summary of results of relationship between Diplodus sargus LPUE and explanatory
(fishing and environmental) variables for min/max autocorrelation factor analysis (MAFA), dynamic factor analysis (DFA) and generalized least square (GLS) methods in the northwestern (IXaCN), southwestern (IXaCS) and southern (IXaS-Algarve) regions, and total area (IXa) of Portugal. ... 88
Table 3.A1 Detailed model results of all model approaches (MAFA, DFA and GLS), including
all explanatory variables related to D. sargus LPUE in the northwestern (IXaCN), southwestern (IXaCS) and southern (IXaS-Algarve), regions and total area (IXa) of Portugal. ... 103
xxx
Table 4.1 Yearly and seasonal means and standard deviations (SD) for environmental variables
tested in the models for the period 1989-2009 in three geographical regions (northwestern, southwestern and southern) on the coast of Portugal. ... 118
Table 4.2 Summary results of the relationships between Diplodus vulgaris landings per unit
effort (LPUE) and explanatory (fishing and environmental) variables in three geographical regions on the coast of Portugal (northwestern, southwestern and southern) using min/max autocorrelation factor analysis (MAFA), dynamic factor analysis (DFA) and generalised least square (GLS) modelling techniques. ... 122
Table 4.A1 Detailed results from min/max autocorrelation factor analysis (MAFA), dynamic
factor analysis (DFA) and generalised least square (GLS) modelling approaches used in the study, including explanatory variables related to Diplodus vulgaris landings per unit effort (LPUE) in three geographical regions (northwestern, southwestern and southern) on the coast of Portugal. ... 133
Table 5.1 Number of white seabream Diplodus sargus (Linnaeus, 1758) larvae used in
locomotory behaviour experiments: Critical swimming speed (UCrit), Endurance (water flow
speed is shown), Modal Action Patterns (MAPs); at nine occasions along ontogeny – 15, 20, 25, 30, 35, 40, 45, 50, and 55 days post-hatching (DPH). ... 143
Table 5.2 Mean and standard deviation values of critical swimming speed (Ucrit), swam distance
in the endurance experiment, total length (TL), dry weight (DW), nucleic acid concentrations (RNA, DNA), sRD (standardized RNA:DNA ratio), resRNA (RNA residuals), and protein concentration (Proteins) for seabream Diplodus sargus (Linnaeus, 1758) larvae across ages (DPH – days post-hatching). N is the number of larvae used in each age. (*analytical parameters refer to the last day of swimming endurance; the period of the test in these two ages varied between 1 and 10 days). ... 149
Table 5.3 Linear regression analysis between white seabream Diplodus sargus (Linnaeus,
1758) larvae age (DPH – days post-hatching), total length (TL, mm), dry weight (DW, mg), nucleic acid concentrations (RNA, µg RNA mg-1 DW; DNA, µg DNA mg-1 DW; sRD, standardized RNA:DNA ratio; and resRNA, residuals of RNA), and proteins concentrations (µg protein larva-1) and critical swimming speed (U
crit, cm s-1) and distance (km) swam during
the endurance experiment. ... 153
Table 5.4 Mean and standard deviation that white seabream Diplodus sargus (Linnaeus, 1758)
larvae spent doing each Modal Action Pattern behaviour (swimming, pause-swimming, pause and sink) along ontogeny (DPH – days post-hatching). ... 154
Table 5.5 Summary of reports on swimming performance (critical swimming speed – UCrit, and
swimming endurance) of temperate fish species, including size range. (na – data not available). ... 156
Table 6.1 Timeline of housing and choice-chamber test for white seabream Diplodus sargus
(Linnaeus, 1758) larvae. ... 176
Table 6.2 Water conditions experienced in housing and choice-chamber testes for white
seabream Diplodus sargus (Linnaeus, 1758) larvae. ... 177
Table 6.3 Number of white seabream Diplodus sargus (Linnaeus, 1758) larvae tested across
ontogeny in each binary test. The number of replaced larvae is in brackets. ... 178
xxxi
Table 6.4 Chi-square test results on the absolute frequency of behaviours exhibited by white
seabream Diplodus sargus (Linnaeus, 1758) larvae (unresponsive, preference for control water, preference for stimulus water, and inconclusive behaviour) in choice-chamber experiment trials for each test (Test I- lagoon habitat, Test II- coastal habitat, Test III- increase of temperature, Test IV- decrease of salinity) and along ontogeny (Age 1, Age2, Age 3, Age4). Significant differences are highlighted in bold. ... 185
Table 6.5 The post-hoc Holm-Sidak test for multiple comparations of Preference and Exploratory Activity Indexes of white seabream Diplodus sargus (Linnaeus, 1758) larvae in each test (Test I- lagoon habitat, Test II- coastal habitat, Test III- increase of temperature, Test IV- decrease of salinity) and along ontogeny (Age 1, Age2, Age 3, Age 4). Significant differences are highlighted in bold. ... 187
Table 6.6 Descriptive measures of Exploratory Activity and Preference Indices exhibited by
white seabream Diplodus sargus (Linnaeus, 1758) across tests performed in choice-chamber experiments (Acclimatisation, Test I, Test II, Tests III, Test IV) across ontogeny (Age 1, Age2, Age 3, Age 4). Legend: mean ± standard error (SE), coefficient of variation (CV), individual-based repeatability (RIOC) with 95% confidence intervals (CI), significance (p). Significant
results are highlighted in bold... 189
Table 6.7 Descriptive measures of Exploratory Activity and Preference Indices exhibited by
white seabream Diplodus sargus (Linnaeus, 1758) across tests performed in choice-chamber experiments (Acclimatisation, Test I, Test II, Tests III, Test IV) for each age-combination (Age 1 to Age 4). Legend: mean ± standard error (SE), coefficient of variance (CV), individual-based repeatability (RIOC) with 95% confidence intervals (CI), significance (p). Only comparisons
with N higher than ten are shown. Significant results are highlighted in bold. ... 190
Table 6.8 Measures of Exploratory Activity and Preference Indices exhibited by white
seabream Diplodus sargus (Linnaeus, 1758) within each test performed in choice-chamber experiments (Acclimatisation, Test I, Test II, Tests III, Test IV) for each age-combination (Age 1 to Age 4). Legend: mean ± standard error (SE), coefficient of variance (CV), individual-based repeatability (RIOC) with 95% confidence intervals (CI), significance (p). Only comparisons
with N higher than ten are shown. Significant results are highlighted in bold. ... 191
Table 6.9 The post-hoc Conover test for multiple comparations of Exploratory Activity Index
of white seabream Diplodus sargus (Linnaeus, 1758) larvae considering their responses obtained in Preference Index (R- preference for control water, S- preference for stimulus water, U- unresponsive behaviour, I- inconclusive behaviour) in each test (Test I- lagoon habitat, Test II- coastal habitat, Test III- increase of temperature, Test IV- decrease of salinity) along ontogeny (Age 1, Age2, Age 3, Age4). Significative are highlighted in bold. ... 192
Table 6.A1 Spearman’s correlation coefficients between behavioural measurements: activity
(ACT), exploration (EXP) and Exploratory Activity Index (EAI), for white seabream Diplodus
sargus (Linnaeus, 1758) in each test (T1- lagoon habitat, T2- coastal habitat, T3- increased
temperature and T4- reduced salinity), at Age 1, Age 2, Age 3 and Age 4. (* and ** corresponding to correlation significant at the 0.05 and 0.01 level, respectively). ... 209
xxxiii
LIST OF ABBREVIATIONS
ACF – Auto-Correlation Function DFA – Dynamic Factor Analysis DPH – Days Post-Hacting EAI – Exploratory Activity Index FE – Fishing Effort
GLS – Generalized Least Square
ICES – International Council for the Exploration of the Sea
ICOADS – International Comprehensive Ocean–Atmosphere Data Set IPCC – Intergovernmental Panel on Climate Change
IXa – ICES area of Portugal
IXaCN – Northwestern coast of Portugal IXaCS – Southwestern coast of Portugal IXaS-Algarve – Southern coast of Portugal KZ – Kolmogorov–Zurbenko filter
KZA – Kolmogorov–Zurbenko Adaptive filter LPUE – Landings per Unit Effort
MAFA – Min/max Autocorrelation Factor Analysis NAO – North Atlantic Oscillation index
PI – Preference Index
xxxiv RSI – Regime Shift Indicator test
SST – Sea Surface Temperature (°C) Ucrit – Critical Swimming Speed UPW – Upwelling index
UWIND – Easterly Wind component (m s-1) VWIND – Northerly Wind component (m s-1) WMAG – Wind Magnitude (m s-1)
CHAPTER 1
3
GENERAL INTRODUCTION
1.1 Mechanisms behind recruitment variability
Many fish species, including coastal species, have a bipartite life history (Radford et al., 2012). Spawning occurs at the sea, and the larvae, hatched from planktonic eggs, remain in the pelagic environment for weeks to months before recruiting to nursery habitats (Montgomery et al., 2001). Initially, eggs and larvae are passively transported from spawning sites to recruitment areas (Leis, 2006; Teodósio et al., 2016) by hydrodynamic processes, such as wind-driven transport, convergence by river fronts and internal waves, tidal currents, ocean currents, river plumes, surficial waves, upwelling or downwelling, and eddies (Montgomery et al., 2001; Hare et al., 2002; Parada et al., 2003). The variability of these oceanographic processes can be seasonal, interannual or stochastic (Blaber and Blaber, 1980; Whitfield, 1994; Gibson, 1997), leading to the transport of eggs and larvae at scales of few kilometres to hundreds of kilometres (Hare et al. 2002; Parada et al., 2003; Wolanski and Kingsford, 2014). Recruitment usually takes place in coastal nursery areas (i.e., coastal lagoons, estuaries and rocky shore areas) where high concentration of food resources and availability of refuge sites, increase survival and growth (Bradbury and Snelgrove, 2001; Barbosa and Chícharo, 2011; Chícharo et al. 2012).
A central question in the ecology of marine communities is understanding the mechanisms behind the recruitment variability (Hale et al., 2008). Survival and growth during the larval and juvenile phases have been assumed as crucial determinants of spatial and temporal variability in recruitment (Houde, 2008), in turn affecting the size and dynamics of local populations. Mortality is usually very high during the fish larval stages (Wolanski and Kingsford, 2014; Faillettaz et al., 2015), due to limiting environmental conditions, poor feeding ability and vulnerability to predators (Simpson et al., 2013; Jørgensen et al., 2014; Garrido et al., 2015), increasing with the duration of the larval stage (Paris et al., 2007). Recruitment variability is also influenced by the complex interactions of physical and biological processes
4
(Leis, 2010; Hale et al., 2008) that lead to larval transport and/or retention, and food web processes that sustain fish larvae (Santos et al., 2007). However, the specific relevance of the factors potentially determining recruitment success remains unclear (Hale et al., 2008; Faillettaz et al., 2015). For example, migration processes are still poorly understood (Boehlert and Mundy, 1988; James et al., 2008; Radford et al., 2012).
Over the last century, several hypotheses have been proposed to explain the variability in fish recruitment. The first hypothesis, “Critical Period” hypothesis, stated that, at the time of first feeding, food limitation may reduce larval survivor (Hjort, 1914). According to the “Aberrant Drift” hypothesis, recruitment variability is dictated by larvae dispersal by currents to unfavourable habitats (Hjort, 1926). The “Migration Triangle” hypothesis used distinct seasonal and ontogenetic migrations between feeding, spawning and nursery habitats (Harden-Jones, 1968). The “Match-Mismatch” hypothesis proposed that larval survival, and consequently recruitment, are a function of the timings of spawning, larval hatching and peak abundance of their prey (Cushing 1975, 1990). The “Stable Ocean” hypothesis suggested that the survival and recruitment of larvae would be improved when larvae and suitable prey are aggregated by transient vertical stratification of the water column, induced by the occurrence of calm periods in upwelling ecosystems (Lasker, 1978). The physical retention of eggs and larvae is critical for the recruitment success, according to “Stable Retention” (Iles and Sinclair, 1982) and “Member-Vagrant” hypotheses (Sinclair and Iles, 1989), and this stages could be lost from the population by transport into unfavourable areas. The “Predation” hypothesis stated that fish recruitment is controlled by predation (Bailey and Houde, 1989). The “Ocean Triads” hypothesis, a more integrative hypothesis, refer that recruitment variability depends on the combination of nutrient enrichment processes (upwelling, mixing, buoyant plumes), larval food concentration processes (convergence, frontal formation, water column stability), and larval retention processes (eddies, onshore flow) (Agostini and Bakun, 2002). The importance of larval retention for the completion life cycle of marine fishes was also advocated by Sinclair and Power (2015). To maximize recruitment it is important to minimize drift and transport, through the integration of different active processes, such as horizontal swimming capabilities and circadian vertical migrations, to maximize movement directly into the nursery habitats (Lough and Bolz, 1989) or areas with oceanographic characteristics benefiting retention and ingress (Sponaugle et al., 2002; Paris and Cowen, 2004; Secor et al., 2017).
5
1.2 Role of swimming and active habitat preferences
Beyond the initial passive phase (Leis, 2010), coral reef fish larvae are considered to have essential swimming and sensorial abilities for finding suitable coastal nursery habitats (Fisher et al., 2000; Leis, 2010; Wolanski and Kingsford, 2014; Atema et al., 2015). In contrast, temperate fish larvae have been described with limited swimming and sensorial abilities (Leis, 2010; Kashef et al., 2014; Silva et al., 2014). Yet, according to a recent hypothesis, the Sense Acuity And Behavioural (SAAB) hypothesis (Teodósio et al., 2016), the recruitment of temperate fish larvae is unlikely if based only on passive drift by water currents. Consequently, the development of sensorial acuity in temperate fish larvae, and their behavioural responses to nursery cues present in coastal areas, are essential for recruitment success. As the sensorial acuity and swimming capacity increase during ontogeny (Fisher et al., 2000; Gerlach et al., 2007; Faria et al. 2011a; Wolanski and Kingsford, 2014; Atema et al. 2015) larval behaviour for searching nursery habitats is expected to change during the larval development, using a hierarchy of sensorial cues to detect and ingress into nursery habitats (Teodósio et al., 2016). In offshore areas, away from nursery cues, the post-flexion temperate fish larvae are guided towards the coast by sun compass, earth's geomagnetic field, and innate swimming behaviour. In nearshore areas, these larvae can detect and follow nursery cues, including odour, sound and visual cues (Leis et al., 1996; Montgomery et al., 2006; Gerlach et al., 2007; Paris et al., 2013a; Faillettaz et al., 2015). After detecting nursery cues, temperate fish swim directly towards nursery habitats, using a set of swimming behaviours that vary according with cue intensity, combined with diel rhythms and feeding and predator avoidance strategies (Teodósio et al., 2016). Thus, the development of sensorial and swimming capabilities, that naturally interact with physical transport processes, has been linked to an active larval behaviour on dispersion and recruitment outcomes (Wolanski et al., 1997; Armsworth, 2001; Atema et al., 2002; Leis, 2006; Drake et al., 2011; Teodósio et al., 2016).
1.2.1 Larvae swimming capabilities
In general, pre-flexion larvae are poor swimmers (Leis, 2010), but due to the ontogenetic changes occurring during larval phase (e.g., development of fins, body musculature and skeleton ossification), and post-flexion larvae show improved swimming capabilities (Leis, 2006). However, there are exceptions: for example, of theSenegalese sole Solea senegalensis
6
(Kaup, 1858; Soleidae), pre-flexion larvae swim faster than post-flexion larvae, that quickly acquire a flat body to substrate adjustment (Faria et al., 2011b). Thus, it is important to consider morphological characteristics of larvae when comparing swimming performance across fish taxa.
The pelagic post-flexion fish larvae can be strong swimmers, with active horizontal and vertical capabilities (Leis et al., 1996; Stobutzki and Bellwood, 1997; Leis and Carson-Ewart, 2003). These larvae can swim horizontally at speeds greater than ambient currents, in a highly directional way, travelling long distances (Leis et al., 1996; Stobutzki and Bellwood, 1997; Leis and Carson-Ewart, 2003; Atema et al., 2015). Moreover, fish larvae can actively adjust their vertical position in the water column (Leis et al., 1996), allowing the active selection of appropriate currents to facilitate transport (Sponaugle et al., 2002; Paris and Cowen, 2004). As they can detect nursery habitats (Leis et al., 1996; Montgomery et al., 2001) through the development of sensorial abilities and maintaining their position there (Watt-Pringlea and Strydom, 2003), the development of swimming capabilities has been recognized as influencing larval dispersal (Stobutzki and Bellwood, 1997; Armsworth, 2001; Sponaugle et al., 2002; Atema et al., 2002; Leis, 2006; Drake et al., 2011) and settlement location (Wright et al., 2005). Swimming capabilities have also important consequences for fish’s ecological processes (Westcott and Graham, 2000), including in responses to predators, foraging abilities (Weins et al., 1995; Fisher, 2005; Jørgensen et al., 2014), conspecific interactions, and sensitivity to other biotic and abiotic conditions (Weins et al., 1995), influencing survival and recruitment of fish larvae (Cowen et al., 2000; Fisher, 2005; Leis, 2006).
In general, coral reef fish larvae have higher swimming capabilities than temperate and cold fish larvae. Most studies on swimming performance of fish larvae used tropical species, with high swimming speeds (e.g., Stobutzki and Bellwood, 1997; Fisher et al., 2000, 2005; Fisher, 2005; Leis et al., 2007), ranging from 5 to 100 cm s−1[3-46 Body length s−1 (BL s−1)] (Fisher et al., 2005; Leis, 2006). The good larval swimming performance was recently reported for temperate fish species (e.g., Koumoundouros et al., 2009; Faria et al., 2011b, 2014; Peck et al., 2012; Silva et al., 2015; see Table 2.1), varying between 0 and 33 cm s−1 (0-15.7 BL s−1; see Table 2.1). In addition, the maximum distance travelled by coral reef fish larvae evaluated in swimming endurance trials is 140.2 km (Leis and McCormick, 2002), higher than that registered for temperate species (80.9 km; see Table 2.1). Due to the reported influences of phylogeny, morphology (Leis and McCormick, 2002), fast development (Kashef et al., 2014)
7
and environment (e.g., water temperature; Leis, 2010) on larval swimming capabilities, fish larvae are expected to swim more efficiently in warm-waters than in respected to temperate and cold-waters (Hunt von Herbing, 2002). Tropical fish larvae develop more rapidly than temperate and cold-water fish larvae, and exhibit different morphological characteristics, including body shape and muscle mass (Leis, 2006; Peck et al., 2012). Water temperature affects both the physiology of fish larvae (e.g., muscle contractility) and physical properties of seawater, the viscosity of water (Fuiman and Batty, 1997; Hunt von Herbing, 2002). As the seawater viscosity increases with decreasing temperature (Leis, 2006), most of the temperate and cold-water fish larvae swim in a more viscous environment (Reynolds number – Re < 300; Fuiman and Batty, 1997; Silva et al. 2014). This fact could partly explain their lower swimming speeds in comparison with warm-water fish larvae, that swim in a more inertial environment (Re < 300; Fuiman and Batty, 1997; Leis, 2006).
8
Table 1.1. Summary of reports on swimming performance (critical swimming speed – UCrit, and swimming endurance) of temperate fish species,
including size range. (na – data not available)
Order Family Species Size range
(mm)
Ucrit
(cm s-1)
Endurance
(km) Reference
Anguiliformes Anguilidae Anguilla rostrate 48.7-68.1 6.5-21.1 na Wuenschel and Able, 2008
Congridae Conger oceanicus 68.3-117.8 4.1-26.8 na Wuenschel and Able, 2008
Atheriniformes Atheriniidae Atherina presbyter 6.6-21.0 3.6-18.7 na Faria et al., 2014
Clupeiformes Clupeidae Sardina pilchardus 7.9-23.4 1.6-9.5 na Silva et al., 2014
Gadiformes Gadidae Gadus morhua Na 1.2-9.7 na Guan et al., 2008
Gobiesociformes Gobiesocidae Lepadogaster lepadogaster 5.1-10.9 1.0-9.4 na Faria and Gonçalves, 2010
Lepadogaster purpurea 5.3-10.9 1.2-6.5 na Faria and Gonçalves, 2010
Perciformes Percichthyidae Macquaria novemaculeata 4.0-10.4 0-1.5 0-12.5 Clark et al., 2005
Morone saxatilis 0.5-2.6 6.1-8.9 na Chick and Van Den Avyle, 2000
Sciaenidae Argyrosomus japonicus 3.0-14.0 4.0-16.6 0-22.4 Clark et al., 2005
Scianops ocellatus 3.0-19.1 1.1-20.5 na Faria et al., 2009
Sparidae Acanthopagrus australis 4.9-11.1 2.0-27.0 na Clark et al., 2005
Diplodus capensis 8.9-16.0 2.8-35.2 0.2-32.4 Pattrick and Strydom, 2009
Pagrus auratus 2.2-10.4 2.0-27.3 0-9.9 Clark et al., 2005
Sarpa salpa 12.1-21.3 4.8-33.4 0.07-64.8 Pattrick and Strydom, 2009
Sparus aurata 6.2-14.1 3.0-19.3 10.2-23.9 Faria et al., 2011a
Pleuronectiformes Solenidae Solea senegalensis 3.5-7.5 0.4-5.0 na Faria et al., 2011b
9
1.2.2 Detection of environmental cues for habitat selection
In terms of recruitment, swimming capabilities are potentially useful only if larvae can detect environmental cues that guide them towards suitable settlement habitats (Doherty, 2006). Several studies have reported that fish larvae have an active participation in habitat choice. In respect to random allocation, any behaviour that guides individuals to select one habitat over another (Atema et al., 2002; Gerlach et al., 2007; Dixson et al., 2008), could be crucial for fish recruitment and could be mediated by the presence and interaction of multiple cues (Kingsford et al., 2002; Teodósio et al., 2016). Fish larvae use different senses to choose a suitable settlement habitat according to environmental characteristics/cues, such as odour (Atema et al., 2002, Gerlach et al., 2007, Dixson et al., 2008; Morais et al., 2017), sound (Montgomery et al., 2006; Leis et al., 2011) and vision (e.g., Whitfield, 1994; Faillettaz et al., 2015).
Although all these senses could contribute to habitat choice, olfaction has been recognised as the prevalent strategy for locating nursey habitats (Atema et al., 2002; Lecchini et al., 2005; Døving et al., 2006; Dixson et al., 2008; Morais et al., 2017). Fish larvae can feel odour cues over greater distances than any other environmental cue, and at very early developmental stages (Leis, 2010). In fact, fish larvae are capable to distinguish and follow several chemical stimuli present in water, derived from different substrate types (Carr, 1991), vegetation (Gerlach et al., 2007; Radford et al., 2012), presence of conspecifics (Døving et al., 2006), predators and prey (Lecchini et al., 2005), and use them for locate nursery habitats (Atema et al., 2002; Lecchini et al., 2005; Døving et al., 2006; Paris et al., 2013a). These odour cues are mixed and dispersed by oceanographic processes like waves, currents, and tides (Igulu et al., 2013), influencing the concentration and spatial gradients of chemical stimuli (Kingsford et al., 2002). For example, plumes generated by rivers, estuaries and lagoon habitats can be transported over tens of kilometres offshore by wind and ocean currents (Grimes and Kingsford, 1996; Atema et al., 2002).
Auditory capabilities (e.g., swim bladder, otoliths) are be useful for fish larvae to detect and follow nursery habitats (Montgomery et al., 2006; Radford et al., 2012; Lillis et al., 2014; Atema et al., 2015). The ability to detect sounds develops early in the larval phase, and increases during ontogeny (Leis, 2007). Fish larvae can discriminate between ecosystem soundscapes produced by the living animals, for example snapping shrimps, fish calls and grazing sea urchins (Simpson et al., 2013; Lillis et al., 2014; Atema et al., 2015), or by waves breaking