Market Orientation and Hotel Industry: Developing a Measurement
Model
Carlos Alberto Fernandes Sampaio1, José Manuel Hernández-Mogollón2, Ricardo Gouveia Rodrigues3 1 Instituto Politécnico de Castelo Branco, Castelo Branco, Portugal, [email protected]
2 Universidad de Extremadura, Cáceres, Espanha, [email protected] 3 Universidade da Beira Interior, Covilhã, Portugal, [email protected]
Abstract.This study seeks to fill a gap in market orientation literature about the hotel industry and deals with the construction of a market orientation scale tailored based on a sample obtained from the hotel industry in a multicultural context. The proposed model has three dimensions: intelligence generation, intelligence dissemination and coordinated response to the client, competition and market structure domains. Research results indicate that the scale has good psychometric indicators. Content validity was assessed by questioning a group of marketing experts across Western Europe. Working data indicates that the proposed model holds convergent and discriminant validity as well reliability. Keywords: Key words: Hotel industry; market orientation; scale construction
1
Introduction
Market orientation theoretical background, despite early developments in the 1950s, was developed in the 1990s. Narver and Slater [1] and Kohli and Jaworski [2] established the foundations for the following research on this issue. During the 1990s, several contributions were made that shaped the present state of market orientation study [1–6]. Although, despite the extensive work established during this period, subsequent developments were based mainly on the Kohli and Jaworski [2] and Narver and Slater [1] research.
Notwithstanding the fast development in market orientation study in the 1990s, the advent of the 2000s brought a substantial increasing of published research on market orientation [7].
On the other hand, market orientation research focused mainly on its relationship with business performance. Several studies focused on market orientation literature analysis, concluded a positive effect of market orientation in business performance [7–12]. Similarly, empirical research on this issue have had the same conclusion [13–16].
Regardless of the extensive literature developed during the 1990s and early 2000s, market orientation research on services sector, particularly empirical research about service provider companies as hotels and other leisure providers, were scarce, implying that the market orientation knowledge on the service sector was developed based on literature produced in the manufacturing sector [17]. Research on this subject about the services sector mainly focused on healthcare providers, insurance companies, banks, finance services, and nonprofit organizations [18].
Recent years carried out an additional amount of market orientation research on hotel sector companies, although few theoretical contributions were made to develop the market orientation construct or to adapt it to the hotel firms. In fact, despite these contributions, empirical research on this subject still use mainly the MARKOR and MKTOR scales. Furthermore, despite some advances made in adapting these models to hotels sector companies [13, 19, 20], no major theoretical developments were made, using data from the hotel industry.
Typically, empirical studies on market orientation in hotel industry uses the MARKOR scale [1] or the MKTOR scale [4], or some kind of adaptation. Despite the high acceptance of these models, several criticism to its psychometrics characteristics, namely to validity and reliability issues were highlighted. On the other hand, using these models to assess market orientation raises the same doubts of the underling models, and to construct new measurement models by synthetizing existent measures of the same construct is to avoid without reference to appropriate theory and conceptualization [21].
Furthermore, despite several studies conducted in recent years about market orientation in the hotel industry, in general, empirical research was based in a country or a country region context [14, 19, 20, 22, 23]. In fact, literature analysis suggests that studies, with an international scope, about market orientation in the hotel sector companies, are scarce.
Accordingly, this work seeks to contribute to the development of market orientation literature in hotel industry companies. The authors develop a market orientation measurement scale, tailored using a sample obtained from hospitality sector firms. Working data were obtained from an international context. Particularly, a sample of hotels from Western Europe was used (France, Ireland, Italy, Portugal, Spain and the United Kingdom).
This paper seeks to develop, considering the specificities of the existing market orientation measurement models, a valid and reliable scale, suitable for the hotel industry sector, developed based using a sample gathered in an international context.
2
Literature review
2.1 Measuring market orientation
Two main proposals were made in developing market orientation definition. Market orientation as the “organizational culture that most effectively and efficiently creates the necessary behaviors for creating superior value for buyers and, thus, continuous superior performance” [1], and the “organizationwide generation of market intelligence pertaining to current and future customer needs, dissemination of intelligence across departments, and a organizationwide responsiveness to it” [2].
These definitions settled the foundations of the past quarter century of market orientation research. Accordingly, market orientation was seen as part of one of two approaches [24], a cultural approach [1, 6] and a management approach [2, 5, 25]. Notwithstanding these different approaches, literature on this subject mainly focused on the relationship between market orientation and business performance. Furthermore, empirical research provided strong evidences of a positive effect between the former and the last one [3, 7, 13, 14, 26–36], emphasizing the importance of market orientation in companies.
Moreover, empirical research on market orientation, despite wide, mainly uses Jaworski and Kohli [3] scale, or its reduced version, MARKOR scale [4] and the MKTOR scale [1]. Nevertheless, several original measurement scales [5, 6, 37] were developed, although without any particular acceptance among researchers. MARKOR and MKTOR scales are, even nowadays, the most used models, and subsequent developed models were mostly based on them.
Notwithstanding the importance of these measurement models, MARKOR and MKTOR scales present several problems and raised some criticisms about its validity and reliability [21, 38–41]. On the other hand, the scales development context raised doubts about its generalization to other geographical and cultural contexts. For instance, the relationship between market orientation and business performance presents slightly different results, by context [8, 10, 12, 42] or according the used scale [9, 12, 42, 43].
Results achieved when using MARKOR and MKTOR scales have also suffered several criticisms, namely, the inconsistency of the relationship between market orientation and business performance. On the other hand, several problems regarding the MARKOR and MKTOR scales’ psychometric characteristics where emphasized, namely the statistical validity and the doubts about its consistence with the theoretical definition. These models present several validity issues [21, 38], fit problems [41, 44] and a narrow conceptualization [40]. Furthermore, “new” market orientation models, that are no more than synthesizing existing measures of the same construct [21], are frequently found in literature and did not add much to the development of the subject.
Despite the criticisms, the main question about this issue is related with the accuracy of market orientation measurement. Currently, empirical research on market orientation uses the existing market orientation measurement models, mainly MARKOR and MKTOR models, or adaptations based on them. Likewise, the same MARKOR and MKTOR dimensions and thus the same structures are used by researchers even when developing new scales, putting at the center of the process a certain level of intelligence generation, intelligence dissemination and response to the information, about costumers, competition and interfunctional coordination.
2.2 Market orientation and the hotel industry
The hospitality sector has been overlooked in the development of existing market orientation measurement models. In general, the scales used to measure this matter in the hotel industry are based in preexistent models, namely the MARKOR scale [19, 45, 46] and MKTOR scale [14, 20, 22, 30, 47], or adaptations. Only recently some proposals were settled to improve and adapt these models to the hotel industry [19, 20].
Similarly, only recently have market orientation research on the hospitality sector been was published more frequently [14, 19, 20, 22, 30, 45–49], although, empirical research with an international scope is scarce. It is hard to find market orientation research about the hotel industry using a sample gathered in an international context. A search using Google Scholar search engine retrieved only the Au and Tse [50] and Zhou et al. [47] studies using samples gathered in several cultural contexts.
Market orientation should produce a positive effect on hotels business performance. Furthermore, hotel managers and owners, in order to develop a long-term profitable enterprise, must put clients’ interest first [17], and client orientation, as part of a market-orientated company, seems to perform a dominant role in obtaining a competitive advantage in service sector [47].
On the other hand, empirical research on the relationship between market orientation and business performance, notwithstanding some inconsistent results [23, 50], states a positive relation between market orientation and business performance [19, 20, 22, 30, 45, 48, 51], reflecting a certain unanimity about it.
Furthermore, market orientation, if implemented, enables value creation for costumers and a continuous business performance improvement [1], and allows a unifying objective to individuals and departments, conducing to a superior business performance. It also produces in the workforce a sense of belonging to the organization, in which the central goal is to satisfy the customer, conducing to a compromise with the efforts of clients’ satisfaction [2], and consequently improving business performance.
3
Methodology
3.1 Item generation and content validity
Churchill [52], Webb [53] and Nunnaly and Bernstein [54] recommendations were followed in order to develop the proposed scale.
First, a qualitative step was conducted. A strong analysis to the existent market orientation literature was done and a special focus in the service sector and the hotel industry market orientation research was given.
Literature analysis enabled to specify the construct domain [52]. Several market orientation measurement models were analyzed, original scales, or adaptations of existing scales. Its construction process was evaluated and an item by item analysis was conducted.
This procedure enabled to identify the proposed scale dimensions and its measurement indicators. As for the proposed scale dimensionality, there is a certain unanimity among researchers about the multidimensionality of the market orientation construct [1, 2, 5, 20, 55–59]. Consequently, based on the literature analysis, it was proposed market orientation as a multidimensional construct with three dimensions: intelligence generation, intelligence dissemination and coordinated response to market information. These dimensions should measure three domains: client domain, competition domain and market structure domain.
On the other hand, the authors identified on the literature two forms of indicators: action indicators, as frequency, quickness, and use, and position indicators as level, commitment, and existence.
Therefore, a set of twenty-one items were developed to measure the frequency, quickness, use, level, commitment, and existence of intelligence generation, intelligence dissemination, and coordinated response about client, competition and market structure domains.
Following, content validity was tested. According Nunnaly and Bernstein [54], content validity analysis is essentially a subjective process and largely based upon opinions of various users. Therefore, the proposed scale was sent to a set of experts in marketing. Experts were PhD holders in the field of marketing, selected from universities from Western Europe countries, and were asked to evaluate the model items.
Furthermore, experts were asked to make a positive or negative judgement about the items’ structure and the linkage between the items and the dimensions (intelligence generation, intelligence dissemination, and coordinated response). If a negative judgement were produced, experts were asked to specify and give insights about how to improve the model items and dimensions.
Based on the experts feedback a minor change was made in one item. As for the remaining twenty items and the proposed scaled dimensions, the experts’ answers revealed unanimity in supporting them.
Therefore, the proposed model was based on twenty-one items, with three dimensions of intelligence generation, intelligence dissemination and coordinated response, each one with seven items, according the proposed theoretical model and the content validity test.
The market orientation proposed model is described in Appendix 1.
3.2 Questionnaire and data
Data used in this research were collected using an online survey sent to the managers of 32377 hotels around Western European countries.
The statistical population was composed by the set of hotel companies from, France, Ireland, Italy, Portugal, Spain and the United Kingdom.
Hotel companies were defined as tourist accommodation establishments. A local kind-of-activity unit providing a paid service (although the price might be partially or fully subsidised) short-term or short-stay accommodation services [60].
Hotel contacts were obtained in government tourism departments and yellow pages’ services around the study context.
A total of 447 valid surveys were obtained, among them, 21 (4.7%) were one star hotels, 70 (15.66%) were two star hotels, 162 (36.24%) were three star hotels, 159 (35.57%) were four star hotels, and 35 (7.83%) were five star hotels.
Concerning the industrial structure, 79 (17.67%) hotels were part of a hotel chain and 368 (82.33%) were independent hotels.
Data collection was performed between October 2013 and January 2014. The questionnaire was part of a wider study on market orientation and business performance relation, and was divided in three parts, each related with the market orientation proposed dimensions.
All valid questionnaires were answered by the hotels’ directors, marketing department directors or direction assistants.
4
Results
Data analysis was conducted in three steps. First, a scale purification was performed. Next, in order to test whether data fit the hypothesized theoretical model, a confirmatory factor analysis (CFA) was conducted. Finally, convergent validity, discriminant validity and reliability were evaluated.
4.1 Measurement model purification
Market orientation construct was defined as a second order construct with three dimensions, intelligence generation, intelligence dissemination and coordinated response. Therefore, to conduct a confirmatory analysis, data were computed in IBM SPSS Amos 24.
Conducting a factor analysis during the early stages of developing measurement models could produce many more dimensions than those conceptually identified [52]. Therefore, prior to the CFA analysis, items correlations to underlying constructs were evaluated, in order to purify the measurement model.
An item to construct correlations of 0.30 to 0.40 are the minimum acceptable, although values above 0.50 are a requirement. Statistical significance depends of the sample size. For instance, a correlation of 0.30 needs a minimum of 350 valid questionnaires [61]. Although, a correlation below 0.55 indicates that the variable shares little in common with the other measurements, that is of questionable value in defining the component [62]. Thus, during the purification process, a decision was made to raise the threshold level, and variables with correlation less than 0.60 were removed from the model.
Computed data were evaluated and, in this preliminar stage, five variables were removed from the model. Three variables were removed from intelligence generation construct, MODDI1 (0.54), MODGI3 (0.56) and MODGI7 (0.47), and two withdrawn from coordinated response construct, MODRpC1 (0.55) and MODRpC3 (0.18).
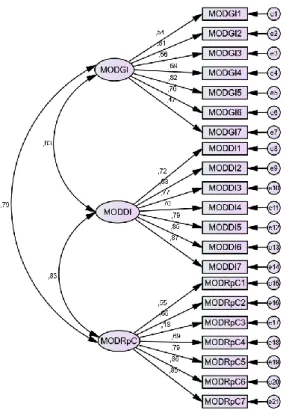
Fig. 2. Second tier measurement model
4.2 Confirmatory factor analysis
A multivariate normality test was conducted. Figure 3 summarizes data skewness, kurtosis and critical values.
Variable skew c.r. kurtosis c.r.
MODGI2 -0,643 -5,551 -0,802 -3,46 MODGI4 -1,206 -10,411 0,794 3,428 MODGI5 -0,925 -7,98 0,149 0,643 MODGI6 -0,901 -7,78 0,005 0,02 MODDI1 -0,716 -6,181 -0,701 -3,025 MODDI2 -0,267 -2,304 -1,36 -5,868 MODDI3 -0,872 -7,53 -0,432 -1,862 MODDI4 -0,039 -0,338 -1,269 -5,474 MODDI5 -0,705 -6,087 -0,584 -2,521 MODDI6 -0,569 -4,907 -0,775 -3,347 MODDI7 -0,668 -5,768 -0,671 -2,896 MODRpC2 -1,488 -12,841 1,704 7,356 MODRpC4 -0,346 -2,987 -0,91 -3,926 MODRpC5 -0,346 -2,985 -0,61 -2,631 MODRpC6 -0,452 -3,9 -0,635 -2,741 MODRpC7 -0,539 -4,653 -0,496 -2,142 Multivariate 96,813 42,643
According to the multivariate normality test conducted, data did not follow a normal multivariate distribution. In order to work around this issue, a 2000 resampling bootstrap procedure was computed [63]. Data from confirmatory factor analysis were evaluated (figure 4 – model 1). Results were modest, thus, once the model was previously purified, modification indices were analysed.
X2 df p X2/df CFI GFI NFI PGFI PNFI PCFI RMSEA
Model 1 491.345 101 0 4.865 0.92 0.86 0.90 0.64 0.75 0.77 0.09
Model 2 403.012 99 0 4.071 0,93 0.89 0.91 0.65 0.75 0.77 0,08
Fig. 4. Model fit indicators
Modification indices revealed an obvious relation between variables MODGI4 and MODGI6, and variables MODRpC4 and MODRpC5. Thus, a second model (model 2) was constructed, and errors from variables MODGI4 and MODGI6, and from variables MODRpC4 and MODRpC5 were correlated, and the second fit values were evaluated (figure 4).
Global fit indices of both models (figure 4) confirm that the second model presents a better fit, furthermore parsimonious are better than the original model. Moreover, scale content validity is assured once it maintains sixteen of the twenty-one original scale variables.
4.3 Convergent validity, discriminate validity and reliability
Average variance extracted (AVE) values were evaluated to assess convergent validity. Convergent validity is achieved if AVE values are above 0.50 [64]. Extracted AVE values indicates convergent validity, MODGI = 0.543, MODDI = 0.583, and MODRpC = 0.583.
As for reliability, extracted data presented values above the 0.70 recommended value. Composite reliability were MODGI = 0.824, MODDI=0.906, and MODRpC = 0.873.
Finally, in order to assess discriminant validity, a chi-square difference test was computed. Three models were constructed, each one with two model’s constructs. MODGI <-> MODDI, MODGI <-> MODRpC and MODDI <-> MODRpC. Then, each one of these models were computed correlating freely and constraining correlation between the two constructs to 0. According Segars [65], if the chi-square difference is significant, it confirms discriminant validity. According extracted data from the chi-square difference, discriminant validity was confirmed.
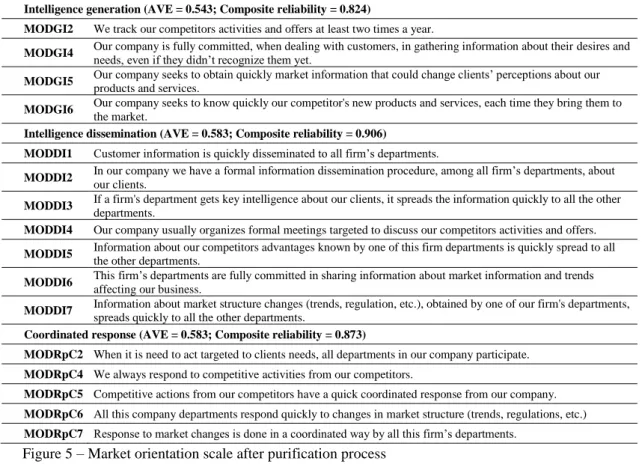
Figure 5 describes the market orientation scale after purification and model fit.
Intelligence generation (AVE = 0.543; Composite reliability = 0.824)
MODGI2 We track our competitors activities and offers at least two times a year.
MODGI4 Our company is fully committed, when dealing with customers, in gathering information about their desires and needs, even if they didn’t recognize them yet. MODGI5 Our company seeks to obtain quickly market information that could change clients’ perceptions about our
products and services.
MODGI6 Our company seeks to know quickly our competitor's new products and services, each time they bring them to
the market.
Intelligence dissemination (AVE = 0.583; Composite reliability = 0.906)
MODDI1 Customer information is quickly disseminated to all firm’s departments.
MODDI2 In our company we have a formal information dissemination procedure, among all firm’s departments, about our clients. MODDI3 If a firm's department gets key intelligence about our clients, it spreads the information quickly to all the other
departments.
MODDI4 Our company usually organizes formal meetings targeted to discuss our competitors activities and offers.
MODDI5 Information about our competitors advantages known by one of this firm departments is quickly spread to all
the other departments.
MODDI6 This firm’s departments are fully committed in sharing information about market information and trends affecting our business. MODDI7 Information about market structure changes (trends, regulation, etc.), obtained by one of our firm's departments,
spreads quickly to all the other departments.
Coordinated response (AVE = 0.583; Composite reliability = 0.873)
MODRpC2 When it is need to act targeted to clients needs, all departments in our company participate. MODRpC4 We always respond to competitive activities from our competitors.
MODRpC5 Competitive actions from our competitors have a quick coordinated response from our company. MODRpC6 All this company departments respond quickly to changes in market structure (trends, regulations, etc.) MODRpC7 Response to market changes is done in a coordinated way by all this firm’s departments.
Figure 5 – Market orientation scale after purification process
5
Conclusions, implications and limitations
5.1 Conclusions
This study sought to develop a valid and reliable market orientation measurement scale based on a sample from the hotel industry obtained in an international context. Conversely, previous studies on this subject were based on adapting earlier developed models, MKTOR [20, 30, 47] and MARKOR [13, 19, 45, 46]. Consequently, some innovation was brought out, contributing to develop market orientation study in services sector and particularly in hotel industry.
The developed market orientation scale was based on three dimensions, intelligence generation, intelligence dissemination and coordinated response, related with three domains: client, competition and market structure. Despite similarities with former studies, it is widely accepted that market orientation construct is composed of some degree of intelligence generation, intelligence dissemination, and a response (coordinated) about domains of client, competition and market structure. On the other hand, a main contribution arising from this study was accomplished by identifying a set of measurement indicators: action indicators, as frequency, quickness, and use; and position indicators as level, commitment, and existence.
Therefore, this study also makes some theoretical contributions. A qualitative literature analysis was conducted to study and identify the theoretical background of the proposed market orientation scale. An extensive market orientation literature analysis was done and a set of previous market orientation scales were evaluated as well as their construction process. In order to validate scale content validity, items and dimensionality, a survey was sent to a group of marketing experts in the analyzed context, asking whether the proposed scale fills the underlying market orientation measurement construct.
Furthermore, an empirical analysis was conducted using a sample obtained from hotels from Western Europe. Firstly, the proposed market orientation scale suffered a purification process, during which five items were removed from de model once the correlation with underlying construct was below 0.60 threshold defined.
Next, a confirmatory factor analysis was carried out. Fit measures were evaluated, although evidence of interrelations between variables led to a second model construction. The second model presented a better fit and better parsimony indicators, implying that the model dimensionality should incorporate these changes.
Moreover, market orientation scale validity and reliability were tested. Results confirm that the proposed scale presents convergent and discriminant validity. Composite reliability results, above the threshold of 0.70 [66], indicate that the scale is reliable.
Thus, this study proposed a market orientation measurement scale, developed based on a sample of hotel sector companies. The performed research found a scale able to obtain good psychometric indicators in a multicultural context. Particularly in a context that accounts in a large amount to the international tourism.
5.2 Implications, limitations and further research
From a theoretical perspective, it is believed that this research contributes in taking a step forward in the study of market orientation in service sector and hospitality industry. The proposed scale implies two main developments related with two problems facing the study of market orientation in the hotel industry. Firstly, the developed scale was built based solely on taking a sample from the hotel sector’s companies in account, thus the results from this study are not biased by factors that are external to the hotel industry. Moreover, the scale was developed based in the international context, culturally somehow far from the MAKROR and MKTOR developing context. Thus, this model should be considered in measuring market orientation in multicultural contexts. A substantial part of hotels in Europe are small companies with less than 10 employees [67] . Increasing and maintaining a certain degree of market orientation is a complex process that requires considerable expenditure of money and time [68]. On the other hand, having market orientation requires a commitment of resources and is only useful if the benefits it affords exceeds the cost of those resources [2]. Therefore, from a managerial perspective this model implies a step forward in making hotels adopt a certain degree of market orientation and continuously assess it.
On the other hand, theoretical background and empirical research on market orientation states a positive relationship between market orientation and business performance. However, the existent measurement models present validity and reliability issues and were developed based in an economic sector and a context other than the hospitality sector and the European context. Therefore, by fostering the study of market orientation in the hotel industry and proposing a measuring model suitable, hotel manging have at disposal a tool to assess and develop a market-oriented company. Furthermore, the international scope of this study should give a strong support for hotel managers in order to evolve market orientation.
From an empirical perspective it is believed that the proposed model has a major implication on market orientation research in hotel industry sector. Considering the international character of this study, the scale should be able to produce valid and reliable results across different contexts.
This work deals with several important questions related to market orientation study in the hotel industry. Despite the enlightenment brought to the subject, it carries a number of limitations that suggest the need for further research. Firstly, this work main objective was to develop a measurement scale adapted to the hotel industry. Most the literature on this subject seeks to assess the relationship between market orientation and business performance. The aim of this study was not to study this relation, conversely, this work sought to develop a tool able to better study this relation. Thus, future work on this issue should seriously consider using the developed scale in order to evaluate market orientation and its relationship with business performance.
Furthermore, the context in study is quite large. Not only do the countries that are part of the sample have a large contribution in Europe and World tourism, but the number of accommodation establishments in the context is large. Accessing for the respondent is not an easy task, although, decisions made led researchers to find that the best methodology to deal with this issue was the online survey, with all the intrinsic cons, namely the low response rate.
Further research should consider using the developed market orientation scale and test its relationship with business performance. Additionally, it would be interesting to evaluate the measurement constructs and test their validity and reliability country by country. Moreover, the scale should be evaluated in a context out of Europe. Proposed scale skills need to be assessed in culturally distant contexts in order to fully assess their features.
Additionally, research should be conducted in order to compare the scale with previous developed models, namely MARKOR and MKTOR scales, or adaptations.
Appendix 1 – Market orientation proposed scale
Intelligence generation
MODGI1 We poll our clients to assess our products and services quality.
MODGI2 We track our competitors activities and offers at least two times a year.
MODGI3 We have a gathering information informal procedure (ex: diners, informal meetings, etc.) about market developments and trends (ex: market structure, etc.) MODGI4 Our company is fully committed, when dealing with customers, in gathering information about their desires and needs, even if they didn’t recognize them yet. MODGI5 Our company seeks to obtain quickly market information that could change clients’ perceptions about our
products and services.
MODGI6 Our company seeks to know quickly our competitor's new products and services, each time they bring them to
the market.
MODGI7 People in this firm, other than sales people, obtain informal information about our competitors.
Intelligence dissemination
MODDI1 Customer information is quickly disseminated to all firm’s departments.
MODDI2 In our company we have a formal information dissemination procedure, among all firm’s departments, about
our clients.
MODDI3 If a firm's department gets key intelligence about our clients, it spreads the information quickly to all the other
departments.
MODDI4 Our company usually organizes formal meetings targeted to discuss our competitors activities and offers.
MODDI5 Information about our competitors advantages known by one of this firm departments is quickly spread to all
the other departments.
MODDI6 This firm’s departments are fully committed in sharing information about market information and trends affecting our business. MODDI7 Information about market structure changes (trends, regulation, etc.), obtained by one of our firm's departments,
spreads quickly to all the other departments.
Coordinated response
MODRpC1 All our company departments are fully committed to respond our clients’ needs and desires. MODRpC2 When it is need to act targeted to clients needs, all departments in our company participate.
MODRpC3 Some of this company’s departments take more time than it should to respond to our clients’ needs and desires. MODRpC4 We always respond to competitive activities from our competitors.
MODRpC5 Competitive actions from our competitors have a quick coordinated response from our company. MODRpC6 All this company departments respond quickly to changes in market structure (trends, regulations, etc.) MODRpC7 Response to market changes is done in a coordinated way by all this firm’s departments.
References
1. Narver JC, Slater SF (1990) The Effect of a Market Orientation on Business Profitability. J Mark 54:20–35
2. Kohli AK, Jaworski BJ (1990) Market Orientation: The Construct, Research Propositions and Managerial Implications. J Mark 54:1–18
3. Jaworski BJ, Kohli AK (1993) Market Orientation: Antecedents and Consequences. J Mark 57:53–70 . doi: 10.2307/1251854 4. Kohli AK, Jaworski BJ, Kumar A (1993) MARKOR : A measure of market orientation. J Mark Res 30:467–477
5. Ruekert RW (1992) Developing a market orientation: An organizational strategy perspective. Int J Res Mark 9:225–245 . doi: 10.1016/0167-8116(92)90019-H
6. Deshpandé R, Farley JU, Webster Jr. FE (1993) Corporate Culture, Customer Orientation, and Innovativeness in Japanese Firms: A Quadrad Analysis. J Mark 57:23–37
7. Liao S-H, Chang W-J, Wu C, Katrichis JM (2011) A survey of market orientation research (1995–2008). Ind Mark Manag 40:301–310 . doi: 10.1016/j.indmarman.2010.09.003
8. Kirca AH, Jayachandran S, Bearden WO (2005) Market Orientation: A Meta-Analytic Review and Assessment of Its Antecedents and Impact on Performance. J Mark 69:24–41 . doi: 10.1509/jmkg.69.2.24.60761
9. Cano CR, Carrillat FA, Jaramillo F (2004) A meta-analysis of the relationship between market orientation and business performance: evidence from five continents. Int J Res Mark 21:179–200 . doi: 10.1016/j.ijresmar.2003.07.001
10. Shoham A, Rose GM, Kropp F (2005) Market orientation and performance: a meta-analysis. Mark Intell Plan 23:435–454 . doi: 10.1108/02634500510612627
11. Chang W, Franke GR, Butler TD, et al (2014) Differential Mediating Effects of Radical and Incremental Innovation on Market Orientation-Performance Relationship: A Meta-Analysis. J Mark Theory Pract 22:235–250 . doi: 10.2753/MTP1069-6679220301
10.1016/S0263-2373(03)00073-2
13. Wang C-H, Chen K-Y, Chen S-C (2012) Total quality management, market orientation and hotel performance: The moderating effects of external environmental factors. Int J Hosp Manag 31:119–129 . doi: 10.1016/j.ijhm.2011.03.013 14. Haugland SA, Myrtveit I, Nygaard A (2007) Market orientation and performance in the service industry: A data
envelopment analysis. J Bus Res 60:1191–1197 . doi: 10.1016/j.jbusres.2007.03.005
15. Lee Y-K, Kim S-H, Seo M-K, Hight SK (2015) Market orientation and business performance: Evidence from franchising industry. Int J Hosp Manag 44:28–37 . doi: 10.1016/j.ijhm.2014.09.008
16. Nwokah NG (2008) Strategic market orientation and business performance. Eur J Mark 42:279–286 . doi: 10.1108/03090560810852922
17. Tajeddini K (2010) Effect of customer orientation and entrepreneurial orientation on innovativeness: Evidence from the hotel industry in Switzerland. Tour Manag 31:221–231 . doi: 10.1016/j.tourman.2009.02.013
18. Polo-Peña AI (2010) La orientación al mercado en el sector del turismo rural: Efectos en los resultados de la actividad empresarial y en el valor percibido por el mercado. Universidad de Grandada
19. Polo-Peña AI, Frías-Jamilena DM, Rodrigues-Molina MÁ (2012) Validation of a market orientation adoption scale in rural tourism enterprises. Relationship between the characteristics of the enterprise and extent of market orientation adoption. Int J Hosp Manag 31:139–151 . doi: 10.1016/j.ijhm.2011.06.005
20. Campo S, Díaz AM, Yagüe MJ (2014) Market orientation in mid-range service, urban hotels: How to apply the MKTOR instrument. Int J Hosp Manag 43:76–86 . doi: 10.1016/j.ijhm.2014.08.006
21. Farrell M (2002) A Critique of the Development of Alternative Measures of Market Orientation. Mark Bull 13:1–14 22. Sin LYM, Tse ACB, Heung VCS, Yim FHK (2005) An analysis of the relationship between market orientation and business
performance in the hotel industry. Int J Hosp Manag 24:555–577 . doi: 10.1016/j.ijhm.2004.11.002
23. Sargeant A, Mohamad M (1999) Business Performance in the UK Hotel Sector - Does it Pay to be Market Oriented? Serv Ind J 19:42–59 . doi: 10.1080/02642069900000029
24. Lafferty BA, Hult GTM (2001) A synthesis of contemporary market orientation perspectives. Eur J Mark 35:92–109 . doi: 10.1108/03090560110363364
25. Shapiro BP (1988) What the Hells Is “Market Oriented”? Harv Bus Rev 119–125
26. Baker WE, Sinkula JM (2009) The complementary effects of market orientation and entrepreneurial orientation on profitability in small businesses. J Small Bus Manag 47:443–464 . doi: 10.1111/j.1540-627X.2009.00278.x
27. Homburg C, Pflesser C (2000) A Multiple-Layer Model of Market-Oriented Organizational Culture: Measurement Issues and Performance Outcomes. J Mark Res XXXVII:449–462
28. Hult GTM, Ketchen DJ (2001) Research Notes and Commentaries: Does market orientation matter?: a test of the relationship between positional advantage and performance. Strateg Manag J 22:899–906 . doi: 10.1002/smj.197 29. Slater SF, Narver JC (2000) The Positive Effect of a Market Orientation on Business Profitability: A Balanced Replication. J
Bus Res 48:69–73 . doi: 10.1016/S0148-2963(98)00077-0
30. Agarwal S, Erramilli MK, Dev CS (2003) Market orientation and performance in service firms: role of innovation. J Serv Mark 17:68–82 . doi: 10.1108/08876040310461282
31. Ellinger AE, Ketchenjr D, Hult GTM, et al (2008) Market orientation, employee development practices, and performance in logistics service provider firms. Ind Mark Manag 37:353–366 . doi: 10.1016/j.indmarman.2007.01.002
32. Kara A, Spillan JE, Deshields OW (2005) The Effect of a Market Orientation on Business Performance : A Study of Small-Sized Service Retailers Using MARKOR Scale. J Small Bus Manag 43:105–118 . doi: 10.1111/j.1540-627x.2005.00128.x 33. Raju PS, Lonial SC, Gupta YP, Ziegler C (2000) The relationship between market orientation and performance in the hospital
industry: a structural equations modeling approach. Health Care Manag Sci 3:237–247
34. Martín-Consuegra D, Esteban Á (2007) Market orientation and business performance: An empirical investigation in the airline industry. J Air Transp Manag 13:383–386 . doi: 10.1016/j.jairtraman.2007.08.001
35. Farrell MA, Oczkowski E, Kharabsheh R (2008) Market orientation, learning orientation and organisational performance in international joint ventures. Asia Pacific J. Mark. Logist. 20:289–308
36. Caruana A, Pitt L, Ewing M (2003) The Market Orientation-Performance Link: The Role of Service Reliability. Serv Ind J 23:25–41
37. Deshpandé R, Farley JU (1998) Measuring Market Orientation: Generalization and Synthesis. J Mark Manag 2:213–232 . doi: 10.1023/A:1009719615327
38. Gauzente C (1999) Comparing Market Orientation Scales : A Content Analysis. Mark Bull 10:76–82
39. Siguaw JA, Brown G, Widing II RE (1993) The influence of the market orientation of the firm on salesforce behaviour and attitudes. Sch Bus Discuss Pap
40. Pelham AM (1993) Mediating and moderating influences on the relationship between market orientation and performance. Pennsylvania State University
41. Farrell MA, Oczkowski E (1997) An Analysis of the MKTOR and MARKOR Measures of Market Orientation: An Australian Perspective. Mark Bull 8:30–40
42. Ellis PD (2006) Market Orientation and Performance: A Meta-Analysis and Cross-National Comparisons. J Manag Stud 43:1089–1107 . doi: 10.1111/j.1467-6486.2006.00630.x
43. Vieira VA (2010) Antecedents and Consequences of market orientation: a brazilian meta-analysis and an international mega-analysis. BAR Brazilian Adm Rev 7:40–58 . doi: 10.1590/S1807-76922010000100004
44. Siguaw JA, Diamantopoulos A (1994) The market orientation measure: a reexamination of Narver and Slater’s Scale. In: In: C. Whan Park & Daniel Smith (eds.) Proceedings of the American Marketing Association Winter Educators’ Conference, Volume 5, Marketing Theory and Applications: American Mark, C. Whan Pa. pp 150–151
45. Qu R, Ennew CT (2003) An examination of the consequences of market orientation in China. J Strateg Mark 11:201–2014 . doi: 10.1080/0965254032000133449
46. Quintana-Déniz A, Beerli-Palacio A, Martín-Santana J (2007) Human resource systems as antecedents of hotel industry market orientation: An empirical study in the Canary Islands, Spain. Int J Hosp Manag 26:854–870 . doi: 10.1016/j.ijhm.2006.07.007
47. Zhou KZ, Brown JR, Dev CS (2009) Market orientation, competitive advantage, and performance: A demand-based perspective. J Bus Res 62:1063–1070 . doi: 10.1016/j.jbusres.2008.10.001
48. Sandvik IL, Sandvik K (2003) The impact of market orientation on product innovativeness and business performance. Int J Res Mark 20:355–376 . doi: 10.1016/j.ijresmar.2003.02.002
49. Tse A, Sin L, Yim F, Heung V (2005) Market orientation and hotel performance. Ann Tour Res 32:1145–1147 . doi: 10.1016/j.annals.2004.08.006
50. Au AKM, Tse ACB (1995) The effect of Marketing Orientation on company performance in the service sector: A comparative study of hotel industry in Hong Kong and New Zealand. J Int Consum Mark 8:77–87
51. Gray BJ, Matear SM, Matheson PK (2000) Improving the performance of hospitality firms. Int J Contemp Hosp Manag 12:149–155 . doi: 10.1108/09596110010320643
52. Churchill G a. (1979) A Paradigm for Developing Better Measures of Marketing Constructs. J Mark Res 16:64 . doi: 10.2307/3150876
53. Webb JR (2002) Understanding and Designing Marketing Research, 2nd Ed. Thomson Learning 54. Nunnaly JC, Bernstein IH (1994) Psychometric Theory, 3rd Ed. McGrawHill, New York
55. Gray B, Matear S, Boshoff C, Matheson P (1998) Developing a better measure of market orientation. Eur J Mark 32:884– 903
56. Deng S, Dart J (1994) Measuring Market Orientation: A Multi-factor, Multi-Item Approach. J Mark Manag 10:725–742 57. Lado N, Maydeu-olivares A, Rivera J (1998) Measuring market orientation in several populations A structural equations
model. Eur J Mark 32:23–39
58. Matsuno K, Mentzer JT, Rentz JO (2005) A conceptual and empirical comparison of three market orientation scales. J Bus Res 58:1–8 . doi: 10.1016/S0148-2963(03)00075-4
59. Narver JC, Slater SF, Maclachlan DL (2004) Responsive and proactive market orientation and new-product success. J Prod Innov Manag 21:334−347
60. Eurostat (2013) Glossary:Tourist accommodation establishment. http://ec.europa.eu/eurostat/statistics-explained/index.php/Glossary:Tourist_accommodation_establishment
61. Hair JFJ, Black WC, Babin BJ, Anderson RE (2009) Multivariate Data Analysis: A Global Perspective, 7th editio. Prentice Hall, Upper Saddle River
62. Falk RF, Miller NB (1992) A Primer for Soft Modeling. University of Akron Press, Akron, Ohio
63. Bollen KA, Stine RA (1992) Bootstrapping Goodness-of-Fit Measures in Structural Equation Models. Sociol Methods Res 21:205–229 . doi: 10.1177/0049124192021002004
64. Fornell C, Larker DF (1981) Evaluating Structural Equation Models with Unobservable Variables and Measurement Error. J Mark Res 18:39–50 . doi: 10.2307/3151312
65. Segars AH (1997) Assessing the unidimensionality of measurement: a paradigm and illustration within the context of information systems research. Omega 25:107–121 . doi: 10.1016/S0305-0483(96)00051-5
66. Hair JF, Ringle CM, Sarstedt M (2011) PLS-SEM: Indeed a Silver Bullet. J Mark Theory Pract 19:139–152 . doi: 10.2753/MTP1069-6679190202
67. Eurostat (2017) Annual enterprise statistics by size class for special aggregates of activities (NACE Rev. 2). http://ec.europa.eu/eurostat/web/tourism/data/database
68. Slater SF, Narver JC (1994) Does Competitive Environment Moderate the Market Orientation-Performance Relationship? J Mark 58:46–55 . doi: 10.2307/1252250