7th Iberian International Business Conference
“Iberian Firms in a New World”
ISEG, Lisbon, October 7-8, 2011
INTERNATIONALIZATION UNDER STRAINS:
The case Portugal Telecom in Brazil from the perspective of its
investments, financial performance and returns
Manoel Justiniano Melo da Fonseca
Ph.D Student in Economic and Organizational Sociology, ISEG/Technical University of Lisbon
Joaquim Ramos Silva
Associate Professor, ISEG/Technical University of Lisbon FCT Research Center SOCIUS (ISEG/UTL), PORTUGAL
Ana Maria Ferreira Menezes
Professor, Universidade do Estado da Bahia (UNEB), Salvador, BRAZIL Research Center NUPE (UNEB)
Abstract
The aim of this paper is to analyze the investments made by Portugal Telecom (PT) in the Brazilian telecommunications sector as well as their financial results. There are a lot of complex and multifaceted questions underlying such an issue, mainly related to the size and characteristics of this particular foreign direct investment operation of a Portuguese company. In light of this, we will try to answer to the following points: which are the financial results achieved by PT in Brazil through its investments? Which is their contribution to the financial health of PT from 1998 to 2009? In our research we take into account the perspective of international business theories, particularly at the early stages of the internationalization process, and that of theoretical institutionalism that gives emphasis to the technical environment, analyzing organizations as efficient if they produce goods or services accepted by the market and, consequently, reach their goals. From a company's financial results it can be deduced whether or not the strategy and objectives defined are consistent with the prospect of success and recognition, in line with the arguments developed by Scott (1991, 1992 and 2008). The main part of the paper is thus concentrated in the analysis of the financial results of PT through several indicators regarding investments, revenues, returns and other related aspects. The study allows the conclusion that despite the hard and complex life of PT in Brazil from 1998 to 2009, positive financial results were obtained and the strategy and objectives defined in the beginning of the process had favorable conditions to be successful.
1. Introduction
By the second half of the 1990s, there was a major wave of Portuguese investments in Brazil (Silva, 2005). Increasing macroeconomic stabilization in this country (a consequence of Plano Real in 1994), the implementation of a vast program of privatization, and the consolidation of the openness and liberalization processes, started in the late 1980s, favored the attraction of foreign capitals. The acquisition of Telesp Celular by Portugal Telecom (PT) in July 29, 1998, was by far the greatest Portuguese investment abroad up to now, and its analysis became highly interesting, particularly as regards the Portuguese internationalization through outward FDI. The fact that PT, although with its own privatization in progress, depended strongly on public decisions, initially by ownership, and later through a “golden share”, gave a hot political sensitivity to this investment. Moreover, this wave of Portuguese outward FDI was criticized as being “premature”, and this investment of PT in Brazil in particular was objected in supposedly technical bases such as the argument that PT was benefiting in the domestic market of a public monopoly in an infra-structural sector, and so possibly transferring revenues to Brazil to the detriment of Portuguese consumers (Mateus 2006, pp. 313-4).
Beyond the previous remarks, this process must be put in a broader context. Indeed, frequent shifts of government in Portugal, without a clear and shared internationalization strategy (Silva 2006, 2008), considerably weakened PT position, for example inducing quite often changes in its executive leadership. Moreover, many other factors had a significant impact on the course of this
investment. In first years of PT’s presence in Brazil, for example, the turbulence in the exchange and financial areas (from the adoption of a flexible exchange rate for the real in January 1999 to the financial turmoil that accompanied the passage of the presidency from Fernando Henrique Cardoso to Luiz Inácio Lula da Silva in 2002/2003, etc.), and the aftermath of the dotcom bubble collapse in 2000 that deeply changed the financial conditions where telecommunications’
position of PT in Brazil became an easy target not only for competitors, but also for investors seeking quick cash benefits. Meanwhile, there were moving alliances, but the main case was the creation of VIVO (2003), a joint-venture equally shared by Portugal Telecom and Telefónica Móviles of Spain that grouped the assets of both companies in Brazil; thus, on a basis 50%-50% which of course engendered management problems like uncertainty and other difficulties arising from conflicting interests. There were also two main takeover bids in 2006 and 2010; the former for the entire group (launched by SONAECOM), but where the presence of PT in Brazil was at stake, and the latter launched by Telefónica aiming specifically at the ownership of all VIVO which was successful. In 2011, PT is still in Brazil, but in very different conditions from those that existed after July 1998, as an associate of OI, thus in minority position.
This exploratory paper is part of a broader study of the experience of PT in Brazil from 1998 to 2009. In spite of their importance to understand the institutional environment of this case, most of the questions that have just been raised will not be examined in detail here, rather we will focus on investments, financial performance and returns of PT after the acquisition of Telesp Celular; PT also made other investments in the Brazilian telecommunications sector throughout that period, but due to its importance and implications, we will center our analysis in this one. Within the context of the whole research project, another study has already been published concerning the impact of the internationalization of PT on its organizational structure (Fonseca et al., 2009). The interest of investment returns and financial performance of PT in Brazil is obvious, particularly when there are doubts about the good reason of such an investment. From the statistical point of view, our research will be essentially based on the data provided by the consolidated financial statements, annually published in the Report and Consolidated Accounts of Portugal Telecom.
describe the institutional context of PT’s internationalization focusing on the
home country as well in the main host country (Brazil). Section 4 examines the core subjects of the paper: the investments and financial results consequent to the internationalization of the company, and the major role played by Brazil in this process: some specific aspects will be taken into account such as the weight of this country in the consolidated operating revenues by segment of business and geographical area, and in the number of clients. In the final, Section 5, we draw some remarks highlighting the main empirical findings and the arguments developed in this work.
2. Theoretical background
In the early 1990s, Portuguese firms had no significant experience of internationalization. However, with the structural changes induced by the Portuguese membership of EU, among other factors, the increasing competition in the domestic market they had necessarily to develop their competitive edge in the international market. One of the main aspects of this process was the deepening of the relation of Portuguese economy with FDI inward and outward flows (Silva 2006). In the case of outward FDI flows we may say that they only began at a reasonable scale in the middle of the 1990s; the previous experience was disperse and generally involving small amounts. Moreover, throughout the following decade of 2000, Portuguese outward FDI flows remained globally positive but at a decreasing rate (Júlio & Alves 2011, p. 63). Also, as in the case of Spain (Toral 2006), Portuguese firms initially invested more in regions and countries where they had cultural and linguistic proximity. Due to changes occurred in the 1990s, and developed hereafter, the conditions were particularly favorable in Brazil, and Portuguese firms significantly took that path which has been analyzed in terms of international business theories such as the Nordic School and the OLI Paradigm (Silva 2005).
approach, have stressed the importance of relations between the organization and the environment, considering the culture and the influence on it, in so far the organizations (like firms) are seen by the institutional theory as having two essential dimensions: technical and institutional. The technical dimension is guided by the norms of rationality and efficiency, while the institutional dimension is controlled by the expectations of the external environment. The cognitive and cultural issues came to be analyzed as powerful aspects of economic, social and cultural settings of the organizational environment. According to Scott (1992, p. 157), the emphasis of the analysis shifted from "the technical facets to the institutional facets of the environments.”
It is important to highlight the difference between institutional environment and technical environment, involving different meanings of rationality (Scott 1992). The technical environment controls the products generated by the organizations, the place where the exchange of the services or products takes place is the market, considering that the return is dependent on the efficiency and effectiveness whereby the process is given. The institutional environment is elaborated by rules and requirements to which the organization adapts to gain legitimacy and support of the environment. The institutionalist approach extends the vision incorporating environmental flows and technical exchanges into a system of institutionalized norms and beliefs.
technical and institutional environments. On the one hand, the "rational" in technical environments is what allows organizations to be efficient and to produce goods or services accepted by the market thereby reaching their goals.
On the other hand, “rationality” in institutional environments is found in the procedures, standards and rules capable of providing legitimacy for the organizational present and future.
Thus, the technical factors that analyze the efficiency of an organization are seriously considered and therefore the analysis of the financial results of a company, in our case of PT, can show whether or not the strategy and objectives defined are consistent with the prospect of success and recognition. The questioning of this subject is obtained through the following question: which are the financial results achieved by PT from the investments made in Brazil? As explained later, it is assumed that the answer to this question presupposes that the financial results obtained by the PT in Brazil have a great weight in the total of its performance.
3. The institutional context of Portugal Telecom’s internationalization The internationalization process of PT was presented as a key component of its strategy in 1997 in order to achieve growth and face the challenges of a new era of quick and profound changes. This strategy was clearly expressed in the following terms:
International operations will play an increasing role in the development of the Group, enhanced by the agreements of strategic alliance, and seeking in the next few years to put into effect major investments, especially in Latin America, particularly Brazil, and Africa, in areas of the Maghreb and Portuguese-speaking countries. (PORTUGAL TELECOM, Report and Consolidated Accounts, 1997, p. 22).
Riograndense Telecommunications Company, which had very favorable conditions to grow. With these acquisitions, PT implemented its strategy for entering into new markets with strong growth potential in countries where the company had important advantages, due to linguistic and cultural ties, and of course, knowledge of business. These factors have been determinants in the internationalization process of PT. Despite the prioritization of the Brazilian market, the PT Group reached a much wider international presence, with investments in the following countries: Hungary, East Timor, Macao, Mozambique, Kenya, Angola, Namibia, São Tomé and Príncipe, Cape Verde and Morocco.
If we look at the bases of the strategy of internationalization implemented by PT, it must be noted that:
The whole essence of the strategic vision in management can be summarized in the idea of building at the organizational level, a position that is strong enough to clearly indicate a future direction and flexible enough to be changed according to new environmental conditions. (Motta 2001, p. 92)
The clear indication of “a future direction”, as emphasized long ago by Edith Penrose, is based on “expectations” not “objective facts”, insofar for this author:
‘Expectations’, and not “objective facts”, are the immediate determinant factors of the behavior of a firm, although there may be some relationship between expectations and the “facts”. Effectively, there must be some, if the activity intends to be successful, since the success of plans of a firm in part depends on their implementation, and on whether they are based or not on reasonable judgments about the possibility of successful activities. (2006, p. 85)
In order to analyze the internationalization process of PT towards Brazil, it is necessary to historically contextualize the pull factors of the PT Group. According to Charlton et al. (2003), some reasons can be identified as a stimulus for attracting foreign direct investment to Brazil in the late 1990s:
dimensions: growth in demand for durable and nondurable consumer goods, has been particularly strong for the lower income layers, as much as for the middle class, demand growth in poorer regions has been higher than the national average – all this increased the potential demand in the markets of these goods.
The consolidation of the MERCOSUR regional integration process which provided regulatory reforms for the liberalization of trade, investment and domestic competition.
Trade liberalization and regulatory reform combined with competition among sub-national levels of government (tax competition) to attract investment has provided two types of effects on the location and relocation of production in Brazil. One effect involves a process of industrial decentralization, which was formerly concentrated in São Paulo, in favor of other places in South and Southeast regions. The other effect has been the relocation of some production from the South and Southeast to places in the North, Northeast and Central West regions.
The opening process of the Brazilian economy (started in the late 1980s) had led the productive sector to adjustments because of increasing competition, either caused by lower trade barriers, or by reducing aggregate domestic demand. Significant adjustment efforts were undertaken by large segments of the manufacturing sector in order to become more competitive by reducing costs and improving the quality of its products - despite the recessionary and inflationary context of that period, which tended to discourage investment, and the absence of an industrial policy to support such adjustment changes.
state-owned companies. The privatization through the transfer of property (from public to private entities) was characteristically an example that showed the shrinking of the state's role in managing the economy and the activities related to economic development for the benefit of civil society and private enterprises. In this sense, privatization led to some reduction in the sphere of state functions and in its nature.
Also, in parallel with all these processes, the Luso-Brazilian economic relations after decades of stagnation and poor performance started to increase again. Since the early 1990s this trend became obvious (Silva 2002), and the Portuguese investments after 1995 was undoubtedly the major example of this new course:
Indeed, between 1995 and 2002, Brazil is always found in the three top places of destination of Portuguese outward FDI (in general, switching positions with Spain and the Netherlands), (...). On the other hand, in 2002, we identified approximately 370 Portuguese subsidiaries interacting in the Brazilian business sector (in very varied areas, ranging from infrastructure such as energy and cement, through the agro-food, to the new information technologies and tourism). (Silva 2003, p. 24).
If, in the beginning of the 1990s, only a few Portuguese companies had invested in Brazil, in the middle of first decade of the new century, several hundreds of those firms were well rooted in the Brazilian market, and a large number of them had in fact become Luso-Brazilian by the size of their business (ICEP 2005).
In this context, it must be emphasized the process of privatization of the Brazilian1 telecommunications industry that occurred under the government of Fernando Henrique Cardoso, with the approval in February 1995 of the Concessions Law - which aimed to establish general rules by which the government concede others the right to exploit the "production" of public
1The privatization process in Brazil can be identified through four phases: a) that occurred over
services, such as power generation and telecommunications services. The privatization of these sectors required an adequate regulatory regime, aiming at greater competition in the industry, therefore eliminating the public monopolies. This process began in the electricity sector with the sale of two power distribution companies owned by the federal government, belonging to the holding company Eletrobrás: Escelsa and Light. After that the government attempted to sell the four generators of the same Eletrobrás: Furnas, Eletrosul, Eletronorte and São Francisco Hydroelectric Company (CHESF).
In the telecommunications sector analyzed here, the process began with the sale of concessions called "Band B" mobile cellular, described in media terms as "the sale of wind," due to the fact of being auctioned an asset but not the right to compete with public companies already operating with the mobile phone. It is important to notice that in the Brazilian privatization process, the crucial moment for the purpose of this work was the sale of public assets of the telecommunications sector like TELESP Celular, which led to the entrance of the Portuguese capital at a large scale, and in particular PT's investment in the Brazilian mobile telephony sector in 1998.
p. 60), using data from IPEADATA, the growth rate of the Brazilian economy has gradually increased over the last decade from 2.5% between 1995 and 1998, to 2.1% between 1999 and 2002, 3.5% between 2003 and 2006 and 3.6% between 2007 and 2009.
We want to highlight here the effects of this steady growth of GDP over household consumption. It appears that between 1999 and 2002 household consumption grew 1.7% on average, in the following period from 2003 to 2006 its growth was 3.2%, between 2007 and 2008 the growth rate of this component of aggregate demand was 6.7%, and during the global crisis in 2009 household consumption grew 4.1% (Amitrano 2010, p. 63). Income transfer programs implemented by Lula government (2003-2010) played an important role in this process; it is the case of Bolsa-Família Program which enabled the expansion of available resources to households, particularly low-income families, which have a high propensity to consume. In the same period there were also substantial increases in the real minimum wage (Amitrano 2010).
But, what we want to point out here is that such a favorable evolution in the income of vast layers of the population helped to increase demand for consumer durables and more sophisticated services, such as those related to telecommunications like mobile phones and others.
4.1 The investments of Portugal Telecom in 1998-2009 and their phases
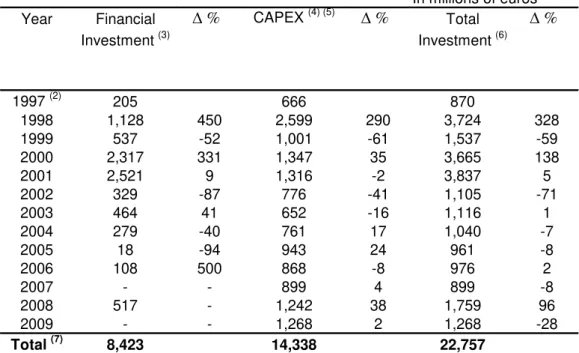
Table 1 shows the Financial Investment and the Tangible and Intangible Investments (CAPEX), components of Total Investment of PT, from 1998 to 2009. We can identify three phases: the first covers the years 1998 to 2001, and was characterized by large investments of PT in Brazil; the second, from 2002 to 2007, is marked by a slowdown of investments in Brazil, the accommodation of the CAPEX level and the increase in shareholder remuneration of PT; and the third includes the years of 2008 and 2009, although it maintains the same characteristics of the previous phase regarding investments of PT in Brazil as the returns to shareholders, it is distinguished by the increase of investment in the information society and R&D.
The first phase, beginning in 1998, evidenced the changes in the level of these investments with the inception of the internationalization process of PT in a broad scale, reflecting in particular the investments in Brazil, and lasts until 2001, when the investments related to the successive increases in the holding Group's share in Telesp Celular Participacões SA (TCP) were significant. As referred to earlier, the largest investment made by PT in Brazil occurred in 1998 when the auction for the privatization of Telebrás System took place; as a result PT secured a controlling stake in Telesp Celular SA (TC), by acquiring 51.8% of shares entitled to vote - representing 19.3% of the total capital of the holding Telesp Celular Participacões SA (TCP), which was holding 87.3% of common shares, representing 71.4% of the total capital of Telesp Celular SA, the operator of mobile phone in the state of São Paulo. This participation, which included the acquisition by 205.9 million euros in February 2001 of Global Telecom2 plus a further consolidation process of increasing the capital of Telesp Celular Participações, which can be represented by a change from 19.3% in 1998 to 65.12 %, in 2002, in the total capital of the holding TCP owned by PT.
Year Financial D % CAPEX (4) (5) D % Total D %
Investment (3) Investment (6)
1997 (2) 205 666 870
1998 1,128 450 2,599 290 3,724 328
1999 537 -52 1,001 -61 1,537 -59
2000 2,317 331 1,347 35 3,665 138
2001 2,521 9 1,316 -2 3,837 5
2002 329 -87 776 -41 1,105 -71
2003 464 41 652 -16 1,116 1
2004 279 -40 761 17 1,040 -7
2005 18 -94 943 24 961 -8
2006 108 500 868 -8 976 2
2007 - - 899 4 899 -8
2008 517 - 1,242 38 1,759 96
2009 - - 1,268 2 1,268 -28
Total (7) 8,423 14,338 22,757
Source: Consolidated Reports of Portugal Telecom, SGPS, S.A.
(1) The conversion rate used Euro/Escudo for the years 1997 and 1998 is the rate of 31/12/1998, in other words, 1 euro/200.482 escudos.
(2) Included is the year 1997 as benchmark. Values
??calculated for the year 1997. (3) Value calculated for the years 2003.
(4) Value calculated for the years 1998 and 1999.
(5) CAPEX for 2002 exclude the acquisition of the basic network made
??by PT Comunicações worth 348 million euros.
(6)
Value calculated for the years 2004, 2005, 2006 and 2008. (7) Total accumulated.
Table 1: Portugal Telecom - Investments 1998 - 2009
In millions of euros (1)
In this period, the CAPEX was very high because, in addition to the investments made in Portugal, PT made major investments in the capacity expansion of the digital network of Telesp Celular and in the expansion of the infrastructure and distribution network of Global Telecom. Hence, PT fulfilled its obligations during the process of privatization of Brazilian telecommunications, which set targets for universal service and quality of care.
The first phase ends in 2001. In 2002 there is a clear downturn in financial investment and CAPEX (Table 1). This slowdown is reflected in a decline of 71% of the total investment which is in consonance with the policy defined by PT in 2001, in order to increase the flow (EBITDA less CAPEX) and to maximize the cash flow3 to cope with new investments in Brazil, with resources
of Telesp Celular Participacões itself, through reinvestment of profits in local currency, without any need for investment coming from the home basis of PT.
The significant reduction in financial investment in Telesp Celular Participacões occurred in 2002 not only was in line with the strategy of maximizing cash flow, preparing the environment for new acquisitions without the need for new investment by controlling PT, but also, for the closing of the deal with Telefónica of Spain seeking to create VIVO through BRASILCEL, holding that joined the mobile assets of both companies in Brazil. The slowdown of investments was also in line with the objective of PT, in its Annual Report for 2002, of reinforcing the commitment to improve the return of investments in Brazil. Indeed, the new strategy of PT adopted in the second phase was explained in the message to shareholders as follows:
Our commitment to improve the return of our investments in Brazil is strengthened with the formal launching of Brasilcel, the joint venture with Telefónica for mobile telecommunications business in Brazil, 50% held by each of the groups. Brasilcel is the largest mobile operator in Latin America and has about three times the customers of the second operator in Brazil. Brasilcel is therefore extremely well positioned to increase customer loyalty and take advantage of synergies stemming from their size, thus improving their margins and cash flow. (Annual Report 2002, p. 8)
The second phase, whose beginning dates from 2002, was extended until 2007. This phase was marked by negative growth rates of the financial investment, reflecting accommodation and consolidation of acquisitions of assets held in Brazil by VIVO, and businesses in Africa, without major new investments in euros. In 2006, PT has invested 143 million euros, of which, 108 million were used in the acquisition of MTC4, operator of mobile business in Namibia. Also, between the years from 2002 to 2007, CAPEX fluctuates around relatively low levels (with the minimum of 652 million Euros in 2003 to 943 million in 2005), showing that investments in infrastructure and new network technologies were in tune with the growth and potential of the new markets, and of course, with its
position in these markets in order to cope with fierce competition coming from other telecommunications operators.
In relation to the compensation of PT’s shareholders, the progressive and sustained increase only appears as a clear objective of PT since 2002, when the financial investment reduces 87% and the CAPEX 41%. Thus, in terms of shareholder returns, PT distributed about two billion euros between the years 2003 to 2005. Only in 2005, 648 million Euros were distributed through the share buyback5 and dividends. Considering the amount proposed for 2005, the dividend paid was roughly quintupled since 2002. Despite the Portuguese adverse economic conditions after 2002, including the negative effects of the takeover bid launched by SONAECOM launched in February 2006, in a process that lasted more than a year, PT has obtained successively favorable results with financial and operating performance, which is reflected in the good remuneration paid to its shareholders. Moreover, as a result of the action of SONAECOM the process of progressive and sustained returns to the PT’s
shareholders was deepened.
Therefore, the main feature of the second phase was the reduction of PT investments associated with the progressive and sustained increase in the compensation to the PT’s shareholders, and this trend was maintained even in
the following phase. According to the message of the Chairman of the Board of Directors, PT has paid its shareholders from March 2007 to April 2009, 5.8 billion euros through dividends, purchase of own shares and the spin-off6 of PT Multimedia (Consolidated Annual Report 2009, p. 9). As can also be observed in Table 1, in 2007 and 2009, the financial investments are zero, and so total investment equals the component of the CAPEX.
In the third phase, covering the years 2008 and 2009, the tangible and intangible investments of PT seek not only to respond to the vegetative growth of the markets where PT operates, but they also mean to invest in the
5Repurchase program of own shares of Portugal Telecom.
information society and R&D, with the most significant values ever. Thus, since 2008, the CAPEX of PT beyond being responsible for its investments in the development of 3G and 3.5G networks in Portugal, by increases in the network capacity and expansion of 2G network coverage in 3G and 3.5G in Brazil, began to contribute and invest more substantially in the information society in Portugal. In 2009, 170 million euros were invested, equivalent to 2.5% of operating results in the information society in Portugal, and in R&D 233 million euros, an increase of 42% over the previous year.
In April 2008, PT, through VIVO, invested 517 million euros in the acquisition of Telemig Celular Participações; Telemig Celular was the owner of the operator of cellular mobile service in the state of Minas Gerais, with the control over more than four million customers, in the third richest state of Brazil. With the acquisition of 1.9 GHz licenses in the regions where VIVO did not operate, conducted in August 2007, VIVO secured its entry in the Northeast region and increased its coverage throughout the country. With these new investments, VIVO sought to maintain its leadership position in the Brazilian mobile market, which is also one of the strategies of the PT Group in all markets where it operates. Indeed, in 2009, VIVO led the Brazilian mobile market with a market share of 29.7%.
Also in 2008, in the domestic market, PT strengthened its leadership with the success of three major programs planned for that year: the launching of meo7, the TV of the future, the quest for leadership of the mobile broadband service and the investment in the segment of Small and Medium sized Enterprises through innovative and convergent offers. Thus, the CAPEX for 2008, amounting to 1,242 million euros was invested in both next-generation technologies, and investments associated to customers due to strong growth in the television business in Portugal.
As can also be seen in Table 1, the first phase, from 1998 to 2001, despite the fall of 1999, year of the sharp devaluation of the real (largely due to
overshooting), financial investments made in acquisitions and consolidation of mobile assets in Brazil, including the payment of the debt consequent to the auction of Telebrás privatization, along with the highest CAPEX in this period, determined the total investment to quite significant levels.
The evolution of PT Group's investments, between 1998 and 2009, are strongly influenced by investments of its holding company Telesp Celular Participacoes in 1998-2001, in so far the largest PT investments in foreign markets were held in Brazil through the acquisition of Telesp Celular. Thus, if the need for commitment to improve the return of TCP is deduced, which was carried out since 2002, we may conclude that since then the financial health of the PT was closely linked to the results of Telesp Celular Participacões and to the future of the Brazilian telecommunications market.
After 2002, considering the strong slowdown of the component in financial investment, the total investment is to be determined almost exclusively by the level of CAPEX – except in the year 2008 with the acquisition of Telemig Celular - demonstrating the maturity and the seeking for returns of the investments made earlier. So as can be noticed, the level of CAPEX only changes in 2008, raising 343 million euros in comparison to the previous year, and remains at this new level, with an increase of 2% in 2009, characterizing the third phase of investment in PT.
4.2 Operating revenues and financial results of Portugal Telecom
With the purpose of knowing whether or not the strategy of internationalization implemented by PT was the right decision, it is crucial to analyze its financial results. Bearing this objective in mind we will analyze here the main financial indicators of PT in the period under study. In Table 2, some of the main financial indicators from 1998 to 2009 are shown: the Consolidated Operating Revenues, the EBITDA8 (Operating Results + Reform benefit costs + amortization), the Operating Results and the Consolidated Net Income of PT. In all cases the annual changes have been calculated.
With regard to the Consolidated Operating Revenues are concerned, it can be observed that, despite the negative changes for 2002 and 2006, there was sustained growth during the period. If we look more closely at the data, we realize that their development reveals two phases: the first between 1998 and 2001, when revenues grew giddy, with an increase of 91.5% during this relatively short period, thus almost doubling their level, reflecting the returns of large investments; the second phase, from 2003 to 2009, after a small drop in revenues in 2002, is characterized by more modest growth rates, but steady, despite all the adverse conditions faced this time domestically in the Portuguese economy, including the uncertainties around the takeover bid of SONAECOM, between the years 2006 and 2007, which had strong impact on the consolidated results.
In the evolution of this indicator after 2001, some facts must be highlighted as the reversal of financial perspectives of the telecommunications sector after the collapse of the dotcom bubble in 2000. The performance of the Brazilian economy since 2001 must also be taken into account: a recession once again involved external issues, such as the Argentinean crisis, the events regarding the attacks of September 11 added to the energy crisis in Brazil in early 2001, and, as already referred to above, the resulting devaluation of the real, and the financial instability due to uncertainties caused by the Brazilian electoral environment in 2002 (and to a lesser extent in 2006).
In millions of euros (1) Year Consolidated D % EBITDA (3) D % Operating Consolidated D %
Operating Results Net Income
Revenues
1997 (2) 2,741 1,166 599 350
1998 2,990 9.1 1,329 14.0 704 441 26.2
1999 4,155 39.0 1,926 44.9 1,094 495 12.2
2000 5,146 23.9 1,958 1.7 937 540 9.1
2001 5,727 11.3 2,124 8.5 1,168 307 -43.1
2002 5,582 -2.5 2,230 5.0 1,267 391 27.4
2003 5,776 3.5 2,268 1.7 1,314 240 -38.6
2004 5,967 3.3 2,363 4.2 1,428 623 159.6
2005 6,385 7.0 2,496 5.6 1,375 654 5.0
2006 5,765 -9.7 2,237 -10.4 1,106 867 32.6
2007 6,148 6.6 2,357 5.4 1,234 742 -14.4
2008 6,721 9.3 2,480 5.2 1,167 576 -22.4
2009 6,785 0.9 2,502 0.9 975 684 18.7
Source: Consolidated Reports of Portugal Telecom, SGPS, S.A.
(1) The conversion rate used Euro/Escudo for the years 1997 and 1998 is the rate of 31/12/1998,
(2) Included is the year 1997 as benchmark. Values
??calculated for the year 1997.
(3) Value calculated for the year 1998.
Table 2: Portugal Telecom - Consolidated Results 1998 - 2009
in other words, 1 euro/200.482 escudos.
As shown in Table 2, we have also sustained growth in EBITDA during the period that goes from 1998 to 2009. Its annual growth was only negative in 2006 that is, among other factors already referred to, the result of the negative impact of lower tariffs for fixed-mobile interconnection in the fixed network in Portugal. Along the series, the EBITDA performance is very similar to the behavior of Consolidated Operating Revenues of PT. Despite the difficult economic context of 2009, PT’s focus on international markets meant that 51.5% of its revenues and 44% of its EBITDA were generated in this year by foreign assets.
As far as respects the Consolidated Net Income between 1998 and 2009 a series of large swings can be noted in Table 2, when it comes to the results achieved during the period under review. However, we can also detect that there are two distinct periods: the first, despite the initial growth between 1998 and 2000, as a result of Telesp Celular Participações, extends until 2003, the worst result of the series, only 240 million euros, which coincides with the consolidation of investments and the beginning of VIVO’s operations; the second, from 2004 to 2009, despite the large fluctuations is marked by a substantial increase in the level of the results achieved in comparison with the previous period.
The significant drop in net income between 2001 and 2003, according to Table 2, and the devaluation of 2002, is characteristic of a transition period with the announcement of the strategic agreement with Telefonica of Spain in view of the Brazilian mobile market in January 2001, passing through the acquisition of Tele Centro Oeste Participações SA - TCO, to the actual launching of VIVO in April 2003. Beyond an excellent range of 160% in 2004 in comparison to 2003, two years after the second period, between 2005 and 2006, a substantial growth of Net Income occurred, which led to an historic result of 867 million euros in 2006, the greatest of all time in PT. This second period ends with a slowdown in Net Income in the years of 2007 and 2008, but a recovery in 2009. This period is also characterized by huge economic difficulties in the domestic market, and seems to show the new level of returns to PT, around 700 million euros a year. In the Annual Report of PT (2009, p. 10) it was pointed out that international business represented 84% of clients, a significant part being from Brazil, with 51.5% of revenues and 43% of net income.
4.3 The part of Brazil in the revenues by business segment, geographical
area and clients
shows its breakdown by business segment, highlighting the importance for PT of the participation in VIVO, which represented 46.3% of the total Group revenues. If we look at the Consolidated Operating Revenues by Geographical Area in 2009, the same phenomenon is also quite clear, since the revenues of VIVO and DEDIC, call center service of PT in Brazil, the values arising from the business in Brazil were almost equal to the operations in Portugal, with percentages of 48% and 49% respectively, with the item Other Assets and Eliminations making not more than 3%.
Chart 1: Portugal Telecom - Structure of Consolidated Operating Revenues - 2009
Wireline 29%
Mobile Portugal TMN 22% Mobile Brasil
VIVO 46%
Other and eliminations
3%
Source: Consolidated Reports of Portugal Telecom, SGPS, S.A.
By the end of the period we have just studied, it must be once again emphasized the importance of investments in Brazil, and especially the potential of its growing consumer market, given the strong economic growth that the country has experienced in recent years, and despite the global financial and economic crisis of 2008/2009, as mentioned before. In these circumstances, Brazil had, and still has, a large potential to grow in the domain of telecommunication services, and PT had the possibility of obtaining large gains and of improving its financial situation, despite all the turbulence that accompanied this investment.
In millions Year Portugal International Brazil/VIVO Total
Market customers
of PT
1998 6.4 2.1 - 8.5
1999 7.5 3.2 - 10.7
2000 8.8 4.6 - 13.4
2001 10.2 6.3 - 16.5
2002 11.1 17.2 16.9 28.4
2003 12.4 21.1 20.7 33.5
2004 11.6 26.5 26.5 38.1
2005 12.2 34.8 29.8 47.0
2006 12.6 37.4 29.0 50.0
2007 11.1 43.9 33.5 55.0
2008 11.2 58.7 44.9 70.0
2009 11.8 60.5 51.7 72.3
Source: Consolidated Reports of Portugal Telecom, SGPS, S.A.
Table 3: Portugal Telecom - Customers (1998 - 2009)
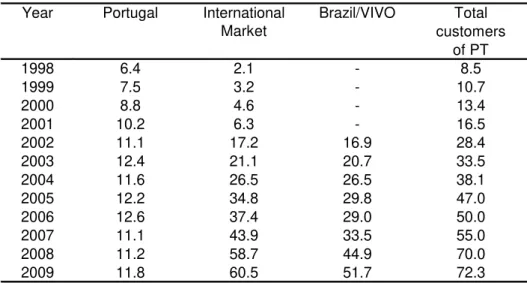
On the contrary, in the international market the number of customers impressively grows 2,781%, in the period under review, i.e., from 2.1 in 1998 to 60.5 million customers in 2009. Thus, it can be observed in Table 3, the strong annual growth of the number of customers in the international market, which at the end of 2009 represented the great majority of PT customers (83.7%). Within this total the part of Brazil with 51.7 million VIVO customers in 2009 was outstanding, representing 71.5% of the total of PT Group. So, after internationalization at large scale, begun in 1998, Brazil played a major role in the PT business from several perspectives.
5. Concluding remarks
The objective of this study is to analyze the performance of Portuguese investments in Brazil, through the experience of PT between 1998 and 2009, particularly as far as its financial results are concerned. Thus, in this conclusion, it will be first emphasized the main arguments that demonstrate the interface between the theoretical references and its implications for the internationalization process of PT. If we base our argument on Scott (1991, 1992 and 2008), in the perspective of the technical dimension, which sets standards of rationality and efficiency as paradigmatic institutional mechanisms in business decisions. Thus, any analysis of investments and financial results of PT, stressing for example the effective participation of PT Group in VIVO, intends to identify the technical dimension, which relies on the economic efficiency of the company.
tangible and intangible assets (CAPEX); and the third stage includes the years 2008 and 2009, and although it maintains the same features of the previous phase when it comes to investments of PT in Brazil and return to shareholders, it is distinguished by increased investment in the information society and R&D.
As far as Operational Revenues are concerned, it is noticed that despite the negative changes on the years 2002 and 2006, there was a sustained growth in this item during the entire period. When examining more closely this indicator, it is shown that its development was basically divided into two phases: the first, covering the years 1998 and 2001, is easily recognized by a vertiginous growth (91.5%) of the revenue, therefore almost doubling the beginning of the process, reflecting the returns of the great investment PT in 1998; the second phase, from 2003 to 2009, after a small drop in revenues in 2002, is characterized by modest growth rates, albeit steady, despite all the adverse situation faced by the Portuguese economy during this period, including the uncertainties around the “hostile” takeover bid of SONAECOM, in the years 2006-2007.
The international branch of PT had a significant weight on the results of the PT Group, and its importance is confirmed by the evolution of the share of international business in total revenues of the Group. Considering that in 2000 the share of international revenues was 16%, and this contribution was 51.5% in 2009, where participation of Brazil is around 48%, i.e., the large majority of international revenues. The size and weight of international business in the PT Group are also significant regarding the total number of customers. PT reached in 2009, 72.3 million customers in the Portuguese, Brazilian, African and Asian markets, with the number of customers in the international market reaching 83.7% of the total of PT, and the 51.7 million VIVO customers in Brazil represented 71.8% of that total.
regard to the permanence of PT in Brazil. All these and other disturbing factors were associated with frequent changes of administration and governments in Portugal, with a typical shareholder remuneration policy of private enterprise in the distribution of shares, but with a very delicate position of the Portuguese government through the 500 shares Class A, the so-called "Golden Shares", and finally the sale of VIVO to Telefónica in 2010 and the entry into a strategic partnership with Oi in 2011. Despite this extremely complex institutional framework and vicissitudes, the PT has achieved good financial results in the entire period, especially based on the contribution of Brazil, when in late 1990s, before its internationalization process at a large scale, the contribution from abroad to the company's results was quite negligible.
References
AMITRANO, Cláudio (2010). O Regime de Crescimento Econômico Brasileiro: uma apreciação sobre o período 1995-2009. In: Brasil em desenvolvimento 2010: estado, planejamento e políticas públicas. IPEA, Brasília. Accessible
in: http://www.ipea.gov.br. Access in 02/05/2011.
CHARLTON, Andrew, Hans CRISTIANSE, and Charles OMAN (2003). Incentives-based Competition for Foreign Direct Investment: the case of Brazil. OECD Working Papers on International Investment, OECD, Paris. Doi: 10.1787/631632456403. Accessible in: http://www.oecd.org. Access in 06/10/2005.
ICEP (2005). Os Investimentos Portugueses no Brasil, ICEP- Delegação de São Paulo, São Paulo.
JÚLIO, Paulo and Ricardo Pinheiro ALVES (2011). The Internationalization of the Portuguese Economy, Working Paper, BMEP nº 8, GEE/GPEARI, Lisbon.
MATEUS, Abel (2006). A Economia Portuguesa, 3rd edition (revised and augmented), Ed. Verbo, Lisboa.
MOTTA, Paulo Roberto (2001). Gestão Contemporânea: a ciência e a arte de
ser dirigente. 12th edition. Rio de Janeiro: Record.
PENROSE, Edith (1959, 2006). A Teoria do Crescimento da Firma. Portuguese version. Ed. Unicamp, São Paulo, Campinas.
PORTUGAL TELECOM (1997 a 2009). Relatório e Contas Consolidadas.
Accessible in: http://www.portugaltelecom.pt. Access from 17/07/2007 to 20/06/2010.
SCOTT, W. R. (1991). Unpacking institutional arguments. In: POWELL, W. W e DIMAGGIO, P. (Eds.). The New Institutionalism in Organizational Analysis. Chicago: Chicago University Press.
SCOTT, W. R. (1992). The organization of environments: network, cultural and historical elements. In: MEYER, J. W. e SCOTT, W. R. Organizational environments: ritual and rationality. London: Sage Publications.
SCOTT, W. R. (2008). Institutions and organizations: ideas and interests. United States: Sage Publications, 280 p.
SILVA, Joaquim Ramos. (2002). Portugal/Brasil: uma década de expansão das relações económicas, 1992-2002. Lisboa: Terramar.
SILVA, Joaquim Ramos (2003). “Significado e Perspectivas do Reencontro
Económico entre Brasil e Portugal”. BAHIA ANÁLISE E DADOS, Salvador,
v. 13, nº 1, pp. 23-29.
SILVA, Joaquim Ramos (2005). “A internacionalização das empresas portuguesas: a experiência brasileira”, RAE – Revista de Administração de Empresas, Volume 45, Special Edition Minas Gerais, pp. 102-115.
SILVA, Joaquim Ramos (2008). Internationalization Strategies in Iberoamerica: the case of Portuguese trade. Economic Commission for Latin America and the Caribbean (ECLAC) – Project Documents collection, United Nations Publications, Santiago de Chile.
TEIXEIRA, Maria Eunice R. M. (2011). A Estratégia de Internacionalização da Portugal Telecom em Perspectiva Comparada. Master Dissertation, ISEG, Lisbon.
TORAL, Pablo (2006). Latin America’s Quest for Globalization. The Role of