This is an open-access article
SPATIAL DISTRIBUTION, EVOLUTION AND STRUCTURE OF MAIZE AND SOYBEAN PRODUCTION SYSTEMS IN STATE OF PARANÁ
Abstract – The Brazilian state of Paraná is one of the leading producers of maize.
However, expansion of soybean cropping has caused a drop in maize production and could have impacted production systems. The aim of the study was to verify the evolution and identify the structure, spatial dynamics and transformation of maize and soybean production systems in the state of Paraná. Municipal Agricultural Production data from the Brazilian Institute of Geography and Statistics (IBGE) provided the basis for this study. The Location Quotient was analyzed to identify microregions specialized in the production of soybean and first and second crops of maize. Principal components and groups were analyzed in order to characterize the structure and dynamics of maize and soybean production systems in specialized microregions. The results show how maize and soybean production systems have been transformed; soybean is now cropped in areas previously occupied by first crop maize, and the area occupied by second crop maize has increased. This has led to the predominant use of the crop rotation system with first crop soybean followed by second crop maize.
Keywords: Agricultural commodities, regional analysis, Zea mays, Glycine max.
DISTRIBUIÇÃO ESPACIAL, EVOLUÇÃO E ESTRUTURA DE SISTEMAS DE PRODUÇÃO DE MILHO E SOJA NO PARANÁ
Resumo - O milho é um dos principais produtos da agricultura paranaense.
Entretanto, sua retração devido à expansão da cultura da soja, pode ter modificado os sistemas de produção. Nesse contexto, o objetivo deste estudo foi verificar a evolução e identificar a estrutura, dinâmica espacial e as transformações dos sistemas de produção de milho de primeira e segunda safra e da soja, no Estado do Paraná. Para tanto, foram utilizados dados da Produção Agrícola Municipal, do Instituto Brasileiro de Geografia e Estatística. Foi realizada a análise de Quociente Locacional, para identificar as microrregiões especializadas na produção de milho de primeira e de segunda safra e da soja. Foram realizadas análises de componentes principais e de agrupamentos, para caracterizar a estrutura e dinâmica dos sistemas de produção de milho e soja nas microrregiões especializadas. A partir dos resultados verifica-se a transformação nos sistemas de produção de milho e soja, sendo que a cultura da soja passou a ocupar áreas antes utilizadas para a produção do milho de primeira safra, e houve aumento na área de milho de segunda safra. Com isso, passa a predominar no Paraná o sistema de sucessão das culturas de soja na primeira safra e do milho de segunda safra.
Palavras-chave: Commodities agrícolas, análise regional, Zea mays, Glycine max.
ISSN 1980 - 6477
Journal homepage: www.abms.org.br/site/paginas
Bruno Volsi(1), Gustavo Henrique Leite de Castro(1), Gustavo Vaz da Costa(1), Matheus Felipe de Padua Severino(1) and Tiago Santos Telles(3)( )
(1)Universidade Estadual de Londrina E-mail: [email protected], [email protected], [email protected] (2)Universidade de São Paulo E-mail: [email protected] (3)Instituto Agronômico do Paraná E-mail: [email protected]
How to cite
VOLSI, B.; CASTRO, G. H. L.; COSTA, G. V.; SEVERINO, M. F. P.; TELLES, T. S. Spatial distribution, evolution and structure of maize and soybean production systems in state of Paraná.
Revista Brasileira de Milho e Sorgo, v. 19, e1122,
2020.
Brazilian Journal of Maize and Sorghum
Food supply and food security pose major challenges for the 21st century, and Brazil plays a
crucial role, with its capacity to expand agricultural production (Freitas & Mendonça, 2016). A key factor of this expansion is the intensification of areas cropped with soybean, especially since areas previously occupied by other crops, including first crop maize, have been turned over to soybean (Melo et al., 2012), evidence of competition for land (Caldarelli & Bacchi, 2012). However, regions with the highest concentration of soybean also have the highest concentration of maize (Dias et al., 2016).
The state of Paraná is a major grain producer. In 2016, according to Municipal Agricultural Production (MAP) data published by the Brazilian Institute of Geography and Statistics (IBGE), around 13.8 million metric tons of maize were produced in an area of 2,566,054 ha, and some 17 million metric tons of soybean in an area of 5,421,348 ha. Maize cropping has been consolidated in Paraná over the last 15 years, with significant growth in cropping area, production and productivity over the two growing seasons: first crop (first growing season) and second crop (second growing season). In 2016, according to MAP data, first crop maize accounted for 24.4% of Paraná’s total maize production, whereas second crop maize accounted for 75.6%. Maize produced in Paraná has added value to various agricultural and livestock production chains, such as poultry, pork and dairy, which, according to Martin et al. (2011), consume large quantities of maize.
Second crop maize is grown by dry farming
after the first crop and allows optimization of farm labor and machinery, reducing the impact of seasonality on production, supply and prices (Tsunechiro et al., 2006). Since the climatic conditions in second growing season are less favorable, this cropping system has lower production potential than the first growing season. Another factor that has contributed to the growth of the maize cropping is the adoption of the no-till system, where the crop is planted directly into the soybean cover, cutting the time between harvesting the first crop and sowing the second crop (Bicudo et al., 2009; Albrecht et al., 2009). With regard to soybean, according to MAP data, state of Paraná was responsible for 17.68% of total Brazilian production in 2016. This result was obtained due to the dynamics of the soybean production chain, consisting of various stages: grain (agricultural production), brans and vegetable oils and oils related to input supply for upstream links (Caldarelli et al., 2009).
Maize production seems to be directly linked to soybean production. In Paraná, the expansion of soybean cropping raises a number of questions concerning maize production, such as: What changes have been brought about by the spatial interdependency between the maize and soybean crops? How much has first cropr maize lost in terms of area? By how much has the second crop maize area increased? Has production increased or decreased? These questions provide a basis for examining a possible spatial interdependency between maize and soybean production.
of the maize and soybean production chains, characterizing spatial distribution and mapping these activities provide fundamental data for developing public initiatives regarding the storage, transportation and trading of harvests and derivatives. Such information could further elucidate the spatiotemporal phenomena involved in the development of these agricultural activities in Paraná, since spatial changes in production will depend on the provision of adequate infrastructure, a market for the produce, credit programs and technical support (research and extension).
Therefore, the aim of this study was to verify the evolution and identify the structure, spatial dynamics and transformations of maize and soybean production systems in the state of Paraná.
Material and Methods
The study was based on MAP data published by the IBGE, and data on the National Family Agriculture Consolidation Program (PRONAF), National Medium-Sized Rural Producer Support Program (PRONAMP) and rural credit not linked to a specific program (CSV) published by the Brazilian Central Bank (BCB), relating to the period from 1997 to 2016 for soybean and from 2007 to 2016 for maize1.
The analysis covered 39 microregions in the state of Paraná, delimited by the IBGE: Apucarana,
Assaí, Astorga, Campo Mourão, Capanema, Cascavel, Cerro Azul, Cianorte, Cornélio Procópio, Curitiba, Faxinal, Floraí, Ibaiti, Foz do Iguaçu, Francisco Beltrão, Goioerê, Guarapuava, Ivaiporã, Irati, Jacarezinho, Jaguariaíva, Lapa, Londrina, Maringá, Palmas, Paranaguá, Paranavaí, Pitanga, Pato Branco, Ponta Grossa, Porecatu, Prudentópolis, Rio Negro, São Mateus do Sul, Telêmaco Borba, Toledo, União da Vitória, Umuarama and Wenceslau Braz.
First, harvested area variation trends were calculated, together with the quantity produced and productivity per crop, based on the annual average rate of compound variation. This estimate was based on the antilogarithm of the angular coefficient of the log-linear equation, using the ordinary least square (OLS) method that correlates estimated harvested area, quantity produced and productivity for the year of observation, according to Equation 1 (Greene, 2008). This rate of variation was expressed as a percentage, since the harvested area and the quantity produced verified the acceptability of the assumptions measured by the Student’s t-test, at a significance of 5%.
i = 1, 2,..., n (1) Where: α is the intercept; β the angular coefficient of a straight line; X the explanatory variable for the year corresponding to the ith observation; Y
1The data series for analyzing the maize crop were defined as a function of the period during which production was split between the first and second crops, and during the years compatible with soybean cropping periods. Thus, for soybean there were four periods (1997 to 2001, 2002 to 2006, 2007 to 2011 and 2012 to 2016), and for maize two periods (2007 to 2011 and 2012 to 2016).
the dependent variable relating to the harvested area, quantity produced and productivity in the ith
year; µ random error; and i the number of years. Next the location quotient (LQ) was calculated. It indicates the region’s specialization in maize and soybean cropping. Based on the basic aggregate, LQ is used to measure and compare regional specialization for a given activity. This parameter was applied to estimate the specialization in first and second crop maize, and soybean for the microregions of Paraná, based on Gross Production Value (GPV) averages for the period. In accordance with Equation 2 (Isserman, 1977), LQ was obtained based on the proportion between the GPV for each crop and the agricultural activity GPV, which includes permanent and temporary farming.
(2) Where is the GPV for agricultural activity
in region ; is the total GPV of all
agricultural activities in region is the GPV of agricultural activity in all regions; and
is the total GPV of all activities in all regions. In other words, the numerator corresponds to the way in which production for an agricultural activity is split in the microregion and the total agricultural activity in the same microregion. Similarly, the denominator corresponds to the split in production for a given agricultural activity
in Paraná and the total agricultural production in Paraná. If the result obtained is greater than 1, the activity is a specialization of the microregion. Thus, non-specialized microregions have an LQ < 1, and specialized regions an LQ ≥ 1. Note that, for data availability reasons, the LQs for first and second crop maize were based on data from 2007 to 2016.
Once the microregions specialized in growing first and second crop maize and soybean had been defined, principal component analysis (PCA) analysis was run. Based on this analysis, a linear combination was sought among the observed variables in order to maximize the total variance explained. Variables with high correlation are combined to obtain a factor or component that explains the highest level of variance in the sample. The second component exhibits the second highest magnitude of variance and is not correlated with the first, and so on (Fávero & Belfiore, 2015). The components were defined based on the Kaiser criterion, selecting components with eigenvalue ≥ 1 (Kaiser, 1960).
PCA was performed based on the following variables: LQ, credit earmarked for agricultural activity (PRONAF, PRONAMP and CSV), and number of cooperatives. Based on the results of PCA, cluster analysis was performed taking into account specialized microregions and using the Ward method (hierarchical clustering). This is an interdependent statistical technique allowing variables to be marshaled into homogeneous groups, according to a similarity or distance
measurement (Fávero & Belfiore, 2015).
Monetary restatement was based on the extended national consumer price index (IPCA) for December 2017. SPSS software was used to process the data and ArcGIS 10.2 to produce maps.
Results and Discussion
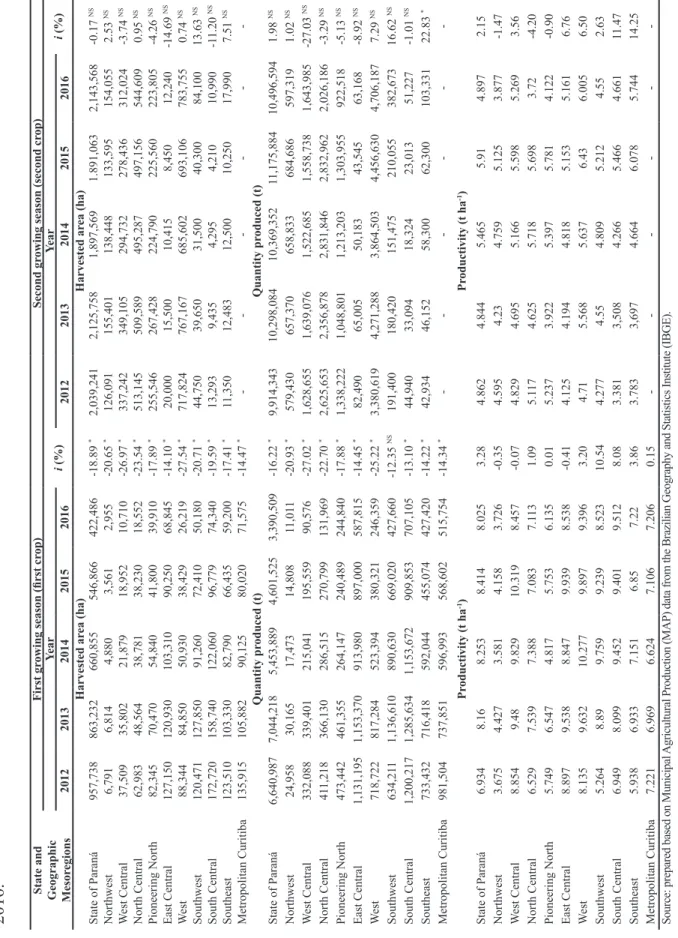
Table 1 gives the results relating to changes in harvested area, quantity produced and productivity of first and second crop maize in the mesoregions of Paraná in the period from 2012 to 2016. The results show that, during this period, there was a drop of 55.8% in the first crop maize harvested area, an annual rate of 18.9%. All mesoregions in Paraná suffered a drop in cropping area. The West (27.54% per annum) and West Central (26.97% p.a.) mesoregions suffered the highest drops. In the South-Central region, which had the largest area cropped with first crop maize in Paraná (18% of total area), the drop was 19.6% p.a. Since maize competes with soybean in first growing season, the annual variation in area occupied by each crop is partly due to the substitution of one by the other, according to Bicudo et al. (2009), mainly because of the higher profitability of soybean.
Regarding the quantity of first crop maize produced in Paraná, it is evident that between 2012 and 2016, there was a 49% total drop at an annual rate of 16.2%. All mesoregions suffered a drop in the quantity of first crop maize produced. The West Central mesoregion showed the highest drop (27% p.a.). The South-Central mesoregion was the highest producer of first crop maize in Paraná,
contributing 19% of the total, with high returns related, among other things, to edaphoclimatic conditions and soil management. According to Fontoura & Bayer (2009), a high level of soil and water conservation agriculture practices have been adopted in this mesoregion, helping to manage these natural resources.
In terms of first crop maize productivity, the Northwest mesoregion had the worst indices, well below the average for Paraná. However, the West Central, East Central, West and South-Central mesoregions showed the best productivity indices, with an average higher than the average for state of Paraná. Productivity gains reflected the efficiency and intensification of productivity, i.e. higher yield per unit area.
Between 2012 and 2016, there was a 5% increase in the first crop maize harvested area in Paraná. In this period, the Southwest and Southeast mesoregions showed higher growth, at 87.9% and 58.5% respectively. However, the West and North Central mesoregions made the highest contributions in terms of harvested area, at around 37% and 25% respectively. This increase is related to the pursuit by rural producers of alternatives to obtain higher economic profitability, one of the options being to crop maize after harvesting soybean, i.e. adopting a soybean-maize as crop rotation system (Bicudo et al., 2009; Albrecht et al., 2009).
Table 1.
Changes in productivity
, harvested area and quantity produced for maize in Paraná mesoregions between 2012 and
2016. State and Geographic Mesor
egions
First gr
owing season (first cr
op)
Second gr
owing season (second cr
op) Year i (%) Year i (%) 2012 2013 2014 2015 2016 2012 2013 2014 2015 2016 Harvested ar ea (ha) Harvested ar ea (ha) State of Paraná 957,738 863,232 660,855 546,866 422,486 -18.89 * 2,039,241 2,125,758 1,897,569 1.891,063 2,143,568 -0.17 NS Northwest 6,791 6,814 4,880 3,561 2,955 -20.65 * 126,091 155,401 138,448 133,595 154,055 2.53 NS W est Central 37,509 35,802 21,879 18,952 10,710 -26.97 * 337,242 349,105 294,732 278,436 312,024 -3.74 NS North Central 62,983 48,564 38,781 38,230 18,552 -23.54 * 513,145 509,589 495,287 497,156 544,609 0.95 NS Pioneering North 82,345 70,470 54,840 41,800 39,910 -17.89 * 255,546 267,428 224,790 225,560 223,805 -4.26 NS East Central 127,150 120,930 103,310 90,250 68,845 -14.10 * 20,000 15,500 10,415 8,450 12,240 -14.69 NS W est 88,344 84,850 50,930 38,429 26,219 -27.54 * 717,824 767,167 685,602 693,106 783,755 0.74 NS Southwest 120,471 127,850 91,260 72,410 50,180 -20.71 * 44,750 39,650 31,500 40,300 84,100 13.63 NS South Central 172,720 158,740 122,060 96,779 74,340 -19.59 * 13,293 9,435 4,295 4,210 10,990 -1 1.20 NS Southeast 123,510 103,330 82,790 66,435 59,200 -17.41 * 11,350 12,483 12,500 10,250 17,990 7.51 NS Metropolitan Curitiba 135,915 105,882 90,125 80,020 71,575 -14.47 * -Quantity pr oduced (t) Quantity pr oduced (t) State of Paraná 6,640,987 7,044,218 5,453,889 4,601,525 3,390,509 -16.22 * 9,914,343 10,298,084 10,369,352 11,175,884 10,496,594 1.98 NS Northwest 24,958 30,165 17,473 14,808 11,01 1 -20.93 * 579,430 657,370 658,833 684,686 597,319 1.02 NS W est Central 332,088 339,401 215,041 195,559 90,576 -27.02 * 1,628,655 1,639,076 1,522,685 1,558,738 1,643,985 -27.03 NS North Central 41 1,218 366,130 286,515 270,799 131,969 -22.70 * 2,625,653 2,356,878 2,831,846 2,832,962 2,026,186 -3.29 NS Pioneering North 473,442 461,355 264,147 240,489 244,840 -17.88 * 1,338,222 1,048,801 1,213,203 1,303,955 922,518 -5.13 NS East Central 1,131,195 1,153,370 913,980 897,000 587,815 -14.45 * 82,490 65,005 50,183 43,545 63,168 -8.92 NS W est 718,722 817,284 523,394 380,321 246,359 -25.22 * 3,380,619 4,271,288 3,864,503 4,456,630 4,706,187 7.29 NS Southwest 634,21 1 1,136,610 890,630 669,020 427,660 -12.35 NS 191,400 180,420 151,475 210,055 382,673 16.62 NS South Central 1,200,217 1,285,634 1,153,672 909,853 707,105 -13.10 * 44,940 33,094 18,324 23,013 51,227 -1.01 NS Southeast 733,432 716,418 592,044 455,074 427,420 -14.22 * 42,934 46,152 58,300 62,300 103,331 22.83 * Metropolitan Curitiba 981,504 737,851 596,993 568,602 515,754 -14.34 * -Pr oductivity (t ha -1) Pr oductivity (t ha -1) State of Paraná 6.934 8.16 8.253 8.414 8.025 3.28 4.862 4.844 5.465 5.91 4.897 2.15 Northwest 3.675 4.427 3.581 4.158 3.726 -0.35 4.595 4.23 4.759 5.125 3.877 -1.47 W est Central 8.854 9.48 9.829 10.319 8.457 -0.07 4.829 4.695 5.166 5.598 5.269 3.56 North Central 6.529 7.539 7.388 7.083 7.1 13 1.09 5.1 17 4.625 5.718 5.698 3.72 -4.20 Pioneering North 5.749 6.547 4.817 5.753 6.135 0.01 5.237 3.922 5.397 5.781 4.122 -0.90 East Central 8.897 9.538 8.847 9.939 8.538 -0.41 4.125 4.194 4.818 5.153 5.161 6.76 W est 8.135 9.632 10.277 9.897 9.396 3.20 4.71 5.568 5.637 6.43 6.005 6.50 Southwest 5.264 8.89 9.759 9.239 8.523 10.54 4.277 4.55 4.809 5.212 4.55 2.63 South Central 6.949 8.099 9.452 9.401 9.512 8.08 3.381 3,508 4.266 5.466 4.661 11.47 Southeast 5.938 6.933 7.151 6.85 7.22 3.86 3.783 3,697 4.664 6.078 5.744 14.25 Metropolitan Curitiba 7.221 6.969 6.624 7.106 7.206 0.15
-Source: prepared based on Municipal
Agricultural Production (MAP) data from the Brazilian Geography and Statistics Institute (IBGE).
Notes:
i: annual growth rate. *: 5% significance. NS: not significant
Between 2012 and 2016, there was growth of 5.9% in second crop of maize yield in Paraná. The West mesoregion was the main producer, accounting for over 40% of total yield in Paraná. Note that the maize produced in the West region is used mainly in poultry and pig breeding, to satisfy demand from the region’s agroindustrial facilities (Martin et al., 2011). Maize production for animal feed has added value to the produce of this region. Furthermore, over this period there was an increase in average second crop of maize productivity in Paraná. This was due, in part, to research on improving and developing seeds, achieved by using higher performance hybrids and better land management, and making changes in seed spacing and sowing density (Von Pinho et al., 2009; Mendes et al., 2013). These gains are important and have made a positive contribution
to food security.
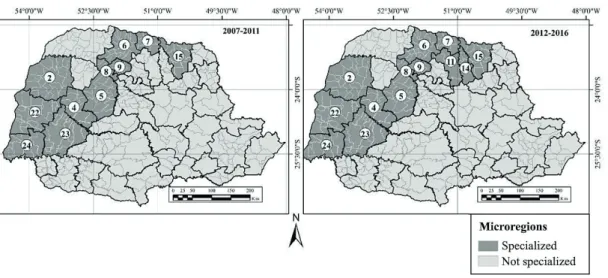
Between 2007 and 2011, 20 microregions specialized in the production of first crop maize were identified, mainly in the South and Southeast of the State of Paraná. In contrast, from 2012 to 2016, this number fell to 18, since the microregions of Cascavel and São Mateus do Sul had ceased to specialize in first crop maize (Figure 1).
First crop maize is cropped throughout Paraná in different soil types and under differing climatic conditions (Gonçalves et al., 2002). However, during both the 2007-2011 period and the 2012-2016 period, specialized regions were concentrated mainly in the East Central and South Central microregions, and in Metropolitan Curitiba, the Southeast and Southwest.
Figure 2 shows the Paraná microregions specialized in second crop of maize from 2007 to
Figure 1. Microregions in the State of Paraná specialized in the production of first crop maize.
Notes: 17: Ibaiti. 18: Wenceslau Braz. 19: Telêmaco Borba. 20: Jaguariaíva. 21: Ponta Grossa. 23: Cascavel. 25: Capanema. 26: Francisco Beltrão. 27: Pato Branco. 28: Pitanga. 29: Guarapuava. 30: Palmas. 31: Prudentópolis. 32: Irati. 33: União da Vitória. 34: São Mateus do Sul. 35: Cerro Azul. 36: Lapa. 37: Curitiba. 39: Rio Negro.
2011 and 2012 to 2016. During the first period, 11 specialized microregions were identified, concentrated in the North, West and Northwest of Paraná. During the second period (2012-2016), the number of specialized microregions increased to 13, since Londrina and Assaí had switched to specialization in second crop of maize.
Microregions specialized in second crop maize are concentrated in the North and West of Paraná. These two regions have similar edaphoclimatic characteristics, with conditions propitious for second crop maize (Shioga & Gerage, 2010). Between 2007 and 2011, the Floraí microregion had the highest LQ, and between 2012 and 2016 Toledo had the highest LQ. Growth in the production of second crop maize in the West of Paraná was due, in part, to the poultry and pork production chains, since maize
Figure 2. Microregions in the State of Paraná specialized in the production of second crop of maize.
Notes: 2: Umuarama. 4: Goioerê. 5: Campo Mourão. 6: Astorga. 7: Porecatu. 8: Floraí. 9: Maringá. 11: Londrina. 14: Assaí. 15: Cornélio Procópio. 22: Toledo. 23: Cascavel. 24: Foz do Iguaçu.
is an essential input for animal feed (Alves et al., 2009). Note that the South and Southeast regions are subject to lower temperatures, limiting the commercial cropping of winter second crop maize (Ximenes et al., 2004).
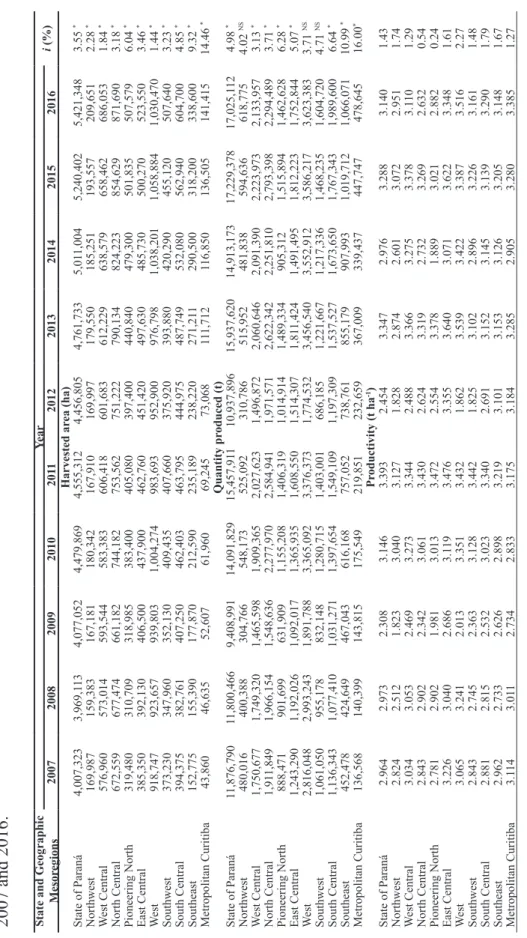
Table 2 summarizes the changes in harvested area, quantity produced and productivity for the soybean crop in Paraná mesoregions between 2007 and 2016. The harvested area for soybean in the State of Paraná increased by around 35.28%, with annual growth of 3.55%. These numbers show how first crop maize cropping areas were turned over to soybean, a dynamic that intensified after 2000, in part due to the improved economic results obtained with soybean, mainly attributable to a rise in international prices (Melo et al., 2012; Castro et al., 2017).
Table 2.
Changes in productivity
, harvested area and quantity produced for soybean in the mesoregions of Paraná between
2007 and 2016. State and Geographic
Mesor egions Year i (%) 2007 2008 2009 2010 201 1 2012 2013 2014 2015 2016 Harvested ar ea (ha) State of Paraná 4,007,323 3,969,1 13 4,077,052 4,479,869 4,555,312 4,456,805 4,761,733 5,01 1,004 5,240,402 5,421,348 3.55 * Northwest 169,987 159,383 167,181 180,342 167,910 169,997 179,550 185,251 193,557 209,651 2.28 * W est Central 576,960 573,014 593,544 583,383 606,418 601,683 612,229 638,579 658,462 686,053 1.84 * North Central 672,559 677,474 661,182 744,182 753,562 751,222 790,134 824,223 854,629 871,690 3.18 * Pioneering North 319,480 310,709 318,985 383,400 405,080 397,400 440,840 479,300 501,835 507,579 6.04 * East Central 385,350 392,130 406,500 437,900 462,760 451,420 497,630 485,730 500,270 523,550 3.46 * W est 918,747 923,657 939,803 1,004,274 983,693 952,900 976,798 1,038,201 1,058,884 1,030,470 1.44 * Southwest 373,230 347,960 352,130 409,435 407,660 375,920 393,880 420,290 455,120 507,640 3.23 * South Central 394,375 382,761 407,250 462,403 463,795 444,975 487,749 532,080 562,940 604,700 4.85 * Southeast 152,775 155,390 177,870 212,590 235,189 238,220 271,21 1 290,500 318,200 338,600 9.32 * Metropolitan Curitiba 43,860 46,635 52,607 61,960 69,245 73,068 11 1,712 116,850 136,505 141,415 14.46 * Quantity pr oduced (t) State of Paraná 11,876,790 11,800,466 9,408,991 14,091,829 15,457,91 1 10,937,896 15,937,620 14,913,173 17,229,378 17,025,1 12 4.98 * Northwest 480,016 400,388 304,766 548,173 525,092 310,786 515,952 481,838 594,636 618,775 4.02 NS W est Central 1,750,677 1,749,320 1,465,598 1,909,365 2,027,623 1,496,872 2,060,646 2,091,390 2,223,973 2,133,957 3.13 * North Central 1,91 1,849 1,966,154 1,548,636 2,277,970 2,584,941 1,971,571 2,622,342 2,251,810 2,793,398 2,294,489 3.71 * Pioneering North 888,471 901,699 631,909 1,155,208 1,406,319 1,014,914 1,489,334 905,312 1,515,894 1,462,628 6.28 * East Central 1,243,290 1,192,026 1,092,017 1,365,935 1,608,550 1,514,307 1,81 1,424 1,491,495 1,812,223 1,752,844 5.07 * W est 2,816,048 2,993,243 1,891,788 3,365,092 3,376,373 1,774,532 3,456,540 3,552,912 3,586,217 3,623,383 3.71 NS Southwest 1,061,050 955,178 832,148 1,280,715 1,403,001 686,185 1,221,667 1,217,336 1,468,235 1,604,720 4.71 NS South Central 1,136,343 1,077,410 1,031,271 1,397,654 1,549,109 1,197,309 1,537,527 1,673,650 1,767,343 1,989,600 6.64 * Southeast 452,478 424,649 467,043 616,168 757,052 738,761 855,179 907,993 1,019,712 1,066,071 10.99 * Metropolitan Curitiba 136,568 140,399 143,815 175,549 219,851 232,659 367,009 339,437 447,747 478,645 16.00 * Pr oductivity (t ha -1) State of Paraná 2.964 2.973 2.308 3.146 3.393 2.454 3.347 2.976 3.288 3.140 1.43 Northwest 2.824 2.512 1.823 3.040 3.127 1.828 2.874 2.601 3.072 2.951 1.74 W est Central 3.034 3.053 2.469 3.273 3.344 2.488 3.366 3.275 3.378 3.1 10 1.29 North Central 2.843 2.902 2.342 3.061 3.430 2.624 3.319 2.732 3.269 2.632 0.54 Pioneering North 2.781 2.902 1.981 3.013 3.472 2.554 3.378 1.889 3.021 2.882 0.24 East Central 3.226 3.040 2.686 3.1 19 3.476 3.355 3.640 3.071 3.622 3.348 1.61 W est 3.065 3.241 2.013 3.351 3.432 1.862 3.539 3.422 3.387 3.516 2.27 Southwest 2.843 2.745 2.363 3.128 3.442 1.825 3.102 2.896 3.226 3.161 1.48 South Central 2.881 2.815 2.532 3.023 3.340 2.691 3.152 3.145 3.139 3.290 1.79 Southeast 2.962 2.733 2.626 2.898 3.219 3.101 3.153 3.126 3.205 3.148 1.67 Metropolitan Curitiba 3.1 14 3.01 1 2.734 2.833 3.175 3.184 3.285 2.905 3.280 3.385 1.27
Source: prepared by the authors based on Municipal
Agricultural Production (MAP) data from the Brazilian Geography and Statistics Institute (IBGE).
Notes:
The State of Paraná is one of the largest producers and exporters of soybean in Brazil, and has ample installed infrastructure to cope with logistics, storage and processing of soybean (Caldarelli et al., 2009). Between 1997 and 2016, production of soybean in Paraná rose by 43.34%, with annual average growth of 4.98%. In 2016, the West mesoregion produced the most soybean, accounting for around 21% of Paraná’s total soybean production. This increase in production is related to growth in global demand for soybean, exportation and a rise in the price of soybean and derivatives, increasing returns for producers and thus driving expanded production (Espíndola & Cunha, 2015). According to Carmello (2018), gains in soybean productivity in Paraná can be explained, in part, by the research on genetic improvement, management, irrigation and climatic zoning, conducted by institutions such as the Brazilian Agriculture and Livestock Research Corporation (EMBRAPA) and the Paraná Agronomic Institute (IAPAR).
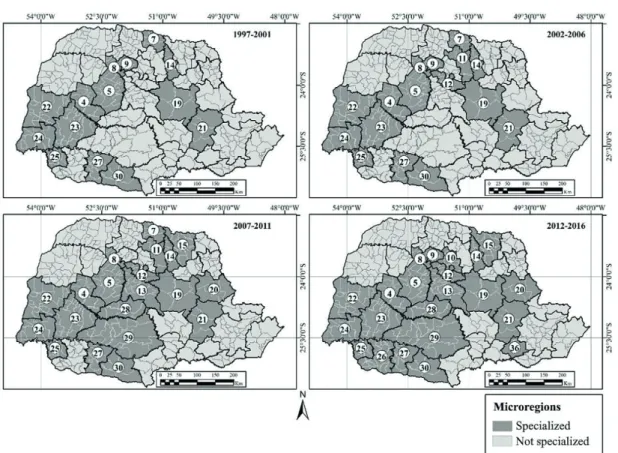
Figure 3 shows that, between 1997-2001 and 2012-2006, the number of microregions specialized in soybean in Paraná rose by 57%. In the 1997-2001 period, 14 microregions specialized in soybean were identified; in the 2000-2006 period, 16 microregions; in the 2007-2011 period, 20 microregions; and in the 2012-2016 period, 22 microregions.
Soybean expansion occurred in the microregions of Apucarana, Cornélio Procópio, Faxinal, Lapa, Francisco Beltrão, Guarapuava, Ivaiporã and Pitanga. The displacement observed
over the years is the result turning over first crop maize growing areas to soybean. As already mentioned, this dynamic is related to the improved economic results obtained from producing soybean (Melo et al.; 2012). Other factors driving soybean expansion include the insertion of new technologies into agriculture, massive investment through agricultural financing (Carmello, 2018), and incentives for agricultural and livestock cooperatives that buy soybean for processing into other products or for sale to trading companies, manufacturers or international buyers. Furthermore, the fact that soybean is easy to trade explains why farmers produce this commodity, and the expansion of cropping areas.
Principal component analysis (PCA) was applied to identify three main components that together accounted for 84% of the variability in the data (Table 3). Component 1 explained 38% of the variability and correlated positively with data on LQ (soybean), cooperatives, CSV (maize), PRONAMP (soybean) and CSV (soybean), for productive microregions specialized in soybean, located near to agricultural cooperatives and linked to rural credit facilities earmarked for medium-sized and large farming businesses. Component 2 explained 26% of the variability and correlated positively with data on PRONAF (maize), PRONAMP (maize) and PRONAF (soybean), for microregions that, in relative terms, are correlated with family farming, mainly in terms of credit facilities earmarked for small scale farmers. Component 3 explained 20% of the variability and correlated negatively with
data on the first crop of maize LQ and positively with the second crop of maize LQ in highly productive microregions specialized in second crop of maize.
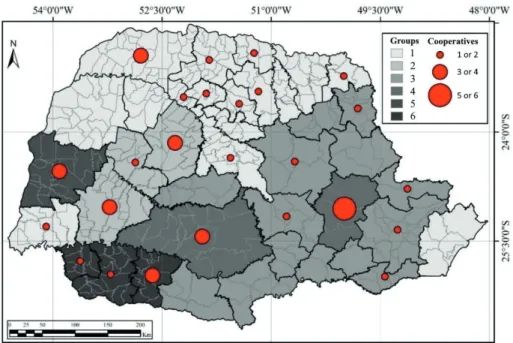
Based on the degree of similarity, six groups were identified, formed as a function of (a) specialization in first crop of maize, second crop of maize or soybean; (b) the number of cooperatives set up in the microregions; and (c) the amount and type (PRONAF, PRONAMP and CSV) of rural credit received by producers. Group 1 consisted of 16 microregions; Group 2, 3
Figure 3 - Microregions in the State of Paraná specialized in soybean production.
Notes: 4: Goioerê. 5: Campo Mourão. 7: Porecatu. 8: Floraí. 9: Maringá. 10: Apucarana. 11: Londrina. 12: Faxinal. 13: Ivaiporã, 14: Assaí. 15: Cornélio Procópio. 19: Telêmaco Borba. 20: Jaguariaíva. 21: Ponta Grossa. 22: Toledo. 23: Cascavel. 24: Foz do Iguaçu. 25: Capanema. 26: Francisco Beltrão. 27: Pato Branco. 28: Pitanga. 29: Guarapuava. 30: Palmas. 36: Lapa.
microregions; Group 3, 14 microregions; Group 4, 2 microregions; Group 5, 1 microregion and Group 6, 3 microregions (Figure 4).
Group 1 comprises the microregions of Paranavaí, Umuarama, Cianorte, Astorga, Porecatu, Floraí, Maringá, Apucarana, Londrina, Faxinal, Ivaiporã, Assaí, Cornélio Procópio, Jacarezinho, Foz do Iguaçu and Paranaguá. These regions are specialized in soybean and second crop maize. The group consists of microregions in North Central Paraná (known for high productivity and specialized in soybean
cropping), as well as microregions in North Central Paraná, specialized in second crop maize. They are characterized by moderate participation in rural credit facilities, and an almost uniform
Table 3. Coefficients of linear combinations and analysis of principal components (PCA)
Variable 1 Component2 3
LQ (first crop maize) 0.061 0.140 -0.917
LQ (second crop maize) 0.166 0.300 0.865
LQ (soybean) 0.549 0.305 0.102 Cooperatives 0.716 0.299 -0.093 PRONAF (maize) 0.186 0.964 0.083 PRONAMP (maize) 0.582 0.591 0.499 CSV (maize) 0.913 0.221 0.217 PRONAF (soybean) 0.331 0.923 0.004 PRONAMP (soybean) 0.841 0.394 0.233 CSV (soybean) 0.967 -0.013 -0.100
Notes: LQ: location quotient. PRONAF: National Family Agriculture Consolidation Program. PRONAMP: National Medium-Sized Rural Producer Support Program. CSV: credit not linked to a specific program.
Figure 4 - Groups of microregions specialized in soybean, first crop of maize and second crop of
maize.
distribution of the number of cooperatives across the regions. Note that in this Group, there are no microregions specialized in first crop maize.
of Goioerê, Campo Mourão and Cascavel, and is characterized by regions specialized in both soybean and second crop maize. In these microregions, there are substantial rural credit facilities for farmers under the PRONAF, PRONAMP and CSV arrangements. The Group includes regions using modern farming methods to produce grain on a fairly specialized basis, with a significant number of cooperatives. According to Fuentes-Llanillo et al. (2006), this Group includes regions with significant use of employed labor and little outsourcing of services, such as the hiring agricultural equipment and machinery.
Group 3 comprises the microregions of Ibaiti, Wenceslau Braz, Telêmaco Borba, Jaguariaíva, Pitanga, Palmas, Prudentópolis, Irati, União da Vitória, São Mateus do Sul, Cerro Azul, Lapa, Curitiba and Rio Negro. This Group consists predominantly of regions specialized in first crop maize, few cooperatives and low use of rural credit by farmers.
Group 4 comprises the microregions of Ponta Grossa and Guarapuava. It is characterized by regions specialized in soybean and frist crop maize. Note the high concentration of cooperatives in this Group, which, according to Moreira et al. (2012), reflects the importance to these regions of the production of these commodities and the agroindustrial complexes set up. Financing for agricultural production is obtained mainly through PRONAMP and CSV credit facilities, highlighting the predominance of family farming.
Group 5 is the microregion of Toledo.
The region is known for its high degree of specialization in the production of soybean and second crop maize (highest producer in Paraná). It accounts for 10.55% of all rural credit raised by farmers to finance soybean and maize crops, with most financing raised through the PRONAF program. Toledo is also known for pig and chicken production. According to data in the Municipal Livestock Research Program (IBGE, 2020), in 2017 livestock amounted to over 3.2 million pigs and 50.6 million chickens. Dairy, poultry and pig production are key activities in the region and are the main consumers of maize and other cereals. According Martin et al. (2011), farmers exercise multiple activities adding value to the produce generated by farming and livestock in the region.
Group 6 comprises the microregions of Capanema, Francisco Beltrão and Pato Branco, and groups together microregions specialized in soybean and first crop maize. Some 70% of rural credit is obtained through the PRONAF program to finance soybean and maize crops. Most of the soybean producers in this region are family farmers, with production systems consisting of up to 4 physical modules (Vedana & Moraes, 2018). In addition, these microregions also form part of the poultry and pig production chain. Since maize is an essential component of animal feed, the proximity of crops to industrial manufacturers plays a decisive role in adding value along the crop and livestock production chain in this region (Alves et al., 2009).
To summarize, the results show that there has been a transformation in the soybean and
maize production systems in state of Paraná. With the expansion of soybean cropping in locations with favorable edaphoclimatic conditions, soybean is now cropped where first crop maize used to be the norm. The possibility of producing two crops a year has led farmers to grow maize predominantly in the second crop. This in turn has led to the increasing predominance of crop rotation system consists of soybean followed by second crop maize.
Conclusions
Over the past 10 years, soybean and maize production systems have changed in Paraná. The soybean crop has expanded, and the first crop maize has contracted, giving way to soybean. However, annual production of both crops has intensified, and soybean has become the first and second crop maize. Thus, the predominant production system now consists of soybean followed by second crop maize, i.e. the crops are used in a complementary manner during the agricultural year, with the implementation of crop rotation.
There has been an increase in the number of microregions specialized in soybean, a drop in the number specialized in first crop maize, and an increase in the number specialized in second crop maize. Regions that used to specialize in first crop maize have switched over to soybean.
PCA was used to identify three principal components that, taken together, account for 84% of the variability in the data. Component
1 explained 38% of the variability and was positively correlated with productive microregions specialized in soybean production. Component 2 explained 26% of the variability and was positively correlated with family farming. Component 3 explained 20% of the variability and was positively correlated with highly productive microregions specialized in first and second crop maize.
Based on group analysis, six Groups were identified as a function of specialization, type of rural credit acquired and the structure and dynamics of existing agroindustrial complexes in each microregion. Group 1 comprised microregions characterized by moderate participation in credit arrangements, and an almost uniform distribution of the number of cooperatives. Group 2 comprised microregions with a predominance of modern grain agriculture. Group 3 comprised microregions specialized in first crop maize production. Group 4 comprised microregions with the highest number of cropping and livestock cooperatives. Group 5 included only one microregion with a high degree of specialization in soybean and second crop maize. Group 6 comprised microregions specialized in the production of both soybean and first crop maize.
Acknowledgements
Our thanks to the Superintendência de Ciência, Tecnologia e Ensino Superior do Paraná – Unidade Gestora do Fundo Paraná for its
financial support.
References
ALBRECHT, L.P.B.; LUCCA, A.; ÁVILA, M.R.; SCAPIM, C.A.; BARBOSA, M.C.; STÜLP, M. Sementes de soja produzidas em épocas de safrinha na região oeste do Estado do Paraná. Acta Scientiarum. Agronomy, v. 31, n. 1, p. 121-127,
2009. DOI: 10.4025/actasciagron.v31i1.6638. ALVES, L.R.; LIMA, J.F.; PIFFER, M. Dinamismo setorial diferenciado no Oeste e no Sudoeste do Paraná. Revista Brasileira de Estudos Regionais e Urbanos, v. 3, n. 1. São
Paulo, p. 129-153, 2009.
BICUDO, S.J.; CRUZ, S.C.S.; PEREIRA, F.R.S.; BRACHTVOGEL, E.L.; MADALENA, J.A.S. Níveis de adubação para a cultura do milho safrinha. Revista Caatinga, v. 22, n. 2, p. 23-30,
2009.
CALDARELLI, C.E.; BACCHI, M.R.P. Fatores de influência no preço do milho no Brasil. Nova Economia, Belo Horizonte, v. 22, n. 1, p. 141-164,
2012. DOI: 10.1590/S0103-63512012000100005. CALDARELLI, C.E.; DA CÂMARA, M.R.G.; SEREIA, V.J. O complexo agroindustrial da soja no Brasil e no Paraná: exportações e competitividade no período 1990 a 2007. Organizações Rurais & Agroindustriais, v. 11, n. 1, p. 106-120, 2009.
CARMELLO, V. Tendência e variação espacial da soja, e caracterização dos municípios produtores do Paraná, Brasil. Ciência e Natura, v. 40, p.
1-13, 2018. DOI: 10.5902/2179460X27823. CASTRO, N.R.; SPOLADOR, H.F.S.; GASQUES, J.G. Valor da produção, produtividade e uso dos insumos na agricultura: Uma análise descritiva para alguns estados brasileiros, Perspectiva Econômica, v. 13, n. 1, p. 1-23, 2017. DOI: 10.4013/pe.2017.131.01.
DIAS, L.C.P.; PIMENTA, F.M.; SANTOS, A.B.; COSTA, M.H.; LADLE, R.J. Patterns of land use, extensification, and intensification of Brazilian agriculture. Global Change Biology, v. 22, n. 8,
p. 2887-2903, 2016. DOI: 10.1111/gcb.13314. ESPÍNDOLA, C.J.; CUNHA, R.C.C. A dinâmica geoeconômica recente da cadeia produtiva da soja no Brasil e no mundo. GeoTextos, v. 11, n. 1,
217-238, 2015.
FÁVERO, L.P.; BELFIORE, P. Análise de
dados: técnicas multivariadas exploratórias. Rio
de Janeiro: Elsevier, 2015. 344 p.
FONTOURA, S.M. V.; BAYER, C. Adubação nitrogenada para alto rendimento de milho em plantio direto na região Centro-Sul do Paraná.
Revista Brasileira de Ciência do Solo, v. 33,
p. 1721-1732, 2009. DOI: 10.1590/S0100-06832009000600021.
FREITAS, R. E.; MENDONÇA, M. A. A. Expansão agrícola no Brasil e a participação da soja: 20 anos. Revista de Economia e Sociologia Rural, v. 54, n. 3, p. 497-516, 2016. DOI: 10.1590/1234-56781806-94790540306.
FUENTES-LLANILLO, R.; DEL GROSSI, M.E.; SANTOS, F.O.; MUNHOS, P.D.; GUIMARÃES, M.F. Regionalização da agricultura do Estado do Paraná, Brasil. Ciência Rural, v. 36, n.
1, p. 120-127, 2006. DOI: 10.1590/S0103-84782006000100018.
GREENE, W.H. Econometric analysis. Pearson
Education India, 2008.
GONÇALVES, S.L.; CARAMORI, P.H., WREGE, M.S.; SHIOGA, P.; GERAGE, A.C. Épocas de semeadura do milho “safrinha”, no Estado do Paraná, com menores riscos climáticos.
Acta Scientiarum, v. 24, n. 5, p. 1287-1290,
2002. DOI: 10.4025/actasciagron.v24i0.2281. IBGE – Brazilian Geography and Statistics Institute. Municipal Agricultural Production – PAM. Available in: <http://www.sidra.ibge.gov.
br>. Accessed on: March 22, 2018.
IBGE – Brazilian Geography and Statistics Institute. Municipal Livestock Production – PPM. Available in: <http://www.sidra.ibge.gov.
br>. Accessed on: March 20, 2018.
ISSERMAN, A. The location quotient approach to
estimating regional economic impacts. Journal of the American Planning Association, v. 43, n. 1, p.
33-41, 1977. DOI: 10.1080/01944367708977758. KAISER, H.F. The application of electronic computers to factor analysis. Educational and Psychological Measurement, v. 20, n. 1, p.
141-151, 1960. DOI: 10.1177/001316446002000116. MARTIN, T.N.; VENTURINI, T.; API, I.; PAGNONCELLI, A.; VIEIRA JÚNIOR, P.A. Perfil do manejo da cultura de milho no sudoeste do Paraná. Revista Ceres, v. 58, n. 1, p. 1-8, 2011.
DOI: 10.1590/S0034-737X2011000100001. MELO, C.O.; SILVA, G.H.; ESPERANCICNI, M.S.T. Análise econômica da produção de soja e de milho na safra de verão, no Estado do Paraná.
Revista de Política Agrícola, v. 21, n. 1, p.
121-132, 2012.
MENDES, M.C.; MATCHULA, P.H.; ROSSI, E.S.; OLIVEIRA, B.R.; SILVA, C.A.; SÉKULA, C.R. Adubação nitrogenada em cobertura associada com densidades populacionais de híbridos de milho em espaçamento reduzido.
Revista Brasileira de Milho e Sorgo, v. 12, n. 2,
p.92-101, 2013. DOI: 10.18512/1980-6477/rbms. v12n2p92-101.
MOREIRA, V.R.; SILVA, C.L.; MORAES, E.A.; PROTIL, R.M. O cooperativismo e a gestão dos riscos de mercado: análise da fronteira de eficiência do agronegócio paranaense. Revista de Economia
e Sociologia Rural, v. 50, n. 1, p. 51-68, 2012.
DOI: 10.1590/S0103-20032012000100003. SHIOGA P.S.; GERAGE, A.C. Influência da época de plantio no desempenho do milho safrinha no Estado do Paraná, Brasil. Revista Brasileira de Milho e Sorgo, v.9, n.3, p. 236-253, 2010. DOI: 10.18512/1980-6477/rbms.v9n3p236-253.
VEDANA, R.; MORAES, M.L. Agricultura familiar na região sudoeste do Paraná: caracterização a partir dos dados do censo agropecuário de 2006. Brazilian Journal of Development, v. 4, n. 5, p. 2408-2432, 2018.
VON PINHO, R.G.; CANEDO RIVERA, A.A.; BRITO, A.H.; LIMA, T.G. Avaliação agronômica do cultivo de milho em diferentes níveis de
investimento. Ciência e Agrotecnologia, v.
33, n. 1, p. 39-46, 2009. DOI: 10.1590/S1413-70542009000100005.
XIMENES, A.C.A.; DOUZA, L.C.F.; ROBAINA, A.D.; GONÇALVES, M.C. Avaliação da incidência de geadas em componentes de produtividade do milho. Revista Brasileira de Milho e Sorgo, v.3, n.2, p.214-227, 2004. DOI: 10.18512/1980-6477/rbms.v3n2p214-227.
TSUNECHIRO, A; OLIVEIRA, M.D.M.; FURLANETO, F.P.B.; DUARTE, A.P. Análise técnica e econômica de sistemas de produção de milho safrinha, região do médio Paranapanema, Estado de São Paulo. Informações Econômicas,