Default determinants of
PE-backed firms in Europe
Giulia March
Dissertation written under the supervision of
Professor Ricardo Ferreira Reis
Dissertation submitted in partial fulfilment of requirements for the
MSc in Finance, at the Universidade Católica Portuguesa,
iii
Default determinants of
PE-backed firms in Europe
Giulia March
June 2019Abstract
This study examines a sample of European private equity transactions undertaken between 2000 and 2015. The factors that have an impact on the likelihood of the target’s default are identified and evaluated through a logistic regression. Three groups of variables are included in the analysis: (1) economic variables which capture the trend of the overall economy; (2) deal features, defined as variables on which the PE has a decisional power; (3) specific characteristics of the target firm before the transaction. The findings suggest that leverage employed in the transaction, cross border deals, targets ROA previous to the transaction, and the fact of being a company from UK has an impact of the likelihood of default.
Determinantes da falência de
empresas adquiridas por PE na
Europa
Giulia March
June 2019Resumo
Este estudo analisa uma amostra de transações europeias de private equity (PE) realizadas entre 2000 e 2015. Os fatores que influenciam a probabilidade de falência da empresa alvo são identificados e avaliados através de uma regressão logística. Três grupos de variáveis são incluídos na análise: (1) variáveis económicas, que captam a tendência da economia global; (2) características do negócio, definidas como variáveis sobre as quais o PE tem poder de decisão; (3) características específicas da empresa alvo antes da transação. Os resultados sugerem que a alavancagem empregada na transação, transações transnacionais, metas de rentabilidade ROA anterior à transação, e o facto de ser uma empresa do Reino Unido tem um impacto da probabilidade de falência.
vi
Acknowledgements
I thank my supervisor, Ricardo Ferreira Reis, for many useful comments and his support during this project. I also thank Valentina who helped me collecting the data, my parents and all my friends who have always supported and encouraged me on this journey.
Contents
Abstract ... iii Resumo ... v Acknowledgements ... vi List of Tables ... ix List of Figures ... x 1 Introduction ... 1 2 Literature review ... 63 Data Sample and Variables ... 13
3.1 Sample Selection ... 13
3.2 Dependent variable: the Default variable ... 14
3.2 Explanatory variables ... 16
3.3 Instrumental variables ... 18
3.4 Summary statistics ... 20
4 Empirical Analysis ... 23
4.1 Methodology... 23
4.2 Adding extra explanatory variables ... 25
5. Conclusions ... 31
A. Appendix ... 33
List of Tables
Table 1. Summary of the hypothesis………...……….. 12
Table 2. Description of status captions as reported in Amadeus……….….………. 33
Table 3. Description of dependent variables………. 16
Table 4. Explanatory and control variables description……… 34
Table 5. Descriptive statistics for all the variables……… 21
Table 6. Partition of deals among countries ………. 35
Table 7. Regressions results, using all explanatory variables.……….…. 24
Table 8. Variance inflation factor for explanatory variables……… 36
Table 9. Correlation matrix among predictors……….. 36
Table 10. Eigen values and conditional indexes for explanatory variables……….. 37
Table 11. OLS results, using all explanatory variables……… 37
Table 12. Regressions results with dependent variable (1), adding control variables………. 38
Table 13. Regressions results with dependent variable (2), adding control variables………. 39
Table 14. Regressions results with dependent variable (3), adding control variables………. 40
Table 15. Regressions results with dependent variable (4), adding control variables………. 41
Table 16. Regressions results with dependent variable (5), adding control variables………. 42
Table 17. Regressions results with dependent variable (6), adding control variables………. 43
x
List of Figures
Figure 1. Dry powder per PE activity between 2003 and 2018……….2
Figure 2. Deal value and number of LBOs between 1996 and 2018…….………2
Figure 3. Deals partition among years……….…….………22
Figure 4. Targets partition among industries………22
List of Abbreviations
BvD Bureu Van DijkEBIT Earnings before interest and taxes
EBITDA Earnings before interest taxes depreciation and amortization IBO Institutional buyout
IPO Initial public offering LBO Leveraged buyout MBO Management buyout MBI Management buy-in MV Market value
M&A Mergers and acquisitions OLS Ordinary least squares PE Private equity
PTP Public to private RE Retained earnings ROA Return on assets ROE Return on equity SBO Secondary buyout SPV Special purpose vehicle TA Total assets
TL Total liabilities
VIF Variance inflation factor WC Working capital
1
1 Introduction
Private equity firms, together with their LBO activity, have become increasingly important in the world’s financial markets, both as a financing alternative in the corporate lifecycle and as an asset class for investors1. Indeed, Private Equity is seen as a relatively recent asset class that
has been particularly satisfying for investors in the last years since it has, on average, outperformed the stock market2. For the sake of clarity, even if the term private equity is
generally used to encompass both buyouts and venture capital, this paper focuses on the buyout market and will refer to private equity transaction as a typical LBO 3.
PE activity is known for recurring boom and boost periods that characterized its history since the first LBOs. The phenomenon emerged in the 1980s as a consequence of the venture capital activity, benefitting primarily from rising stock prices and the development of the junk bond market, and experienced a first decline in the 1990s4. After that, the activity started to rise again
until a minor decline caused by the 2007 financial crisis. The difference was that this second boom (2001-2006) was driven mainly by the availability of syndicated bank debt in turn traded in the secondary market or packaged into structured products (CLO)5. Subsequently, from 2010,
the sector has started to grow once again and we are now approaching a new boom cycle. Among the favorable factors contributing to this boom have been: an increase in investor’s interest in the sector, ebullient equity markets, low interest rates, abundant liquidity and steady GDP growth in US and Europe.
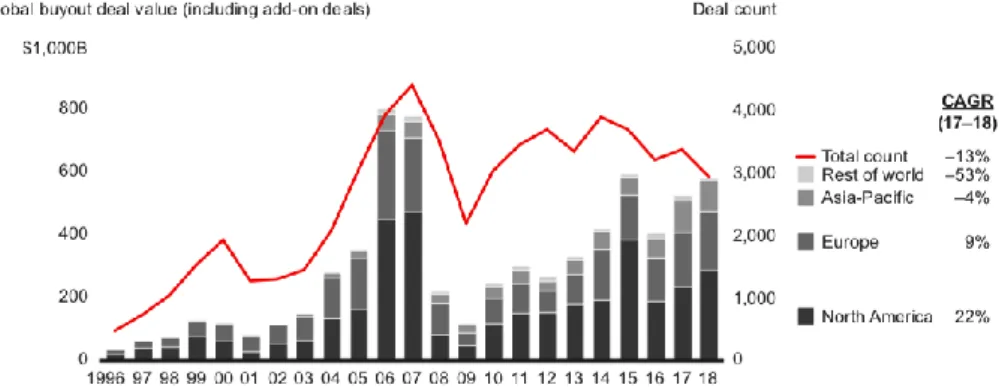
PE firms always have more money available, as investors have allocated more capital to these firms over the past five years than in any time in history. To give an idea of the size of the funds, in 2018, a total of $582 billion was raised globally (+10% from 2017). At the same time, as shown in Figure 1, PE dry powder (defined as uncalled capital) has been rising since 2012 across all fund types. Figure 2 shows how deal values are steadily increasing as of 2014, while
1 Groh, A. P., Baule R. and Gottschalg O. 2008. “Measuring Idiosyncratic Risks in Leveraged Buyout
Transactions.“ IESE Business School Working No. D682.
2 PricewaterhouseCoopers Aktiengesellschaft Wirtschaftsprufungsgesellschaft (Pwc), “Private Equity Trend
Report 2015, Upward momentum inspiring confidence”, 2015.
3 Ernst, S. Koziol, C. and Schweizer, D. 2013. “Are private equity investors boon or bane for an economy? A
theoretical analysis” European Financial Management, 19 (1), 180-207.
4 Fenn, W. George, Liang N. and Prowse S. 2011. “The Private Equity Market: An Overview” Financial Markets,
Institutions and Instruments 6 (4), 1-106.
5 Acharya, V., Franks J. and Sarvaes H. 2007. “Private Equity: Boom and Bust?” Journal of Applied Corporate
2
the number of LBO deals does not seem to increase at the same rhythm (-13% from 2017). This means that the average deal value is remarkably increasing due to the high amount of capital available, indeed the size of the average disclosed buyout has been climbing for six years and hit a record in 2018 with the $17 billion buyout of Thomson Reuters’ Financial & Risk unit, operated by Blackstone and the Canada Pension Plan investment fund6.
Figure 1. Dry powder per PE activity between 2003 and 2018.
Source: Bain & Company, 2019. “Global Private Equity Report 2019”.
Figure 2. Deal value and number of LBOs between 1996 and 2018.
Source: Bain & Company, 2019. “Global Private Equity Report 2019”.
Private equity activity can also be seen as a controversial topic of discussion, mainly because of the high levels of debt that characterize the acquisitions. Indeed, in a leveraged buyout a firm is acquired by a specialized investment firm using a small portion of equity and a relatively large portion of outside debt financing, thus meaning that the ownership is highly concentrated after the transaction and the PE firm owns a majority control. This characteristic of PE transactions ties the acquired company in strict debt obligations, lowering the cash flows
3
available for alternative investments. Critics argue that LBOs increase the probability of bankruptcy, as fixed schedule repayment resulting from leverage are likely to increase the likelihood of default. This could consequently lead to job losses and destruction of the value of corporations, impacting the overall economy negatively7. Moreover, PE firms aim to sell the
target company after a certain period and are therefore accused of striving for high short-term returns at the cost of long-term firm’s prospects8.
On the other side, supporters of PE activity claim that PE funds represent an opportunity for additional funding for firms and provide a new management model, which is superior to any other form of ownership9. Jensen (1989)10 was the first to affirm the superiority of the PE
ownership model. Firstly, it aims to solve agency problems, as it is characterized by concentrated ownership, incentives to the management, and close monitoring of it11. Indeed,
because of the majority interest owned by PE firms in the target company, they are highly motivated in pursuing the best performance and, more importantly, powerful enough to decide the direction the company should take12. Firm executives most of the time own an insignificant
percentage of the outstanding equity in the firms they run, and this weakens their drive to create shareholder value13. On the contrary, one of the main strengths of PE activity is that managers
are usually bestowed with significant shares, which represent an essential incentive to focus on the company’s performance14. Secondly, the high level of leverage forces managers to deal with
operational problems earlier and more forcefully than they would have done in the absence of debt15. Finally, management turnaround after the acquisition is usually very high, and the new
directors appointed by PE firms are aware of the mechanism of a private equity transaction, knowing how to best prepare the company for an advantageous selling16. Following these
7 Palepu, K. G., 1990. “Consequences of leveraged buyouts.” Journal of Financial Economics 27 (1), 247-262. 8 Ernst, S. Koziol, C. and Schweizer, D. 2013. “Are private equity investors boon or bane for an economy? A
theoretical analysis” European Financial Management, 19 (1), 180-207.
9 Ernst, S. Koziol, C. and Schweizer, D. 2013.
10 Jensen, M. C. 1989. “The eclipse of the public corporation” Harvard Business Review, 89, 61-74. 11 Murphy, K. J. 2012. “Executive Compensation: Where We Are and how We Got There” in George M. C.
Milton H. and Stulz R. Handbook of Economics of Finance, vol. 2, 211, 233-35.
12 Cheffins, B. R. and Armour, J. 2007. “The Eclipse of Private Equity”, Dalware Journal of Corporate Law, 33 (1). 13 M Murphy, K. J. 2012.
14 Cheffins, B. R. and Armour, J. 2007. 15 Jensen, M. C. 1989.
16 Ronald W. M. and Randall S. T. 2009. “Does Private Equity Create Wealth? The Effects of Private Equity and
4
theories, several studies support the notion that leveraged transactions create value, showing significant gains in operating performance after the deal17.
Even if it is not clear how long this positive atmosphere can last until the next downturn materializes, it is evident that PE activity plays an important role in almost all developed capital market. For this reason, since the 1980s, there has been considerable research on the topic. The results observable in the literature are often conflicting, and this can be partially attributed to the quality of data. Indeed, the research conducted on private equity usually focuses on specific geographic markets or segments (especially PTPs or MBOs) due to the scarcity of data and limited samples to conduct proper research18. In most instances, data for private firms are not
fully and easily accessible, which is why many studies examine transactions that involve public debt, companies that subsequently went public or LBO of public companies. For this reason, more frequently than not, the results obtained are potentially biased and not generalizable to a broader population of PE transactions. For example, firms with public debt financing are usually bigger and the sample would, therefore, be characterized by larger companies.
Most of the research on this topic, focuses on PE funds drivers’ returns or investigate the post-investment impact on the target company, highlighting the effects of PE management to find out if this particular type of ownership creates value improving firm’s performance19. Fewer
papers address the issue of PE-backed companies’ default and those which did, mainly focused on public companies. Indeed, research into corporate failure, more broadly not only considering PE-backed companies, has focused mainly on listed companies due to data availability20.
This research provides insights into the most relevant criteria that PE firms should take into account when investing in a company to reduce the likelihood of default. The purpose of this paper is to investigate which factors have an impact on the probability of default of the target company focusing on Europe, highlighting that the research was initially intended to be more extensive including the US market. However, it was not possible to gather enough accounting
17 Shourun, G. Hotchkiss E. S. and Weihong S. 2011. “Do Buyouts (Still) Create Value?”, The Journal of Finance,
66 (2), 479-517.
18 Puche, B. Braun R. and Achleitner A. 2015. “International evidence on value creation in private equity
transactions”, Journal of Applied Finance, 27 (4), 105-122.
19 Burth, B. and Solveig R. 2019. “Private equity deal success and pre-acquisition determinants – empirical
evidence from Germany”, Applied Economics, 51 (2), 141-154.
20 Wilson, N. and Wright M. 2013. “Private Equity, Buyouts and Insolvency Risk”, Journal of business Finance and
5
data for the target companies in that region in order to obtain reasonable regression results, and hence, the US sample has not been considered in the end.
As suggested by Palepu (1990)21, there are three main reasons why a buyout could fail. Firstly,
the structure of the buyout could be flawed; for example, the leverage is not sustainable compared with post-buyout cash flows or a too high premium was paid. Secondly, post-buyout management could be weak. Third, the general economic condition could have a decisive impact. As data related to the management of such a large sample is not easily collected, the second category has been substituted with pre-acquisition target characteristics22, linked either
to the business activity or to its history. Summarizing, the analysis takes into account a sample of 7318 private equity acquisitions undertaken in Europe between 2000 and 2015, considering three dimensions of factors that influence default: (1) economic variables which capture the trend of the overall economy; (2) deal factors, defined as variables on which the PE has a decisional impact; (3) specific characteristics of the target firm before the transaction.
The paper is structured as follows. In the next section, a review of literature regarding the PE deals outcome is presented and this is used to create the research hypothesis. Successively, the sample collection is described, and the variables used are defined. In section IV results are shown and the relative impact of each factor on default is discussed. Section V concludes and suggestions for further research are presented.
This research provides insight on where to invest in the European landscape, analyzing a potential relation between the success or failure of a deal and a set of defined factors. Based on the analyzed criteria, the aim is to draw a conclusion on whether PE decision making can be optimized taking into account the significant factors.
21 Palepu, K. G., 1990.
22 These factors have recently been investigated by Burth and Solveig for a sample of acquisitions carried out in
Germany. Reference: Burth, B. and Solveig R. 2019. “Private equity deal success and pre-acquisition determinants – empirical evidence from Germany”, Applied Economics, 51 (2), 141-154.
6
2 Literature review
The percentage of deals in which the target company defaults, is usually found to be very low despite the differences in sample and period analyzed. Andrade and Kaplan (1998)23 identify
that 29% of the larger public-to-private transactions of the 1980s defaulted at some point. Kaplan and Stein (1993)24 analyzed the collapse of the LBO market in the late 1980s, arguing
that 26 of the 83 large LBOs completed between 1985 and 1989 defaulted and 18 entered Chapter 11 bankruptcy proceedings. Lopez-De-Silanes et al. (2010)25 reported from a sample
of 7453 LBOs that 12.9% of PE deals went bankrupt between 1971 and 2005 worldwide. On average, it was found to have lower default rate from studying the second wave of LBOs. Thomas (2010)26 analyzing a sample of 3269 private equity transactions occurred in US
between 2000 and 2009, finds that between 2008 and 2009, 183 targets defaulted. It can be translated to a 5.6% cumulative default rate (2.84% annually), which is lower than the overall speculative-grade default (6.17% per year for the same period found by Moody’s). Similarly, Kaplan and Stromberg (2009)27, analyzing a sample of 17171 private equity acquisitions carried
out worldwide between 1970 and 2007, found that only 6% ended in bankruptcy (on average 1.2% annually), underlying that the bankruptcy incidence was lower than the Moody’s average default rate for the same period (1.6% annually28). Achleitner, Braun and Engel (2011)29
analyzing a sample of 1090 deals undertaken in Europe between 1986 and 2010, found that 99 of the transactions did not generate any positive cash flow for the PE firm or went bankrupt, which represent 9.1% of the sample.
An element that is claimed to greatly impact the PE industry is the credit market condition. Both in the 80’ and mid’00 booms, the credit market experienced an explosion in liquidity which led to an unprecedented supply of leverage throughout the global financial system and,
23 Andrade, G. and Kaplan S. N. 1998. “How costly is financial (not economic distress)? Evidenced from Highly
Leveraged Transactions that became distressed”, Journal of Finance, 53 (5), 1443-1494.
24 Kaplan, S. N. and Stein. 1993. “The evolution of buyout pricing and Financial Structure in the 1980s”, Quarterly
Journal of EconomicsI, 108 (2), 313-357.
25 Lopez-De-Silanes, F. Phalippou L. and Gottschalg O. 2015. “Giants at the Gate: Investment Returns and
Diseconomies of Scale in Private Equity“, Journal of Financial and Quantitative AnalysisI, 50 (3), 377-411.
26 Thomas, M. J. 2010. “The Credit Performance of Private Equity-Backed Companies in the Great Recession of
2008-2009”, Private Equity Council.
27 Kaplan, S. N. and Stromberg P. 2009. “Leveraged Buyout and Private Equity”, Journal of Economic Perspectives,
23 (1), 121-248.
28 Default rate of bond issuers between 1980 to 2002 by Moody’s.
29 Achleitner, A. Braun R. and Engel N. 2011. “Value creation and pricing in buyouts: Empirical evidence from
7
in particular, to a growth of investments in private equity and hedge funds30. Kaplan and
Stromberg (2009) argue that private equity investments are related to economic conditions, affirming that investors seem to take advantage of market timing when the cost of debt is particularly low. They also observe that in specific periods of the boom-and-bust cycle, when the debt is particularly cheap, private equity firms overpay their targets, and this seems to be one of the reasons that lead to losses. Alexston et al. (2013)31 confirm this hypothesis finding
that leverage is associated to higher transaction prices and lower funds final returns, advocating that PE firms overpay their targets in periods of easy access to credit, due to easy access to debt. Consistent with this finding, Guo, Hotchkiss and Song (2010)32 analyze a sample of 192 public
to private transactions undertaken between 1990 and 2006, of which 23 defaulted (12%), finding that these deals generated an only a modest increase in firm operating performance still generating high returns. They consider the impact of transaction pricing on the deal outcome, providing evidence that private equity firms benefit from acquiring targets at a lower price than other bidders, therefore buying at a particularly low price and selling high. Similar results were obtained by Acharya and Kehoe (2007)33, Bargeron, Schlingemann, Stulz and Zutter (2007)34
and Wright et al. (1995)35. Linked with these finding, Achleitner, Braun and Engel (2011)36,
analyze buyouts carried out between 1986 and 2010 in Europe and North America and argue that besides leverage and operational improvements, the EBITDA multiple expansion (defined as the difference between the entry and exit price) is particularly important to determine PE returns. This finding would suggest that the price paid at entrance has an important role in the deal outcome, advocating that the lower the premium paid at entrance the lower the probability of default.
An interesting point of discussion is whether the level of leverage influences the probability of bankruptcy. Kaplan and Stain (1993)37 argue that the high incidence of default registered in the
1980s leveraged buyout is due to the excessive amount of leverage undertaken by PE firms, which increased to 90% of the total capital, together with an increase in the price paid in the
30 Morgan Stanley, 2006. “Morgan Stanley Roundtable on Private Equity and Its Import for Public Companies“,
Journal of Applied Corporate Finance, 18 (3), 8-37.
31 Alexston et al, 2013
32 Shourun, G. Hotchkiss E. S. and Weihong S. 2011. 33 Acharya, V., Franks J. and Sarvaes H. 2007.
34 Bargeron, L. Schlingemann F. P. Stulz S. and Zutter C. 2007. “Why Do Private Acquirers Pay So Little Compared
to Public Acquirers?”, Fisher College of Business Working Paper 2007-03-011.
35 Wright, M.Thomson S Robbie K. and Pauline W. 1995. “Management Buy-Outs in the short and long term”,
Journal of Business Finance Accounting, 22 (4), 461-482.
36 Achleitner, A. Braun R. and Engel N. 2011. 37 Kaplan, S. N. and Stein J. 1993.
8
transactions. Alexstone, Jenkinson, Stromberg and Weisbach (2012)38 analyze a sample of 153
buyouts carried out by top PE firms between 1980 and 2006 in Europe and US, including mainly public to private transactions. For the period 2004-2007 they find very high leverage of about 73%, similar to the 77% that characterized the 1980s LBO boom which subsequently collapsed, therefore suggesting that the level of leverage plays a role in the default probability. Findings in line with this hypothesis are also shown by Hotchkiss et al. (2011)39 for US and Wilson and
Wright (2013)40 analyzing a sample of UK acquisitions.
On the contrary, Thomas (2010)41 found that a large number of the defaulted companies had
little or no leverage indicating that leverage did not play a role in the probability of default. Instead, stating that default seems correlated with the financial health of the target company at the time of the acquisition, as most of the defaulted companies were acquired by previous bankruptcies. Moreover, the default seems to be correlated to the overall economic activity, as companies belonging to sectors affected by a downturn in the period were overrepresented. An important issue is that the premium paid at entrance and the level of leverage seem to be correlated. Indeed, Axelston et al. (2012)42 provide empirical evidence of a negative correlation
between deal leverage and interest rates, showing that the leverage used in the deal is unrelated to firm and industry characteristics whilst appearing to be driven by economic credit condition. The conclusions suggest that deals tend to be priced higher if cheap debt is available, as more leverage is used in the transaction. The correlation between deal pricing and leverage is also found by Ilg (2015)43 and Achleitner, Braun and Engel (2011)44, who spot a positive correlation
between leverage and buyout pricing. In line with this finding, Alexstone, Jenkinson, Stromberg and Weisbach (2008)45, regressing the level of leverage to firm-specific characteristics,
aggregate market conditions and the characteristic of the buyout fund, find that the main determinant of leverage is the real interest cost of the loans (measured as the local real interest rate plus the spread for leveraged debt).
38 Axelson, U. Jenkinson T. Strömberg, P. and Weisbach, M. S. 2012. “Borrow cheap, buy high? The determinants
of leverage and pricing in buyouts“, Discussion paper, Centre for Economic Policy Research, London School of Economics and Political Science, London.
39 Hotchkiss, E. D. Smith D. C, and Stromberg P. 2011. “Private Equity and the Resolution of Financial Distress“,
paper presented at the Coller Private Equity Institute Conference, London Business School.
40 Wilson, N. and Wright M. 2013. 41 Thomas, M. J. 2010.
42 Axelson, U. Jenkinson T. Strömberg, P. and Weisbach, M. S. 2012. 43 Ilg, D. 2015. “Value creation drivers in large leveraged buyouts”. 44 Achleitner, A. Braun R. and Engel N. 2011.
9 Hypothesis 1. Hence, from what the literature establishes, the following hypothesis can be outlined: the higher the leverage used in a transaction the higher the probability of default.
Several studies support the idea that private activity returns are linked to economic conditions. Alexson et al. (2012)46 argue that when the economy is particularly prosperous, there is
evidence of greater private equity fundraising, higher deals value and more leverage. However, it is not clear if the economic trend has an impact in terms of deal returns and default probability. It could be expected that economic downturns could increase the probability of default as the target company’s performance could be impacted negatively. In line with this view, Kaplan and Stein (2007)47 find that in the 1980s LBO collapse, as a reaction to the economic crisis, banks
accelerated their principal repayments resulting in an unsustainable schedule for many firms. On the opposite, Guo, Hotchkiss and Song (2010)48 find evidence that year dummies, either
for the year of the buyout or the exit, do not help in explaining the performance, suggesting that the deal outcome does not depend on the overall economic trend. An explanation for the fact that downturns do not play a role is given by the findings of Bernstein et al. (2017)49. They
analyze a sample of PE backed companies in UK and find that PE-backed firms invest more aggressively than peer companies during downturns. This ability to maintain a high level of investment appears related to the superior access of PE-baked companies to financing, and the lower cost of debt (measured as interest expenses over total debt compared with a control sample of non PE-backed companies). In line with these findings, Ivashina and Kovner (2011)50
found that PE groups represent a valuable source of funding during downturns, due to the strong bonds with the banking industry which allow them to access credit for their firms during periods of crisis. Moreover, PE firms raise money to their funds which is then invested over multiple years, leaving them with high undrawn capital. It turns out to be particularly useful in periods in which the accessibility to credit, for example to refinance a distressed company, is more complicated. For these reasons, it seems that PE-backed companies are not affected by economic downturns as their peers.
Hypothesis 2. Due to the high leverage employed by PE firms, it is fundamental that the target firm is generating the forecasted cash flow after the acquisition, in order to pay back the debt
46 Axelson, U. Jenkinson T. Strömberg, P. and Weisbach, M. S. 2012. 47 Kaplan, S. N. and Stein. 1993.
48 Shourun, G. Hotchkiss E. S. and Weihong S. 2011.
49 Bernstein, S. Lerner J and Mezzanotti F. 2017. “Private equity and financial fragility during the crisis”, NBER
Working Paper No. w23626.
50 Ivashina, V and Kovner, A. 2011. “The Private Equity Advantage: Leveraged Buyout Firms and Relationship
10 on a fixed schedule. It is expected that if the country experiences a contraction in the GDP, the firm’s revenue could be impacted negatively leading to fewer cash flows available and increasing the probability of insolvency.
Smith and Stromberg (2014)51 focus on the characteristics of the PE acquirer. They argue that
the likelihood of default is lower when the LBO acquisition is relatively recent in the lifetime of the particular fund, due to the ability to provide capital support thanks to undrawn commitments. In addition, the likelihood of default decreases when the PE firm has been more successful, measured by the ability to raise new funds.
Hypothesis 3. Following what highlighted in the literature, it is expected that companies backed by more successful PE firms are less likely to default.
Limited research has been conducted on the potential relationship between pre-buyout target characteristics and the probability of default. Berthold and Solveig (2019)52 confront this issue
analyzing the deal outcome (measured via the equity multiple) of 125 transactions that took place in Germany. They argue that pre-buyout revenue has a negative influence on the outcome of the transaction, as targets with lower revenue are more likely to outperform than bigger targets. A positive influence has also been found for one of the seven industries (healthcare), meaning that operating in a specific industry can be advantageous. Contrasting to this, pre-buyout EBITDA, industry and firm’s age does not seem to be good predictors of the success of PE transactions in Germany.
They do not investigate specific pre-acquisition profitability ratios, however, Wilson et al. (2013)53, analyzing a sample of UK buyouts between 1995 and 2010, argue that PE firms tend
to choose companies with higher profitability (ROA) and cash generation, expecting that they will continue to be particularly profitable after the acquisition.
Hypothesis 4. In line with previous studies, it is expected that the age of the target does not influence the probability of default.
Hypothesis 5. In accordance with the literature, companies which are more profitable before the acquisition, measured by ROA, are less likely to experience default.
51 Hotchkiss, E. D. Smith D. C, and Stromberg P. 2011. 52 Burth, B. and Solveig R. 2019.
11
An additional factor to consider is whether the target company is characterized by a particular condition at the moment of the acquisition. Special circumstances are a secondary buyout, defined as a deal in which both acquirer and seller are financial sponsors54 and a distressed
acquisition. There is much skepticism about SBOs in the research community. Bonini (2010)55
claims that in SBOs the operating performance is not improved as much as in first buyouts. Cumming and MacIntosh (2003)56 argue that the increase in SBO activity coincided with
greater liquidity and higher deal price and leverage than first buyouts. This would suggest that in SBO the returns are mainly due to the leverage effect than an actual operational improvement. Prequin (2011)57 prompts that in periods of high undrawn capital, PE firms have higher pressure
to invest and they may end up not acting in the best interest of investors, carrying out SBOs despite being aware of limited possible operational improvement. An opposite view is given by Achleitner and Figge (2012)58, who study a sample of 2456 European buyouts between 1990
and 2010 and find no evidence that secondary buyouts generate lower returns for the PE fund.
Hypothesis 6. Considering the finding of previous studies, which claim lower operational improvement and higher leverage in secondary buyouts, the following hypothesis is stated: SBOs are more likely to default than primary buyouts.
The second particular condition discussed is the case of the target company being financially distressed before the acquisition. Sudarsanam et al. (2011)59 studying a sample of P2P UK
transactions, argue that, even if distressed companies could represent a significant turnaround opportunity, the high bankruptcy risk at the time of acquisition increases the changes that the target will end up in default later. A similar thesis is supported by Opler and Titman (1993) 60
who claim that an high bankruptcy risk when associated with the typical high leverage used in PE deals, may increase the chances of default.
54 Achleitner, A. and Figge C. 2012. “Private Equity Lemons? Evidence on Value Creation in Secondary Buyouts”,
European Financial ManagementI, 20 (2), 406-433.
55 Bonini, S. 2010. “Secondary Buyouts: Operating Performance and Investment Determinants”, Financial
Management, 44 (2), 431-470.
56 Cumming, D. and MacIntosh J. 2003. “Venture capital exits in Canada and the United States”, University of
Toronto Journal, 53 (2), 101-200.
57 Prequin, 2011. “Secondary buyouts as a proportion of deal activity”. 58 Achleitner, A. and Figge C. 2012.
59 Sudarsanam, S. Wright M. and Huang J. 2011, “Target Bankruptcy Risk and Its Impact on Going Private
Buyout Performance and Exit”, Corporate Governance: An International Overview, 19 (3), 240-258.
60 Opler, T. and Titman, S. 1993. “The determinants of leveraged buyout activity: Free cash flow vs. financial
12 Hypothesis 7. In line with the presented literature, it is predicted that acquisitions of distressed companies are more likely to end up in default.
Scellato et al. (2013)61 investigate 241 private to private buyouts involving European companies
and find out that target companies backed by PE firms in the same country exhibit higher post-buyout performance. They argue that this is due to a comparative advantage in dealing with asymmetric information and agency problems, and in offering privileged access to expert advice.
Hypothesis 8. Following the mentioned findings, companies backed by PE firms in the same nation are expected to be less likely to default.
The UK has always been the largest LBO player in Europe62 and, back in 2007, it showed the
biggest PE market as percentage of country GDP. Moreover, it is the first European country in terms of deals number63.
Hypothesis 9. As the PE market is more developed in UK, it is expected that PE firms in this region are more experienced and knowledgeable of how to manage the acquired firms. Hence, targets operating in the UK are expected to be less likely to default.
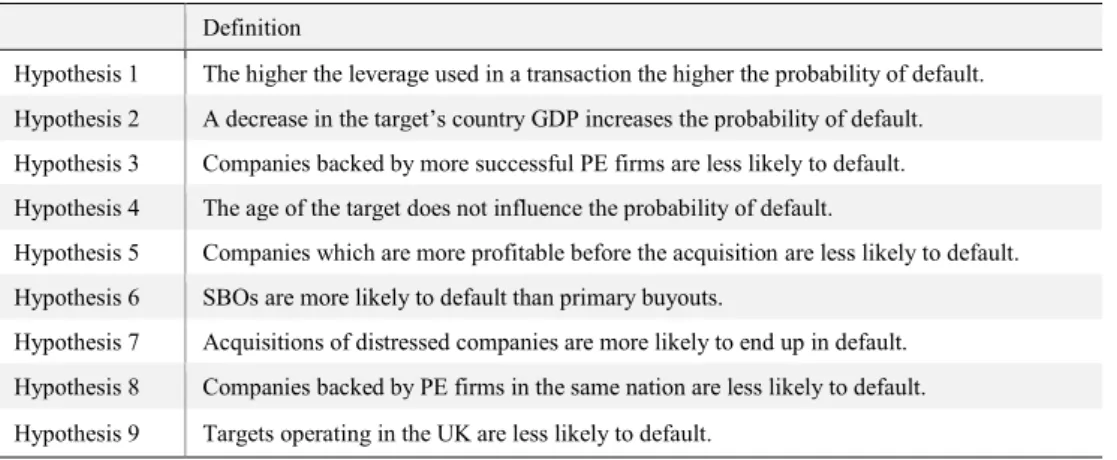
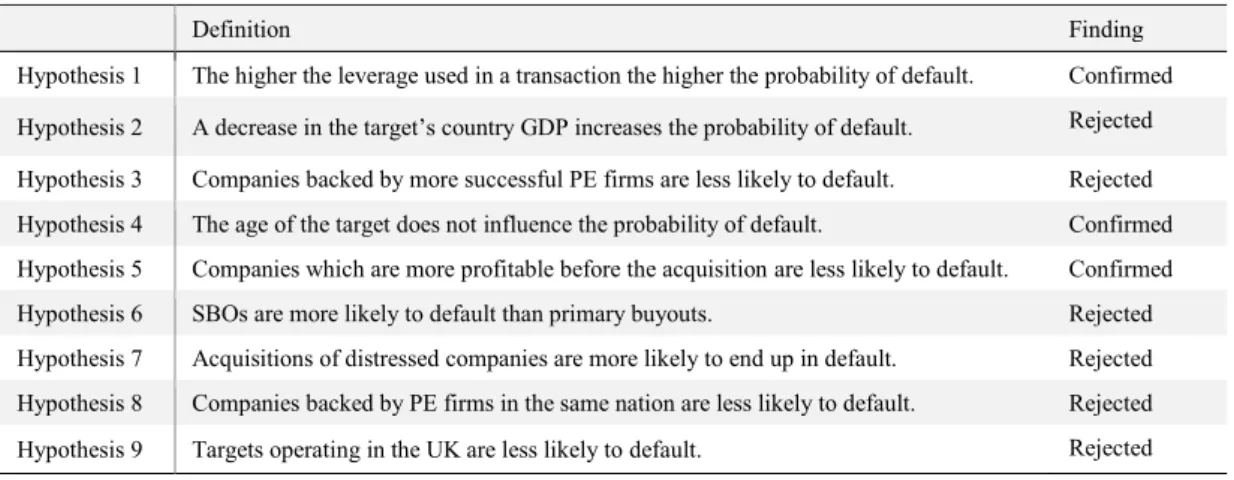
Table 1 presents a summary of the discussed hypothesis.
Table 1. Summary of the hypothesis.
Definition
Hypothesis 1 The higher the leverage used in a transaction the higher the probability of default. Hypothesis 2 A decrease in the target’s country GDP increases the probability of default. Hypothesis 3 Companies backed by more successful PE firms are less likely to default. Hypothesis 4 The age of the target does not influence the probability of default.
Hypothesis 5 Companies which are more profitable before the acquisition are less likely to default. Hypothesis 6 SBOs are more likely to default than primary buyouts.
Hypothesis 7 Acquisitions of distressed companies are more likely to end up in default. Hypothesis 8 Companies backed by PE firms in the same nation are less likely to default. Hypothesis 9 Targets operating in the UK are less likely to default.
61 Scellato, G. and Ughetto, E. 2013. “Real effects of private equity investments: Evidence from Euroean
buyouts”, Journal of Business ResearchI, 66, 2642-2649.
62 Blundell-Wignall, A. 2007, “Private Equity Boom: Causes and Policy Issues”, Financial Markets Trends, 1,
59.86.
13
3 Data Sample and Variables
3.1 Sample Selection
The data collection for this paper requires a two-steps approach: (1) deal data collection and (2) target characteristics collection. The first part focuses on gathering data about the PE deals that took place in Europe between 2000 and 2015; collected data includes information on the deal’s features (i.e. value, date), on the target firm and the acquiring PE firm. The initial sample is drawn by data held by Zephyr, owned by Bureau Van Dijk, the most comprehensive database regarding deal information. In particular, it contains a specific sub-database with detailed information regarding private equity deals. The initial screening identifies 10972 transactions that took place between 2000 and 2015 in Europe, classified as “institutional buyout”, for which the deal is defined as “completed - confirmed”64 and report as transaction financing the caption
“private equity”65 and as sub-deal type “leveraged buyout”66. Thereafter, only deals in which
the BvD ID number of the target company were present are kept in the sample. This is a code which identifies the companies in an unequivocal way among all Bureau Van Dijk databases, and it is later needed to match the target companies in Amadeus. Moreover, only acquisitions of a majority interest (between 50% plus one and 100% stakes) are considered, excluding the cases in which the acquirer was already owning more than 50%67.
The second part focuses on collecting data about the target company with a matching procedure in Amadeus from Bureau Van Dijk. Through this database, it is possible to obtain the status of the company, which is fundamental to differentiate between the companies that defaulted and the ones that did not. Moreover, it provides accounting data needed to investigate whether specific characteristics of the target firm before the acquisition play a role in the target’s default probability and to calculate specific post-deal ratios. The matching procedure highlights that
64 According to Zephyr, the deal is described as “completed – confirmed” when a formal confirmation of the
deal was located. Otherwise, the deal is described as “completed – assumed”.
65 This caption is added to the deal as financing method when the deal contains an element of Private Equity
activity on the Acquiror’s side of the deal, whether this is through funding or through an MBO, a MBI or an IBO.
66 This sub-deal type would be added whenever a significant amount of borrowed funds/debt are used to
acquire the Target.
67 Owning a control interest would give the PE firm the power to lever the balance sheet of the target. Hence,
14
about 70% of the codes are found in Amadeus. As some companies appear two times in the sample (being SBOs), in the end a final sample of 7318 deals was analyzed.
However, the fact of being present in the database does not imply that all data for the variables needed is actually provided; indeed, many missing observations are present. Moreover, Amadeus provides the ten most recent years for the same company starting from a certain “last year available” and going backwards. This last year is sometimes previous to the acquisition date and many times the reason for not updating the company’s data is unclear. For this reason, when including accounting information in the model, the considered sample ends up being significantly smaller.
3.2 Dependent variable: the Default variable
An important matter is to differentiate between the companies that defaulted and the ones that did not. In order to discriminate between the two categories, three main methods have been utilized. Hence, several regression models are developed, one for each defined dependent variable.
Amadeus Status, dependent variable (1) is defined
The first measure relies on the “Status” reported in Amadeus for the target company. A list of “statuses” is disclosed for every company together with the relative dates, yet it is fundamental to determine whether the default occurred while the company was still under the PE firm control. In other words, it is important to control for the fact that the deal has not been already exited at the time of default, as in this case the influence of a subsequent owner could have had an impact. To solve this issue, the BvD ID code of each target company was matched with a list of acquisitions provided by Zephyr and carried out between 2000 and 2019, highlighting if the company was involved in any subsequent deal and to determine its date. As not all M&A deals are present in the database, for the target companies identified as defaulted a further control is carried out looking for online news mentioning that they were involved in subsequent deals. For the purpose of this paper, a company it is considered as “defaulted” if it missed a payment or filed for bankruptcy, as this is the definition of default for a credit default swap contract, according to the International Swaps and Derivatives Association (ISDA). Therefore, are considered as defaulted companies reporting as “Status” the following captions:
15
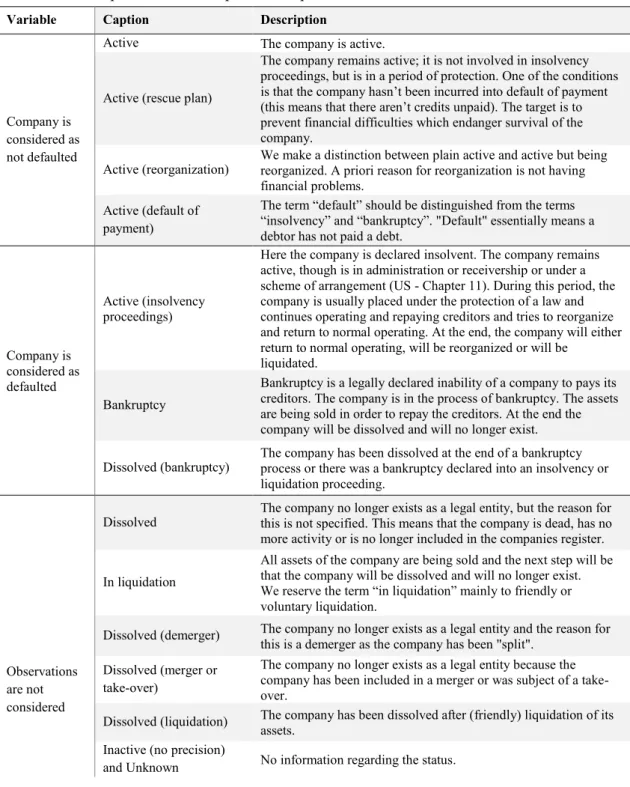
“Bankruptcy”, “Defaulted (Bankruptcy)”, “Active: insolvency proceedings”, “Active (rescue plan)” and “Active: default of payment”. On the contrary, companies reporting “Active” are considered as still alive. Table 2 in Appendix reports detailed description of each Status variable.
This procedure identifies the defaulted companies with high certainty, but few shortfalls are still present. Firstly, for some firms the status is “Unknown” or not reported, hence they are excluded from the analysis, decreasing the sample size. Secondly, it is possible that firms classified as active actually defaulted, both if the status has not been updated anymore or due to errors in the database. For this reason, two other methods to discriminate between the two categories are employed.
Assets analysis, dependent variable (2) is defined
To partially remedy the first shortfall, the approach of Bernstain, Lerner and Mezzanotti (2019)68 is applied. It is based on observing whether assets are not reported any more in the
database, while they were reported in the year of the acquisition. In this case, a firm is considered “out of business” and these observations are added to the list of defaulted companies found with the first method. Similarly, companies that still report assets are considered as active (26 defaulted and 21 active companies could be added to the sample with this method). However, the interpretation of this variable is unclear as the company can disappear from the database for many reasons, such as an acquisition, a liquidation, a merger or a bankruptcy.
Ratio Approach, dependent variables (3) (4) (5) and (6) are defined
To deal with both the first and second shortfall described, a third method is implemented. The use of financial ratios to predict bankruptcy was pioneered by Beaver (1966)69 and Altman
(1968)70. ROA (defined as net income over total assets) is chosen as discriminant ratio, being
found the second-best ratio to predict bankruptcy according to Beaver 71. A decision had to be
taken regarding the ratio cut-off point and the year to observe the ROA. It is important to choose a number of years after the transaction in which it is fairly sure that the deal has not been exited yet and, at the same time, enough time is left to the target company to actually default. In this
68 Bernstein, S. Lerner, J. and Mezzanotti, F. 2017.
69 Beaver, W. 1966. “Financial Ratios as predictors of failure”, Journal of Accounting Research, 4, 71-111. 70 Altman, E. I. 1968. “Financial ratios, discriminant analysis and the prediction of corporate bankruptcy”, The
Journal of Finance, 23 (4),589-609.
71 Beaver (1966) individuates cash flows over total debt as best ratio to predict bankruptcy, however not enough
16
paper, the ratios are calculated three and five years after the acquisition as the average holding period is found to be between 4.5 and 5.8 years72. Even if five years is probably a better time
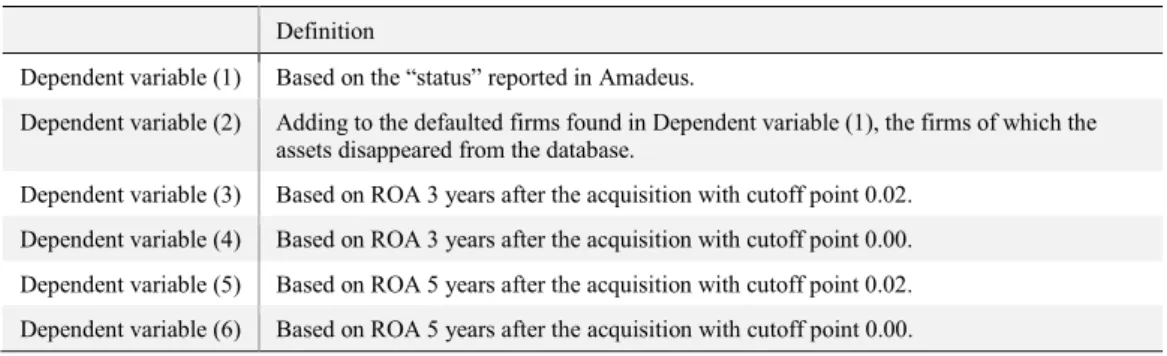
period, three years is taken into account as more observations are present. Indeed, as only ten years of data are kept in Amadeus, considering a subsequent year decreases the number of observations available. Following the mentioned paper, the cut-off points are set both at 0.02 and 0.00. Concluding, variables (3) and (4) are based on the ROA three years after the transaction with cut-off points of 0.02 and 0.00 respectively. Variables (5) and (6) are defined observing the ROA five years after the transaction with a cut-off point of 0.02 and 0.00 respectively. Table 3 presents an overview of the discussed dependent variables.
Table 3. Description of the dependent variables.
Definition
Dependent variable (1) Based on the “status” reported in Amadeus.
Dependent variable (2) Adding to the defaulted firms found in Dependent variable (1), the firms of which the assets disappeared from the database.
Dependent variable (3) Based on ROA 3 years after the acquisition with cutoff point 0.02. Dependent variable (4) Based on ROA 3 years after the acquisition with cutoff point 0.00. Dependent variable (5) Based on ROA 5 years after the acquisition with cutoff point 0.02. Dependent variable (6) Based on ROA 5 years after the acquisition with cutoff point 0.00.
3.2 Explanatory variables
Leverage
This variable is measured by the ratio of debt to capital73 in the year of the acquisition. Outliers
are winsorized at the 99th and 1st percentile to obtain more robust results.
Top 5
This variable is a binary variable which points out whether the transaction is carried out by a particularly active PE firm. The five PE firms are individuated relying on the number of transactions carried out within the sample, as this is assumed to be an indicator of a firm’s size. They are Blackstone, the Carlyle Group, Sun Capital Partners, 3 I Group and Riverside.
72 Bain & Company, 2019. “Global Private Equity Report 2019”.
17 Cross Border
A variable that is expected to capture the experience of the PE firm is the dummy variable “Cross Border”, denoting when the PE firm and the target do not belong to the same country. Indeed, it is reasonable to assume that smaller PE firms focus their investments in their own region due to a better knowledge of the market, while bigger firms take on more risk investing abroad, maybe cooperating with smaller local PE firms.
GDP growth
This variable accounts for the economic conditions of the target country. It is calculated by the GDP growth mean of the three years following the acquisition, in the target country. Data was obtained from OECD statistics database.
Deal Type
This is a categorical variable that distinguishes among distressed acquisitions, secondary buyouts and the rest of the transactions. Secondary buyouts are identified according to the “deal rationale” description reported in Amadeus, which indicates whether the deal is an exit from a previous PE owner. Moreover, all deals in which the target company is appearing for the second time in the sample were added. Likewise, distressed firms are identified through the “deal rationale” reported in Amadeus, whenever a distressed acquisition caption is reported. In addition, when all needed accounting data relative to the year before the transaction are available, the z-score for non-manufacturing companies (Altman, 200074) is used to define
whether the acquired company was in financial distress before the acquisition. The z-score is defined as:
𝑍 − 𝑠𝑐𝑜𝑟𝑒 = 6.72 𝐸𝐵𝐼𝑇 𝑇𝐴 + 1.05 𝑀𝑉 𝐸𝑞𝑢𝑖𝑡𝑦 𝑇𝐿 + 6.5 𝑊𝐶 𝑇𝐴 + 3.26 𝑅𝐸 𝑇𝐴
with Equity being market value of equity; WC working capital; RE retained earnings; TL total liabilities and TA total assets. As some data to calculate the ratios is missing, “shareholder funds” are used instead of retained earnings and book value of equity is employed instead of the market value (the same approximations are used by Tykvová and Borell, calculating the
74 Altman, E. I. 2000. “Predicting Financial Distress of Companies: revisiting the z-score and zeta models”, Working
18
score using Amadeus database75). According to the model, companies that score more than 2.9
are considered healthy, companies with a lower score than 1.23 are in high financial distress and the ones with a score in-between stand in a grey area. In this paper, only companies with a score lower than 1.23 are categorized as in financial distress.
ROA
The variable “ROA” is defined as net income over total assets in the last full year prior to the buyout. Outliers are winsorized at the 99th and 1st percentile.
Common Law
This is a binary variable which takes into account whether the target company operates in a common law country (UK) or not.
Target age
This variable captures the age of the target company and is calculated as the difference between the incorporation year, reported in Amadeus, and the deal year reported in Zephyr. The variable is transformed into natural logarithms to avoid spurious results76.
3.3 Instrumental variables
Revenue and EBIT
These variables are observed in the year before the transaction. Outliers are winsorized at the 99th and 1st percentile.
ROE
This variable is calculated as net income over equity in the year previous to the acquisition. Outliers are winsorized at the 99th and 1st percentile.
75 Tykvová, T. and Borell, M. 2012. “Do Private Equity Owners Increase Risk of Financial Distress and Bankruptcy“,
Journal of Corporate Finance, 18 (1), 138-150.
19 Initial stake
This is a dummy variable which indicates whether the PE firm was already owning a minor stake in the target company before the acquisition. The information is taken by the “deal description” reported in Amadeus which indicates whether the acquisition is 100% and the previously owned stake.
Crisis
This is a dummy variable that controls whether the financial crisis has an impact on the probability of default. It identifies the acquisitions carried out between 2006 and 2009.
TA
This variable is an approximation of the target’s size and refers to the total assets one year previous to the acquisition. Outliers are winsorized at the 99th and 1st percentile.
Leverage -1
This variable is calculated as debt over capital in the year previous to the acquisition. Outliers are winzorised at the 99th and 1st percentile.
Long term interest rates
The variable “LT” aims to capture the importance of the cost of debt at the time of the transaction. Long term interest rates were collected in relation to the target company for the year in which the acquisition took place.
Premium
This variable is employed as a measure of deal pricing. The premium paid over the target is calculated as the percentage difference between the price paid for the firm (deal value), as reported in Zephyr, and the total book value of the target company in the year before the transaction, calculated as the sum of total liabilities and equity77. Outliers are winsorized at the
99th and 1st percentile.
20 Industry
In order to control whether targets operating in specific industries behave differently, industry dummies were added into the regression. The industry for every target company is defined starting from the four-digit SIC code reported in Amadeus for each company. The industries considered are construction, finance, manufacturing, mining, retailing, services, transports, wholesale, public administration, and agriculture.
Table 4 (in Appendix) reports a detailed description of each variable and the sources.
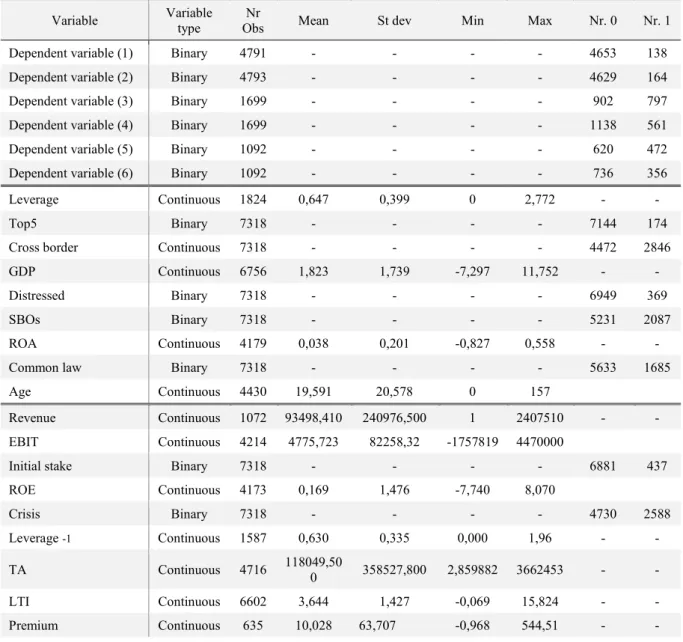
3.4 Summary statistics
Table 5 reports summary statistics for all the variables included in the regressions. The discrepancy in the number of observations is due to data availability. Indeed, the variables reflecting accounting data include considerably fewer observations than the others.
Moreover, a deal outcome could be determined only for a partial number of deals, ranging between 4793 in model II and 1092 in Models V and VI. Thus, six different subsamples are analyzed, one for each model.
Average leverage is 65%, which is lower than the 90% found for the 1980s deals, and the 70% for the second LBOs wave of 70%78, but still high enough to greatly impact the default risk of
the target firms. In addition, it is quite stable throughout the sample (66% for 2000-2009 buyouts and 64% for 2010-2015 buyouts).
The variable Age, indicates that an ample variety of companies is included in the sample. The age range between 0 and 157 shows that some firms are sold within the first year of inception. The mean of 20 years suggests that the majority are relatively older firms than start-ups. The same is underlined by the revenue which ranges between 1 and $2.4 Million.
The low average ROA of 3.8% can be explained by the fact that PE firms usually target companies that have margins for operational improvements as one of the main focus points of
21
PE activity is the efficiency improvement throughout the holding period. The average ROA 5 years after the transaction is, in fact, found to be 18%.
Cross border acquisitions account for 39% of the full sample, while 23% of the sample are acquisitions of UK companies.
Looking at the control variables, the mean premium is 10% which is relatively low. Remarkable is that without winsorizing the variable, the average premium is 121% showing that few bigger deals are present in the sample.
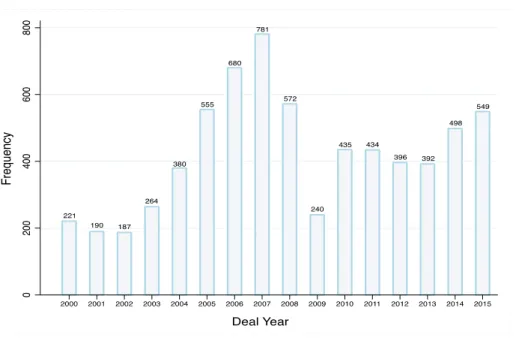
Figure 3 presents the number of deals in regard to the year, while Table 6 (in Appendix) shows the number of deals by country. Even if the database is not complete and fails to report many deals, it is still found to reflect the real situation as the United Kingdom is the country which
Table 5. Descriptive statistics for all the variables.
Variable Variable type Obs Nr Mean St dev Min Max Nr. 0 Nr. 1 Dependent variable (1) Binary 4791 - - - - 4653 138 Dependent variable (2) Binary 4793 - - - - 4629 164 Dependent variable (3) Binary 1699 - - - - 902 797 Dependent variable (4) Binary 1699 - - - - 1138 561 Dependent variable (5) Binary 1092 - - - - 620 472 Dependent variable (6) Binary 1092 - - - - 736 356 Leverage Continuous 1824 0,647 0,399 0 2,772 - - Top5 Binary 7318 - - - - 7144 174 Cross border Continuous 7318 - - - - 4472 2846 GDP Continuous 6756 1,823 1,739 -7,297 11,752 - - Distressed Binary 7318 - - - - 6949 369 SBOs Binary 7318 - - - - 5231 2087 ROA Continuous 4179 0,038 0,201 -0,827 0,558 - - Common law Binary 7318 - - - - 5633 1685 Age Continuous 4430 19,591 20,578 0 157
Revenue Continuous 1072 93498,410 240976,500 1 2407510 - - EBIT Continuous 4214 4775,723 82258,32 -1757819 4470000
Initial stake Binary 7318 - - - - 6881 437 ROE Continuous 4173 0,169 1,476 -7,740 8,070 Crisis Binary 7318 - - - - 4730 2588 Leverage -1 Continuous 1587 0,630 0,335 0,000 1,96 - - TA Continuous 4716 118049,500 358527,800 2,859882 3662453 - - LTI Continuous 6602 3,644 1,427 -0,069 15,824 - - Premium Continuous 635 10,028 63,707 -0,968 544,51 - -
22
presents more observations, followed by France and Germany79. Moreover, looking at
observations throughout the years it is easily identifiable the boom followed by the 2008 financial crisis.
Figure 3. Deals partition among years.
The industry of the target could be determined in 2930 deals. Figure 4 shows the industry’s frequency in the various industries, pointing out that almost 65% of the targets involved in the transaction are from either the manufacturing or services sector.
Figure 4. Targets partition among industries.
79 According to Thomson Reuters, between 2005 and 2015 the UK accounted for one third of PE deals
worldwide and one quarter of deal value across Europe.
Agricolture 0.41% Construction 2.25% Finance 7.30% Mining 0.82% Retail 8.67% Services 27.06% Transportation 11.47% Wholesale 4.30% Public Administration 1.16% Manufacturing 36.55%
23
4 Empirical Analysis
4.1 Methodology
The aim of the paper is to individuate the main factors that influence the probability of a firm’s default after the acquisition from a PE firm. In particular, the objective is to differentiate among three categories of factors: pre-buyout determinants of the target company, economic factors and the ones that capture specific characteristics of the PE deal. The analysis uses cross-sectional data with continuous and categorical predictors, while the dependent variable admits a binary outcome. In previous literature, logit and probit models are usually used to predict bankruptcy (Hauser and Booth, 201180; Ohlson ,198081; Burth et al. 201982). For the purpose
of this paper, a maximum likelihood logistic regression is employed, and the analysis of the odds is performed. Stata is employed to analyze the data.
The proposed regression, including all explanatory variables, is the following:
𝐷𝑒𝑓𝑎𝑢𝑙𝑡 = ∝ + 𝛽1𝐿𝑒𝑣𝑒𝑟𝑎𝑔𝑒 + 𝛽2𝑇𝑜𝑝5 + 𝛽3𝐶𝑜𝑚𝑚𝑜𝑛𝐿𝑎𝑤 + 𝛽4𝐶𝑟𝑜𝑠𝑠𝐵𝑜𝑟𝑑𝑒𝑟 + 𝛽5𝐺𝐷𝑃 + 𝛽6𝑅𝑂𝐴 + 𝛽7𝐷𝑒𝑎𝑙𝑇𝑦𝑝𝑒 + 𝛽1𝑇𝑎𝑟𝑔𝑒𝑡𝐴𝑔𝑒
4.2 Results
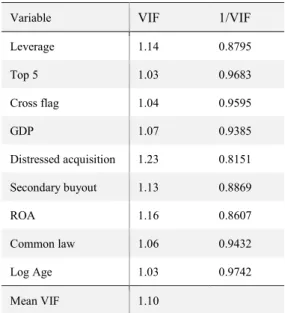
Table 7 presents six different models with the respective results. Each model includes one of the dependent variables previously defined. Multicollinearity among explanatory variables is tested through the variance inflation factor (VIF) reported in Table 8 in the Appendix, which shows how much the variance of the coefficient estimate is being inflated by multicollinearity, the correlation matrix between predictors and the condition indexes83. All the variables show
VIF values of less than 2.5 which is considered to be the maximum acceptable to claim absence of multicollinearity in the model84. The correlation matrix (showed in Table 9 in Appendix)
among predictors reports a correlation of 30% between the two deal categories “distressed” and “SBOs” and a correlation of 23% between leverage and the deal type “distressed”. However,
80 Hause, R. P. and Booth, D., 2011. “Predicting Bankruptcy with Robust Logistic Regression“, Journal od Data
Science, 9, 565-584.
81 Ohlson, J. A. 1980. “Financial ratios and the probabilistic prediction of bankruptcy“, Journal of Accounting
Research, 18, 109-131.
82 Burth, B. and Solveig R. 2019.
83 The approach is taken by Habshah, M. et al. (2013).
84 Allison, P. D. 1999. “Logistic Regression Using the SAS system: Theory and Applications“, Cary, NC: SAS Institute
24
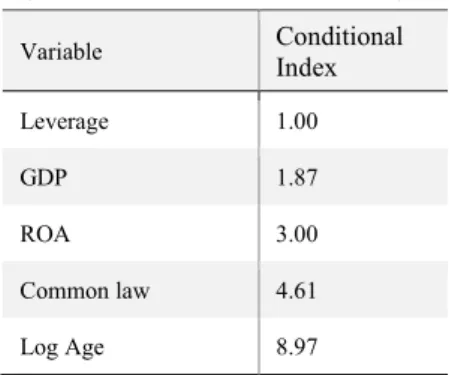
none of the correlation coefficients is higher than 0.8, which is considered the critical value to recognize multicollinearity85. Finally, the condition indexes (Table 10 in Appendix) are all
lower than 1586. OLS regressions are employed as robustness tests, confirming that the direction
and the significance of the variables are in line with the logistic regression ones (results for OLS are reported in Table 11 in Appendix).
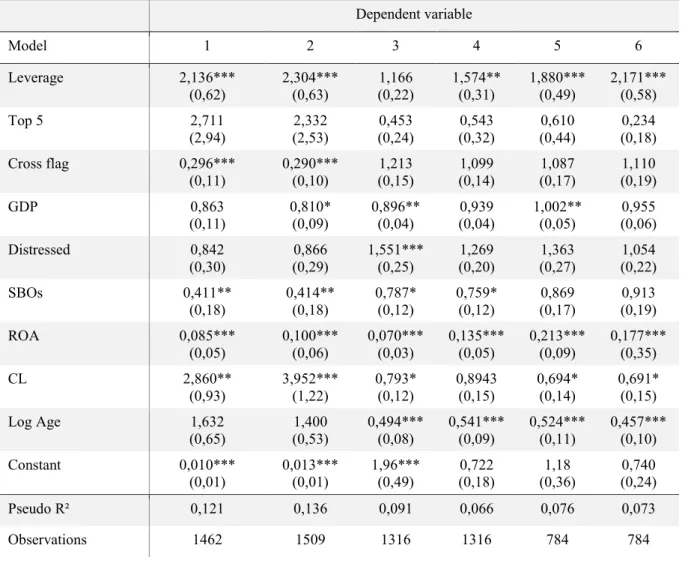
Table 7. Regressions results, using all explanatory variables. Logit regression
results reported as odds ratios.
Dependent variable Model 1 2 3 4 5 6 Leverage 2,136*** (0,62) 2,304*** (0,63) (0,22) 1,166 1,574** (0,31) 1,880*** (0,49) 2,171*** (0,58) Top 5 2,711 (2,94) (2,53) 2,332 (0,24) 0,453 (0,32) 0,543 (0,44) 0,610 (0,18) 0,234 Cross flag 0,296*** (0,11) 0,290*** (0,10) (0,15) 1,213 (0,14) 1,099 (0,17) 1,087 (0,19) 1,110 GDP 0,863 (0,11) 0,810* (0,09) 0,896** (0,04) (0,04) 0,939 1,002** (0,05) (0,06) 0,955 Distressed 0,842 (0,30) (0,29) 0,866 1,551*** (0,25) (0,20) 1,269 (0,27) 1,363 (0,22) 1,054 SBOs 0,411** (0,18) 0,414** (0,18) 0,787* (0,12) 0,759* (0,12) (0,17) 0,869 (0,19) 0,913 ROA 0,085*** (0,05) 0,100*** (0,06) 0,070*** (0,03) 0,135*** (0,05) 0,213*** (0,09) 0,177*** (0,35) CL 2,860** (0,93) 3,952*** (1,22) 0,793* (0,12) 0,8943 (0,15) 0,694* (0,14) 0,691* (0,15) Log Age 1,632 (0,65) 1,400 (0,53) 0,494*** (0,08) 0,541*** (0,09) 0,524*** (0,11) 0,457*** (0,10) Constant 0,010*** (0,01) 0,013*** (0,01) 1,96*** (0,49) 0,722 (0,18) 1,18 (0,36) 0,740 (0,24) Pseudo R² 0,121 0,136 0,091 0,066 0,076 0,073 Observations 1462 1509 1316 1316 784 784 notes:
*Statistically significant at the 10 per cent level. **Statistically significant at the 5 per cent level. ***Statistically significant at the 1 per cent level.
As expected, most of the deals have a positive outcome and the default rate is very low. Considering models I and II, which rely on larger samples, the default rate ranges between
85 Habshah, M. Sarkar, S. K. and Rana, S. 2013.
25
2,88% and 3.42% for the analyzed period (on average 0.2% annually). This is lower than the global speculative-grade default rate, of 4.20% on average, between 2000 and 2015. Taking into account the crisis period only, the average default rate between 2007 and 2010 increases to 0.8% annually, which is still lower than the average default rate of 1.88% for the same period87.
The first two models are believed to better capture the reality as the other four are possibly biased. Firstly, if a PE firm exited the investment before the set periods of three and five years considered, there would be the influence of a subsequent owner. Secondly, the target could take longer periods to default, as sometimes the acquisitions are kept in the portfolio even for 10 years. For example, Blackstone, one of the biggest PE firm in the world, acquired the famous Hilton Hotel chain in 2007 and sold it through an IPO in 2018 gaining $14 billion after 11 years. Hence, the default rates for the analyzed samples could be biased both downward and upward. For this reason, the models that rely on the ROA cut-off points are mainly utilized to confirm the findings of models I and II.
The results of the statistical significance show that some of the independent variables are not statistically significant. Furthermore, some variables change the significance according to the model.
4.2 Adding extra explanatory variables
The introduction of more explanatory variables in the model is a recurring strategy used in literature to verify the robustness of the estimations. The aim is to control for other factors suspected to affect the dependent variable.
In Table 12, 13, 14, 15, 16 and 17 (in Appendix) the models are tested adding several instrumental variables. Every table refers to one of the six different models showed in Table 5. Regression I reports the results obtained including only the explanatory variables. Control variables that reflect accounting data are included one by one due to the strong correlation among them. Regression II includes Revenue while regression III includes EBIT. Regression
87 Data for default’s rates are taken from Moody’s, 2016. “Annual Global Corporate Default Study And Rating
26
IV substitutes ROA with ROE to test whether a different efficiency ratio has the same impact. Regression V includes the variable TA. In Regression VI the binary variables Crisis and Initial stake are included. In regression VII leverage level before the transaction is included while the deal type “Distressed” is excluded as they would capture the same information. Since the literature finds correlation among leverage, interest rates and premium paid for the target, these two variables were not included in the original models as to not influence the variable Leverage, and are added as control variables in regressions VIII and IX. Finally, regressions X and XI control for years and countries fixed effects.
The continuous variable Leverage is highly statistically significant in five of the studied models. The odds ratios indicate that, holding all the other variables at a fixed value, for a unit increase in leverage the odds of default increase by between 57% and 117%. The results hold in all the models in which leverage is found significant, and also when adding most of the control variables. Exceptions are observed when including Revenue or industry fixed effect, but this can be explained by the considerable reduction in sample size in these two regressions. Hence, hypothesis 1 is confirmed. This means that the debt taken on for the purpose of the acquisition has a great impact on the probability of default and that PE firms are occasionally leveraging their targets with an unsustainable level of debt. At the same time, several studies88 argue that
firms with greater increases in leverage have, in the end, higher cash flows, operating gains and hence better returns. This means that the amount of debt should be carefully chosen, as it increases returns up to a certain level, while it could lead to the target’s default beyond that point.
A relation between interest rates, leverage and premium paid is pointed out by many studies. Therefore, when adding the variable LTI in regression VIII, it was expected that lower interest rates would increase the probability of default, being drivers of higher leverage and hence higher default probability. However, the results suggest a different conclusion. Interests rates are found to be significant only when including them in the first model (Table 12, regression VIII): for one unit increase in interest rates, the odds of default increase by 18%. Since interest rates are observed in the acquisition year, they are a proxy of the cost of debt employed in the acquisition. Hence, this finding suggests that the higher the interests paid on the debt the higher the probability of default. However, in the other five models the interest rates are not significant, and this could also be caused by a possible correlation between this variable and leverage.