Master’s Thesis
Mergers & Acquisitions
BlackBerry’s Acquisition by Samsung
José Diogo Leal Carmelino
152113338Advisors
Prof. Dr. António Borges de Assunção
Dr. Henrique Bonfim
Dissertation submitted in partial fulfillment of requirements for the degree of MSc in Business Administration, at the Católica Lisbon School of Business & Economics
Abstract
The main purpose of this dissertation is to study a recent market rumor about BlackBerry’s acquisition by the rival company Samsung and whether this deal would be good for both parties. The main goal is not only to understand if they will have a higher value together but also to understand how this Merger & Acquisition (M&A) deal would affect the entire industry.
In a recent past, Samsung was discussing with Apple the leadership of the market. They had big judicial fights related with patent’s issues and Samsung was fined in millions of dollars. Moreover, a few years ago BlackBerry was one of the market leaders mainly due to the features they offered to executive clients, which were very exclusive and that made them leaders in the corporate segment. They also have a valuable portfolio with more than forty four thousand patents. Therefore, this deal looks like a perfect “marriage” between the two giants in an industry that is very aggressive regarding competition, requiring huge investments and where every detail counts.
In the end I present a confrontation between the acquisition scenario that was rumored by the press in past January, and the actual scenario of partnerships taking place between Samsung and BlackBerry.
Acknowledgments
I am very grateful for the chance that Católica-Lisbon gave me of studying Mergers and Acquisitions, a subject which is very interesting to me. This thesis gave me a new perspective on Finance and allowed me to profound my knowledge in this specific area. I want to start by expressing my most sincere gratitude to my parents, José Rodrigues Carmelino and Maria Adelaide Carmelino for all the support, advices and motivational words they had to me during this long journey that was my education. They always believed in me and gave the strengths and tools that I needed to grow as a man and as professional, which will start his career soon. They gave me the unique opportunity of doing my Undergraduate Degree and my Master Degree in Católica-Lisbon. These five amazing years at this special University gave me the chance to meet unique and very interesting people and culminated with doing this dissertation. I also want to thank to my beloved sister, Eunice Carmelino, which gave me a lot of support while I was doing my path in this thesis semester.
Furthermore, I have a special thank to my beautiful girlfriend, Renata do Espírito Santo Barbosa for all the help, patience and encouraging words she had to me every time I was struggling. Her feedback and unconditional support were very important.
Third, I want to express my profound gratitude and respect to my supervisors António Borges de Assunção and Henrique Bonfim. Thank you Professor António Borges de Assunção by let me making part of your dissertation seminars and by encouraging me following the theme I have presented to you in the first seminar class. Your motivational speech was crucial in the beginning of my dissertation. I also want to say thank you Dr. Henrique Bonfim for your continuous support and guidance during the last six months. All the patience, motivational words, share of knowledge and constructive advices led me to do a better dissertation, helping me to overcome mishaps, deadlocks and dead-ends that appeared in my path. I could not be more grateful to both of you.
Fourth, a necessary thank to Rita, Elizabete, Alexandra, Salvador and Gonçalo from Novo Banco, for all the knowledge, guidance and support they gave me during my internship. They introduced me to investment banking, giving me a completely new perspective about it, and it was a very rewarding experience.
Finally, I have reserved a special thank to Diogo Nascimento, my University best friend, and to João Carlos, also my best friend which was my colleague at school a long time ago and grew with me since my childhood. They are not just friends, they are like brothers to me. They were always by my side in almost every problem I had in my life. Another thank to all my University friends that helped me completing this journey and also to my colleagues from the Mergers and Acquisitions seminar.
Index
1 – Introduction ... 1 1.1. - Literature Review ... 1 1.1.1. – Methodology ... 7 1.2. – Industry Overview ... 10 1.3. – Samsung Overview ... 11 1.4. – BlackBerry Overview ... 13 1.5. – Deal Rationale ... 15 2 – Valuation ... 17 2.1. – Samsung Valuation ... 17 2.1.1. – Financial Projections ... 17 2.1.2. - Dupont Analysis ... 21 2.1.3. – DCF Model ... 24 2.1.4. – Multiples Valuation ... 282.1.5. – Samsung’s Valuation Range ... 30
2.2. – BlackBerry Valuation ... 32
2.2.1. – Financial Projections ... 32
2.2.2. - Dupont Analysis ... 36
2.2.3. – DCF Model ... 37
2.2.4. – Multiples Valuation ... 41
2.2.5. – BlackBerry’s Valuation Range ... 43
2.3. – Synergies ... 44
2.3.1. – Combined Firm without Synergies ... 45
2.3.2. – Combined Firm with Financial Synergies – Effect of Tax Shields ... 47
2.3.3. – Combined Firm with Synergies: Financial & Operating ... 49
3 – Conclusion ... 53
Annexes ... 56
Exhibits 1 – Samsung ... 56
Exhibit 1.1. – Macroeconomic Scenario ... 56
Exhibit 1.2. – Samsung’s Forecast Ratios of Balance Sheet ... 57
Exhibit 1.3. – Samsung’s Balance Sheet ... 57
Exhibit 1.4. – DCF Sensitivity Analysis ... 58
Exhibit 1.5. – Market Multiples Sensitivity Analysis ... 59
Exhibits 2 - BlackBerry ... 60
Exhibit 2.1. – Macroeconomic Scenario ... 60
Exhibit 2.2. – BlackBerry’s Forecast Ratios of Balance Sheet ... 61
Exhibit 2.3. – BlackBerry’s Balance Sheet ... 61
Exhibit 2.4. – DCF Sensitivity Analysis ... 62
Exhibit 2.5. – Market Multiples Sensitivity Analysis ... 63
Exhibits 3 – Combined Firm without Synergies ... 64
Exhibit 3.1. – Net Working Capital ... 64
Exhibit 3.2. – Capital Expenditures ... 64
Exhibit 3.3. – NOPLAT and EBIT ... 64
Exhibit 3.4. – FCFF Combined Firm ... 64
Exhibit 3.5. – Equity Beta ... 65
Exhibit 3.6. – Capital Structure ... 65
Exhibit 3.7. – WACC ... 65
Exhibits 4 – Combined Firm with Financial Synergies–Effect of Tax Shields ... 66
Exhibit 4.1. – Income Statement ... 66
Exhibit 4.2. – Balance Sheet ... 66
Exhibit 4.3. – Net Working Capital ... 67
Exhibit 4.5. – NOPLAT and EBIT ... 67
Exhibit 4.6. – FCFF Combined Firm ... 67
Exhibit 4.7. – Equity Beta ... 68
Exhibit 4.8. – Capital Structure ... 68
Exhibit 4.9. – WACC ... 68
Exhibits 5 – Synergies: Financial & Operating – Bearish Scenario ... 69
Exhibit 5.1. – Income Statement ... 69
Exhibit 5.2. – Balance Sheet ... 69
Exhibit 5.3. – Net Working Capital ... 70
Exhibit 5.4. – Capital Expenditures ... 70
Exhibit 5.5. – NOPLAT and EBIT ... 70
Exhibit 5.6. – FCFF Combined Firm ... 70
Exhibit 5.7. – Equity Beta ... 71
Exhibit 5.8. – Capital Structure ... 71
Exhibit 5.9. – WACC ... 71
Exhibits 6 – Synergies: Financial & Operating – Bullish Scenario ... 72
Exhibit 6.1. – Income Statement ... 72
Exhibit 6.2. – Balance Sheet ... 72
Exhibit 6.3. – Net Working Capital ... 73
Exhibit 6.4. – Capital Expenditures ... 73
Exhibit 6.5. – NOPLAT and EBIT ... 73
Exhibit 6.6. – FCFF Combined Firm ... 73
Exhibit 6.7. – Equity Beta ... 74
Exhibit 6.8. – Capital Structure ... 74
Exhibit 6.9. – WACC ... 74
Exhibits 7 – Articles About the Deal ... 75
Exhibit 7.2. – CNBC Article – I ... 77
Exhibit 7.3. – Fierce Wireless Article ... 78
Exhibit 7.4. – BlackBerry Announcement... 79
Exhibit 7.5. – The Wall Street Journal Article ... 80
Exhibit 7.6. – Forbes Magazine Article ... 81
Exhibit 7.7. – Tech Radar Article ... 82
Exhibit 7.8. – CNBC Article – II ... 85
Exhibit 8 - Data ... 86
1
1 – Introduction
The main purpose of this dissertation is to study a recent market rumor about BlackBerry’s acquisition by the rival company Samsung and whether this deal would be good for both parties. In order to assess the viability of the deal I will use specific techniques and methods to do the valuation of both companies separately and afterwards to estimate the synergies that they would create together. The main goal is not only to understand if they will have a higher value together but also to understand how this Merger & Acquisition (M&A) deal would affect the entire industry.
1.1. - Literature Review
While preparing such a complex study like the one it is being done in this dissertation is extremely important to understand all the specificities that are behind M&A operations. For that reason it is crucial to fully understand the outlines of the operation and that every single detail can change depending on the type of companies that are involved in the deal. Therefore, in this section I will address the following issues: (1) Benefits from an acquisition deal; (2) Which are the appropriate valuation methods to compute the fair value of each company, the value of the synergies and the fair value of the new company that will emerge after the operation; (3) Which are the issues we should be specially concerned when approaching the synergies calculation and what are the differences between a synergy and a control premium; (4) What issues and specificities should we care about when analyzing a cross-border deal; (5) What is the method of payment that should be used in this deal.
According to Cloodt, M., Hagedoorn, J. and Kranenburg, Hans V. (2006), many companies continue looking to M&A as a popular and well succeeded strategy of growth. They also say in their study that it is possible to measure the innovative performance of a company in any high-tech sector through the same indicator, patents. They argue that patents have a huge importance when doing this analysis in this industry. The authors continue saying that “the acquisition of related knowledge provides opportunities for economies of scale and scope”.
2 Furthermore, in their study, Blonigen, Bruce A. and Taylor, Christopher T. (2000) argue that their results “show a strong negative correlation between R&D intensity and acquisition activity”. This means that firms in the high-tech industry which spend less money in R&D are more likely to go for an acquisition deal in order to increase the internal knowledge of the firm.
Luehrman, Timothy A. (1997) said in his publication that in order to do an accurate valuation, one should consider three different segments in firm’s business: (1) Operations; (2) Opportunities; (3) Ownership claims. Each one of these segments will be valued with different methods and different tools.
To value the operations of an ongoing business, the most accurate model is the Adjusted Present Value. The author explains that this model is much more trustful than simply using the basic DCF-WACC model and allows a much more deeper analysis because this way we are able to scrutinize which part of the business is valuable and which one is worthless instead of just know if the whole business is generating value. In my opinion, there is a sentence in his paper which completely demonstrates this: “APV helps when you want to know more than merely, Is NPV greater than zero? Because the basic idea behind APV is value additivity, you can use it to break a problem into pieces that make managerial sense. Consider an acquisition. Even after the deal has closed, it helps to know how much value is being created by cost reductions rather than operating synergies, new growth, or tax savings”.
To Value opportunities, which are basically possible future operations and intangible assets, we should approach valuation with a different method. The author explains that we should use the option-pricing theory to approach the valuation of business opportunities and says that Black-Scholes is his favorite one.
In order to estimate the value of ownership claims, i.e. claims that companies issue against the value of their operations and opportunities, one should use the Equity Cash Flow (ECF) model. “It is a DCF methodology, but both the cash flows and the discount rate are different from those used either in APV or the WACC-based approach.
The main and stronger driving force that often justifies the interest in a merger or acquisition is the creation of synergies mixing the expertise of both companies in one single venture, i.e. the value and performance of two companies combined will be
3 higher than the sum of the separate individual parts due to the opportunities created that would not be available if the firms operate independently. Nevertheless, in his study Damodaran, A. (2005) alerts us to the problem of frequently overestimate synergies. The same author affirms that there are two types of synergies: the operating synergies and the financial synergies. The operating synergies allow firms to increase their operating income through four main ways: (1) Economies of scale – “combined firm is more cost-efficient and profitable”; (2) Greater pricing power – “reduced competition and higher market share, which should result in higher margins and operating income”; (3) Combination of different functional strengths – “functional strengths can be transferable across businesses”; (4) Higher Growth in new or existing markets. In the other hand, the financial synergies allow firms to achieve higher cash-flows and a lower cost of capital through: (1) “A combination of a firm with excess cash and a firm with high-return projects”; (2) Increase in debt capacity – “when two firms combine, their earnings and cash flows may become more stable and predictable”; (3) Tax benefits – “a profitable firm that acquires a money-losing firm may be able to use the net operating losses of the latter to reduce its tax burden”; (4) Diversification – “For private firms businesses or closely held firms, there can be potential benefits from diversification”. Something which Samsung should consider when analyzing the viability of BlackBerry’s acquisition is whether they are reasonably estimating the value of the synergies. As explained by Sirower, Mark L. (2006) in his publication, the market reveals skepticism when comesout the announcement of a M&A deal and historically we can even see a trend of drops in the stock price of the acquiring firms after these announcements. Thereby it means short-term value destruction for the shareholders of the acquiring firm, which should be compensated in the long-term with valuable synergies. According to the author, one of the reasons that explain this market’s skepticism is the fact that acquisitions “require full payment upfront” and therefore any postponement in the promised synergies will massively affect the expected net present value of the investment. Furthermore the author also explains that “there is almost always a financial cost associated with achieving” the revenue or cost synergies. Last but not least, once a merger or acquisition takes place and the integration activities are done, it is really costly to unwind an operation which goes wrong. Thus, it is suggested in his study that managers should complement their valuations with a risk-management approach.
4 Samsung should also analyze the risk associated with a Cross-Border deal. In fact, the last decade we see impressive numbers regarding cross-border M&A operations, which are favored by the integration of the global markets of goods and services, capital and labor. According to Zenner, M., Matthews, M. and Marks, J. (2008), the companies of leading developed markets are currently looking to emerging markets as an opportunity to grow. Furthermore, these market movements brought cyclical effects. Looking to the North American market, we conclude that the acceleration of this trend, which was driven by the most recent financial crisis, resulted in “reduced domestic competition, a falling U.S. dollar, high relative valuations of foreign companies, and the rise of sovereign wealth funds”. The authors say more: “In particular, emerging-market corporate acquirers today have valuations that are high relative to both those of their developed-market peers and to their own historical valuations. And the effect of this shift in relative valuations has been accentuated by the weakness of the U.S. dollar against many currencies”. So, the author concludes that taken together, these two facts have made U.S. assets inexpensive from the perspective of foreign companies, but even more inexpensive for corporate buyers from emerging markets.
Zenner et all (2008) also comment that when doing a cross-border deal valuation, we should adjust the metrics of the standard valuation methods for tax, accounting, and risk differences among jurisdictions. For example, the biggest concern one might have with the multiples valuation is related to “the comparability of earnings, EBITDA, and cash flows across different accounting and tax systems”. In the other hand, the DCF valuation is more adjustable and has into account tax and accounting differences. The main difficulty with this method is to estimate the future cash flows and an appropriate risk-adjusted discount rate in cross-border transactions. Thus, one should check if “there is a country-specific equity risk premium and whether (and how) to make an adjustment for sovereign risk”.
Finally, it is important to make a reflection about the method of payment that will be used in this deal by Samsung. Rappaport, A., Sirower, M. (1999) explains in their paper the main distinction between cash and stock transactions. They argue that in cash transactions, “acquiring shareholders take on the entire risk that the expected synergy value embedded in the acquisition premium will not materialize”. In the other hand, in stock transactions, “that risk is shared with selling shareholders”. More accurately, in
5 stock transactions, “the synergy risk is shared in proportion to the percentage of the combined company the acquiring and selling shareholders each will own”.
Travlos, N. (1987) concluded that in mergers the method of payment is usually common stock exchange offers and in that acquisitions are usually cash offers. Once there are different signaling implications related to different methods of financing a project, they conclude that different stock returns of bidders in mergers and acquisitions may arise from the method of financing used. Their results show that acquiring companies have “significant losses in pure stock exchange acquisitions, but they experience "normal" returns in cash offers”.
According to Harris and Raviv (1988) and Stulz (1988), managers of acquiring companies who value control prefers to pay the transaction in cash to avoid a future ownership dilution and the possibility of lose control. Amihud, Lev, and Travlos (1990) suggest the same in their study. A Furthermore, Martin (1996) says that the target and acquiring dimension, as well as their investment opportunities, have influence in the method of payment chosen. Ghosh, A. and Ruland, W. (1998) state that target firms’ managers who have large percentages of shares in their firms usually value voting influence in the combined firms after acquisitions, thus they prefer to receive stock in exchange for their ownership interest.
Ismail, A. and Krause,A. (2010) explain that usually target company’s shareholders prefer to receive “a cash payment rather than shares of the bidding company”. Empirical evidence also shows “a significantly higher announcement return to the shares of the target company for cash offers than for share offers”. Hazelkorn, T., Zenner, M. and Shivdasani, A. (2004) agree with the previous authors saying the market reaction was more favorable for cash-financed transactions than for stock-financed transactions. Evidence showed that “cash transactions had a median short-term excess return of 0.9% compared to –1.9% for stock transactions”.
Myers and Majluf (1984) argue that “the asymmetry of information between the bidder and the target on the value of the bidder shares allows the bidder to offer shares if these are overvalued and to offer cash if they are undervalued”.
Ismail, A. and Krause,A. (2010) also say that another reason to consider when choosing the method of payment is the influence of taxation. If bidder pays in cash the target
6 shareholders are frequently taxed on the profits they have made. For this reason they would require a higher premium. In addition, the bidder can accumulate a higher goodwill. Its depreciation will reduce future profits and tax burdens, as a result.
7 1.1.1. – Methodology
In order to value the operation that is being studied in this dissertation I have used some popular methods that are usually used by M&A’s analysts to value a transaction. So, to reach a final valuation of the deal I followed three main steps: (1) Valuation of each company separately; (2) Valuation of the combined firm after the acquisition have occurred; (3) Estimation of the synergies’ value of the combined firm and finally reach the firm’s value including the synergies.
In order to do the first step of my analysis I needed to use two models: DCF model and the Multiples valuation1.
1.1.1.1. – DCF Model
The Discounted Cash Flow model tries to fairly estimate the value of a company today, based on projections of how much money it's going to make in the future. DCF analysis says that a company is worth all of the cash that could make available to investors in the future. So, the purpose to use this valuation method is to see whether the fair value of the company is higher or lower than its market value.
Once we have the historical data we should compute some financial ratios (ROIC, Asset Turnover, D/E, ROE, Days of Sales Outstanding, Dividend Payout Ratio, Interest Coverage, Growth Rate of Sales/Cash-Flows and others) in order to understand the working capital needs of the company, its profitability, the leverage level or the ability to pay interests. Furthermore, we should compute company’s profit margin, dividing the profit (or loss) by the sales, to understand the cost relationships (variable or fixe costs). Then, to predict the revenues and costs that the company will have in the future, as well as the future cash-flows of the firm, I had firstly to compute the company’s growth rate. In order to do it I have made an average of the ROIC and Reinvestment Rate (RR) of the company in the last years. So, I could compute the growth rate as follows (assuming no changes in D/E):
After computing the revenues and costs that the company will obtain in the future, I used the following formula to compute the Free Cash Flow to the Firm:
1
The description of the DCF and Multiples Valuation models were based on the well known finance website Investopedia.
8
Once I projected the company's free cash flow for the following five years, the next step was to estimate what these cash flows were worth “today”. So, I had to come up with an appropriate discount rate to compute the net present value (NPV) of the cash flows. The most common discount rate is the weighted average cost of capital (WACC), which is basically a mix of the cost of equity and the after-tax cost of debt.
In order to predict what it costs the firm to preserve a share price that is satisfactory to investors we should calculate the cost of equity. We can compute the cost of equity (Re) as follows, using the capital asset pricing model (CAPM):
Note:
1. Rf - Risk-Free Rate - This is the amount an investor can obtain from investing in securities considered free from credit risk, such as government bonds from developed countries.
2. ß - Beta - It measures how much the share price of a company moves against the market as a whole. A beta of one indicates that the company moves in line with the market.
3. - The equity market risk premium represents the returns investors expect, over and above the risk-free rate, to compensate them for taking extra risk by investing in the stock market.
The cost of debt (Rd) is the market interest rate the company is paying on its debt. As a company benefits from the tax deductions available on the interest paid, the net cost of the debt is actually the interest paid less the tax savings resulting from the tax deductible interest payment. So, the after-tax cost of debt is .
Finally, the WACC is based on the proportion of debt and equity in the company's capital structure. So, the WACC is represented by the following formula:
9
Once I estimated the firm’s free cash flows for the next five years, I needed to come up with a logical idea of the value of the company's cash flows after that period (like perpetuity). This value is the Terminal Value (TV) and in order to compute it I picked the FCFF of the fifth year and used the following formula:
Finally, to reach the Enterprise Value (EV) we should do the NPV of the FCFF and the TV as follows:
1.1.1.2. - Multiples Valuation Method
Doing valuation using multiples or relative valuation is a method of estimating the value of an asset by comparing it to the values assessed by the market for similar or comparable assets/companies. This is why it is important to identify a peer group composed by companies in the same industry, region and similar financial situation of the company we are analyzing. The Multiples that I used are the following:
1) 2)
3)
When using this valuation method I used the future figures to estimate the value of the company (ex: Forward PER, where I used the earnings over the next twelve months).
10
1.2. – Industry Overview
According to a CCS Insight2 report, the global Smartphone industry had an extraordinary growth in recent past. Shipments increased by 40 % in 2013 and exceeded the 1 billion unit threshold and 266 billion dollars in value. CCS Insight is forecasting that Smartphone shipments will reach 1.89 billion units by 2018. In this report CCS Insight highlights three suggestions that can make a company successful in this industry in the next four years: (1) A broader business model; (2) A complementary business that reinforces the profit margin made on hardware; (3) Reinforce economies of scale, improve the supply chain and reduce costs to enable a profit competition.
They also highlight in the report the importance of the intellectual property in this business. It is nowadays a critical component for success in the global Smartphone market. For example, Samsung’s Android “has a high economic cost connected with patent licensing, so a broad portfolio of intellectual property can help reduce the bill of materials and increase margins, in addition to constituting a revenue source in its own right”.
As we can see in the Illustration 1 below, the majority of the companies in the sector, with the exception of Apple and Samsung, are facing very low operating profits, what shows the high competitiveness of the industry.
Illustration 1 - Global Smartphone Industry’s Operating Profit
Source: CCS Insight
Finally, the Illustration 2 and the Illustration 3 below show us two interesting facts. Samsung is by far the market leader in volume of units sold, with 24.3 % of the market, but on the other hand they are dividing the market leadership with Apple, having into
2
CCS Insight is a North American company which provides market information, analysis and intelligence to its clients.
11 account the total revenues. Regarding operating margin, Apple is by far the leader with 28.4 % against the 18 % of Samsung.
Illustration 2 – Global Smartphone Industry’s Market Share, Revenues and Operating Profit
Source: CCS Insight
Furthermore, the Illustration 3 shows that Android is the operating system most used, with a market share of 79 % in 2013 and a growth of 57 % in the end of the year. On the other hand, BlackBerry is losing market share to its competitors and had a decrease of 42 % in 2013. It clearly shows that BlackBerry is facing serious difficulties to follow its peers in terms of market share, so something has to be done to invert the situation.
Illustration 3 – Smartphone Operating System’s Market Share
Source: CCS Insight
1.3. – Samsung Overview
Samsung Electronics Co., Ltd. is a South Korean technology company which produces a wide range of consumer and industrial electronic equipment and products such as semiconductors, personal computers, peripherals, monitors, televisions, home appliances (as air conditioners and microwave ovens), internet access network systems and telecommunications equipment (including mobile phones).
The company has a strong focus on innovation and R&D, what provides them a competitive advantage by enabling Samsung to launch products that effectively enhance revenues and market share. However, during the last years Samsung had several patent
12 litigations, which made them spend a lot of money in courts and fines. Furthermore, it is known that although the company is one of the largest players in the Smartphone market, it is almost completely dependent on Google’s Android platform. For this reason, it is extremely important for Samsung to invest in the development of new software with more capabilities.
As we can see in the Graph 1 below, 53% of Samsung revenues are coming from the non-Asian market, which proves the exposure faced by the company to other markets and a potential vulnerability concerning the geopolitical risks. So, one way Samsung has to address country risk and operating risk maybe investing in other markets.
Graph 1 Graph 2 30% 23% 19% 18% 10%
Samsung Revenues by Region 2014
America Europe Asia China South Korea
54% 20%
14% 12%
Samsung Revenues by Segment 2014
Telecommunication Equipment Digital Media Equipment
13 As we can see in the Graph 2 above, the segment of the firm which contributes most to its revenues is the Telecommunication Equipment. It shows the strong commitment of the firm in becoming the market leader in this segment.
Through the Graph 3 below we can understand that Samsung’s revenues were constantly increasing in the last five years. However, even knowing that the EBITDA and the Net Profit were also increasing in these five years and also knowing the low operating profit of the overall industry (as shown in the previous section Samsung is doing well comparing to the industry), I am convinced the company has the conditions to improve it.
Graph 3
1.4. – BlackBerry Overview
BlackBerry Limited is a Canadian technology company which designs, manufactures and markets wireless solutions for the worldwide mobile communications market. BlackBerry provides platforms and solutions for access to email, phone, SMS messaging, Internet, and Intranet-based applications.
The company has historically focused on corporate segment which has won the company a market-leading role in the enterprise market. The functionality, security and reliability offered by BlackBerry to its customers have enabled the company to become the leader in the enterprise niche. Furthermore, the company has a strong focus on product design, engineering and R&D which means they have a huge value in intellectual property. 0.00 50,000.00 100,000.00 150,000.00 200,000.00 250,000.00 2010 2011 2012 2013 2014
Samsung Highlights
14 As we can see in the Graph 4 below, BlackBerry has relevant revenues in almost every continent, which shows high geographic distribution.
Graph 4
Graph 5
In the Graph 5 above we can see that the segment which contributes most to the company’s revenues is the hardware. Although the 3 % that appear on the graph, BlackBerry develops new Software and invests a lot of money in R&D, however they sell their Software integrated in their Hardware and for this reason it is not accounted as Software.
The Graph 6 below clearly shows that BlackBerry’s results are decreasing a lot since 2012 and it became even worst in the end of 2014 when they had negative operating income and negative net income.
11% 20% 14% 19% 30% 6%
BlackBerry Revenues by Region 2014
United Kingdom United States Asia Pacific Latin America Other Canada
60% 35%
3% 2%
BlackBerry Revenues by Segment 2014
15
Graph 6
1.5. – Deal Rationale
In this market rumor we are facing the possibility to see a deal between two of the biggest players of this industry. In a recent past, Samsung was discussing with Apple the leadership of the market. They had big judicial fights related with patent’s issues and Samsung was fined in millions of dollars. Additionally, Samsung had an unexpected drop in their sales because the clients apparently didn’t like the last Samsung Galaxy version, the Galaxy 5.
Moreover, a few years ago, before the touch screen mobile phones boom, BlackBerry was one of the market leaders mainly due to the features they offered to executive clients, which were very exclusive and that made them leaders in the corporate segment. They also have a portfolio with more than forty four thousand patents (With a net book value of 1.43 billion USD, according to Reuters’ analysts. See exhibit 7.1.), which could be a very attractive asset for Samsung in their fight for the “first place”. Therefore, this deal looks like a perfect “marriage” between the two giants in an industry that is very aggressive regarding competition, requiring huge investments and where every detail counts.
There were different periods with different characteristics in the M&A history. Most recently (after 2010) have started the big acquisitions in the high-tech industry, where the big players with a considerable amount of free cash to invest, pay billions of dollars for startups. These startups usually come to the market with completely innovative ideas and new software programs which they expect to become very popular. Moreover, the
-5,000.00 0.00 5,000.00 10,000.00 15,000.00 20,000.00 25,000.00 2010 2011 2012 2013 2014
BlackBerry Highlights
16 experts are saying that the bidders aren’t necessarily looking to the target companies’ hard assets. Nowadays they can be also interested in acquiring the thoughts, methodologies, people and relationships existent in these target companies. There is a trend in which large companies such as Google, Yahoo! or Microsoft are choosing to acquire startups instead of hiring new recruits. These companies are essentially purchasing their targets because of their intangible assets. It is exactly what I have suggested above regarding the Samsung-BlackBerry deal, once one of the most appealing assets of BlackBerry is precisely the intellectual property, patents and know-how that can be missing to Samsung.
For all these reasons, it is clear the strong motivation which is behind this deal and that can beneficiate both firms. Acquiring BlackBerry, Samsung may have the capacity to increase revenues and consequentially to increase its market share. This is something that Samsung is looking for a long time but Apple is providing a staunch dispute. We have also to consider the economies of scope that this operation will bring to Samsung through the diversification of their products. Another advantage that they can achieve is the reduction of costs which is inherent to the production process.
17
2 – Valuation
2.1. – Samsung Valuation
2.1.1. – Financial Projections
In order to estimate the valuation of a company we should start by forecast its financial statements in the following years. The forecast should be at least five years (I chose six years once I was also analyzing the last six years and also because the financial results of the company were already stable), a period long enough for the company to reach a steady state, i.e. the company grows at a constant rate by reinvesting a constant proportion of its operating profits into the business each year and the company earns a constant rate of return on both existing capital and new capital invested. It will make us understand the evolution pattern of the company in the near future, i.e. its expected performance. So, to do the financial projections and the required analysis we should also consider the recent management decisions of the company, regarding sales strategy, cost structure, investment in fixed assets, among others.
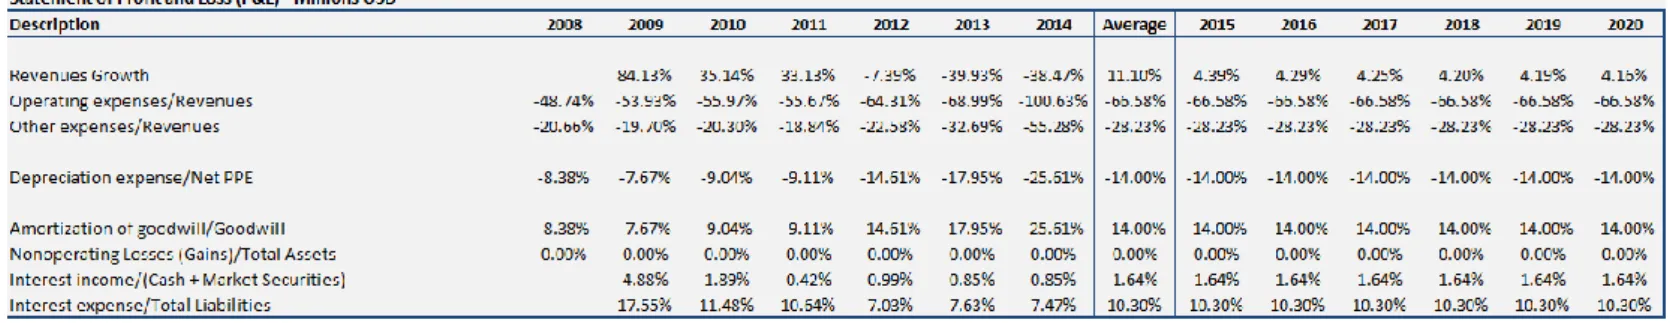
Therefore, the first step should be to focus on how to forecast long-run value drivers that would be consistent with firm’s historical evidence and also the economic theory. Thus, to forecast the Income Statement I had to project each individual line item using three major steps: (1) I had to define an economic relationship driver to each line such as the revenues, a particular asset or a liability; (2) This economic relationships were translated to forecast ratios. So, I have done the historical values to these ratios and ultimately I have made the historical average of each ratio. In most of the cases, I considered the historical average as the forecast ratio for the following years; (3) I multiplied the forecast ratio by its driver. This process resulted in a table as follows:
18 For example, as you can see in the table 1 presented above I am considering that the Interest Income depends on the future evolution of the Cash & Market Securities. Furthermore, as we can see in the exhibit 1.2, Forecast Ratios of Balance Sheet, the Cash and the Market Securities are dependent on the Revenues, which were one of the most important drivers in this forecast. The case of the Revenues is different once I had to predict its own growth and it is not dependent on other items. Its growth was computed through a weighted average: 0% is the historical growth’s average (Exhibit 1.1) and 100% is the South Korean GDP growth rate. I have used this proportion once in my point of view the 14.25% correspondent to the historical average of growth is too ambitious. As we can see in the table 1 (above) the revenues growth rate has been presenting two downwards trends, between 2009-2011 and 2012-2014, being inclusively negative in 2014. Thus, I am assuming they have the conditions to boost their sales again through a strategy which involves the acquisition of interesting targets like BlackBerry, but I think this growth will stabilize accordingly with the national GDP.
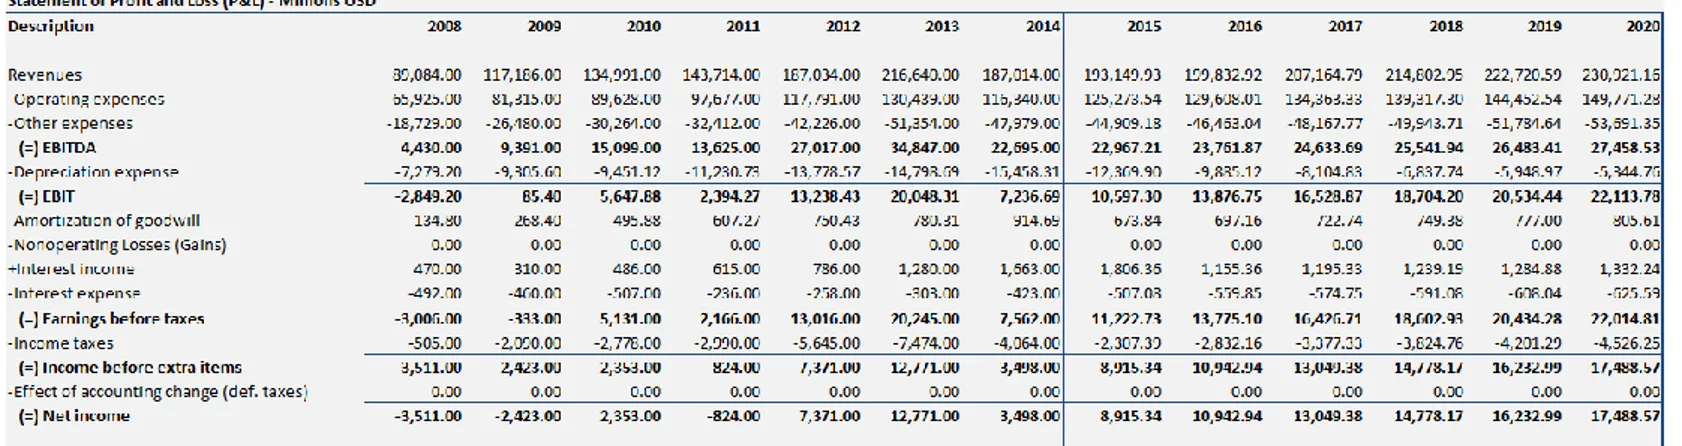
Table 2 - Income Statement
Through the estimations done in the table 1, it was possible to project Samsung’s Income Statement as it is presented in the table 2 above. As we can see, my estimations regarding the future revenues are pointing out to a smooth increase of EBITDA and EBIT over the next six years. EBITDA, which was 22,695million USD in 2014 will continue more or less unaltered in 2015 and the EBIT will increase from 7,236.69 million USD in 2014 to 10,597.30 in 2015, due to a decrease in the depreciation expense. The Net Income is in accordance with the previous results raising its result in 2015. These are very encouraging news to Samsung, which can expect to acquire
19 BlackBerry in a period when it seems they will have the necessary financial conditions to make the transaction and also to invest in the rehab of the targeted company.
Once I have made the projections for the Income Statement and the Balance Sheet of the company for the next six years, I started organizing this information to build more simple tables, as for example the table of the Working Capital, CAPEX and NOPLAT, which were very useful afterwards to compute the Free Cash Flows of the firm.
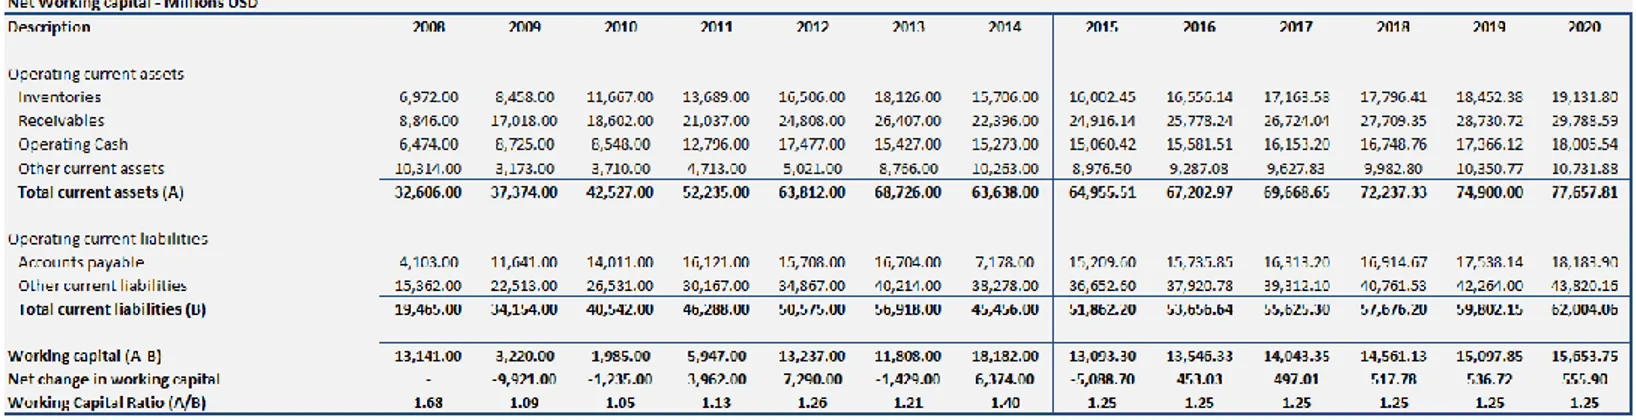
From what we can see in the table 3 below, Samsung’s didn’t follow an identifiable pattern of its investment in the Net Working Capital during the last six years of activity, once they were investing or disinvesting year over year. However we can also observe that the working capital was always positive which shows that the company had always enough short term assets to cover its short term debt.
Furthermore, the working capital ratio of the company was always between 1 and 2, what is a desirable result for this ratio. If the ratio is lower than one, the company has negative working capital and if the ratio is higher than two, it can mean that Samsung has excessive inventory or that they are not investing their excess cash. My predictions point out to a stable working capital ratio of 1.25 between 2015 and 2020 what indicates Samsung will be able to cover its short term debt with their short term assets and also that they will desirably have excess cash to invest in the company.
Table 3 - Net Working Capital
20 Regarding the Capital Expenditures, it is what mainly reflects the investment made by the company to acquire or to rehabilitate fixed assets like a property, equipments or industrial buildings. Usually, the companies make this type of investments when they want to maintain or increase their operations. As we can see in the table 4 above or in the graph 7 below, the capital expenditures of Samsung had an outstanding growth in 2010. This year the CAPEX represented 14.80% of the sales and 132.28% of the EBITDA, percentages that were much higher than the average of the last years (11.18% and 116.47%, respectively). It was followed by successive small increases and decreases (that finished in a reduction of 8.87% in 2014), which means that Samsung kept more or less the same level of investment in fixed assets during this period of time.
Graph 7 - CAPEX 2008-2014 Graph 8 - CAPEX 2015-2020 0.00 5,000.00 10,000.00 15,000.00 20,000.00 25,000.00 2008 2009 2010 2011 2012 2013 2014 USD Year
CAPEX
CAPEX 0.00 5,000.00 10,000.00 15,000.00 20,000.00 2015 2016 2017 2018 2019 2020 USD YearCAPEX
CAPEX21 The graph 8 above reveals my belief that Samsung’s capital expenditures will slightly decrease in the following years. After the huge investment made in the last years, my forecast led me think that in the near future Samsung can probably adopt a strategy to reduce the CAPEX, until a point where it will mainly use it to replace the existent fixed assets. Therefore, the capital expenditures will reduce 2.5% each year and it is important to underline that it will be lower than the result of EBITDA, what didn’t happen in the past.
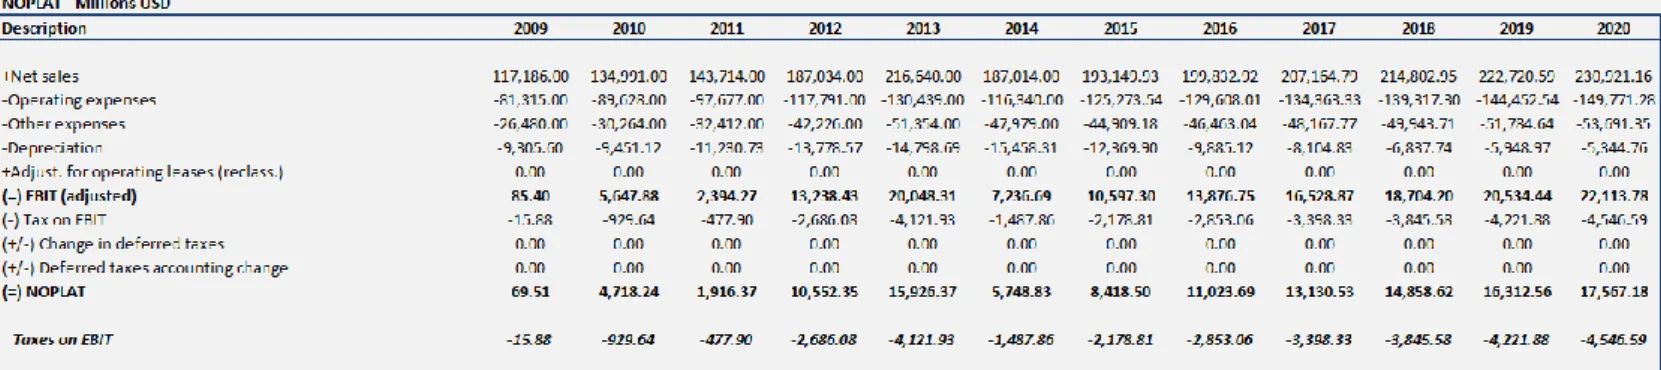
Table 5 - NOPLAT and EBIT
In the table 5 above I have reached the values of NOPLAT and EBIT, the last one being especially important to calculate the Free Cash Flows to the Firm (FCFF). From what we can see, the EBIT value will consistently increase in the future. The fact that Samsung’s operating profit will be positive and inclusively increase, year after year, is a good indicator about the strategy the firm will implement and that they can expect a prosperous future as a standalone one. I just want to call your attention to the fact that I have done an adjustment in the EBIT value for the operating leases. However the company didn’t report any operating lease after 2007 so the adjusted EBIT is exactly equal to the EBIT presented in the income statement.
2.1.2. - Dupont Analysis
In order to analyze the data we find in the financial statements of a company we can apply the dozens of financial ratios available. These financial ratios are divided into families or groups of ratios like: Liquidity, Profitability, Debt, Operating Performance, Cash Flow Indicator and Investment Valuation (also known as Multiples). The DuPont model is the best example to show the relationship between these families of ratios once it starts by the analysis of both ROA and ROE and ends up with the division of these ratios in several others components. Given that each of these isolated ratios is an
22 indicator of a distinct aspect of a company’s performance that affects ROA and also ROE. The decomposition allows us to better gauge how these different aspects of performance affected the company’s profitability as measured first by the ROA and then complementarily by the ROE.
This measure of performance includes as presented above three different components such as the profit margin, asset turnover and financial leverage, which are indicators of profitability, efficiency and solvency, respectively. Furthermore, in the 5-element analysis, ROA and also ROE become a function not only of Efficiency and Leverage, but also Profitability as the result of the Taxation, Interest Burden, Operational Expenses and COGS effects.
As stated in the table below, Samsung presents a Return on Assets (ROA) which increases from 4.11% to 11.64% between 2015 and 2020, demonstrating how effectively the company will expectedly be managing the assets financed by equity and debt holders insofar as to apply them to harvest profits. The Return on Equity (ROE) demonstrates also the same trend. It increases from 6.01% to 24.41% in the analyzed period, indicating how efficiently the company is using those equity financed assets to produce earnings for shareholders.
23
Table 6 - Dupont Analysis
According to Ciesielski Jr., Jack T., 2011, the first component presented, the Net Profit Margin, is an indicator of profitability which can be seen as “The earnings squeezed out of each dollar of sales”. It summarizes the company’s income performance by showing the profit per dollar of sales. Samsung’s Net Profit Margin increases from 4.62% to 7.57% between 2015 and 2020, which shows that each dollar invested in this company have a higher return year after year. The main component that contributes to this situation is the increase in the EBIT Margin, which will have a compound annual growth rate (CAGR) of 11.78%. The EBIT Margin (as the Operating Expenses + COGS effect) addresses the ability to produce improvements in controlling operating costs. In the other hand, the Interest Burden will decrease in the next years, ending up with a CAGR of -1.23%. It Captures the effect of interest on ROA and consequently on ROE, with higher borrowing costs decreasing ROA/ROE. Moreover, it is also important to mention that the interest burden presents such high values because EBT includes also the interest income received by Samsung, which decreases the net interest and increases the interest burden ratio. The Tax Effect will be kept constant over time. This implies that whatever the tax rate, Samsung will have the same deduction in its pretax profits. Regarding the Asset Turnover, known as an Efficiency Indicator, it increases from 0.89 to 1.54 between 2015 and 2020. This means that the sales generated from each dollar of assets employed had a positive evolution, showing increasing efficiency of the company’s management of the asset side of its balance sheet.
Concerning the ROA, we can conclude the main driver for its variation is the significant positive increase of the Total Asset Turnover, which presents a CAGR of 11.52%. Furthermore, the Total Asset Turnover has a higher weight in this ratio’s computation, what makes its increase even more significant. The Net Profit Margin will be also important for the ROA’s growth, with a CAGR of 10.41%.
24 Finally, to get to ROE we need the Financial Leverage component. This indicator of solvency will gradually grow until 2020, showing that the amount of equity used to finance the assets will slightly change. Furthermore, this ratio also shows that Debt value will increase (while equity is decreasing) resulting in a bigger difference between assets and equity. There are growing opportunities to boost ROE if the Financial Leverage Ratio keeps increasing in the long-run – if the assets are financed with debt, this ratio will increase and so will ROE as a product of ROA and the Financial Leverage ratio.
2.1.3. – DCF Model
2.1.3.1. – Free Cash Flows to the Firm
After doing the financial projections, organizing all the information and analyzing it through the DuPont model it is time to approach the valuation methods in order to have the value of the company.
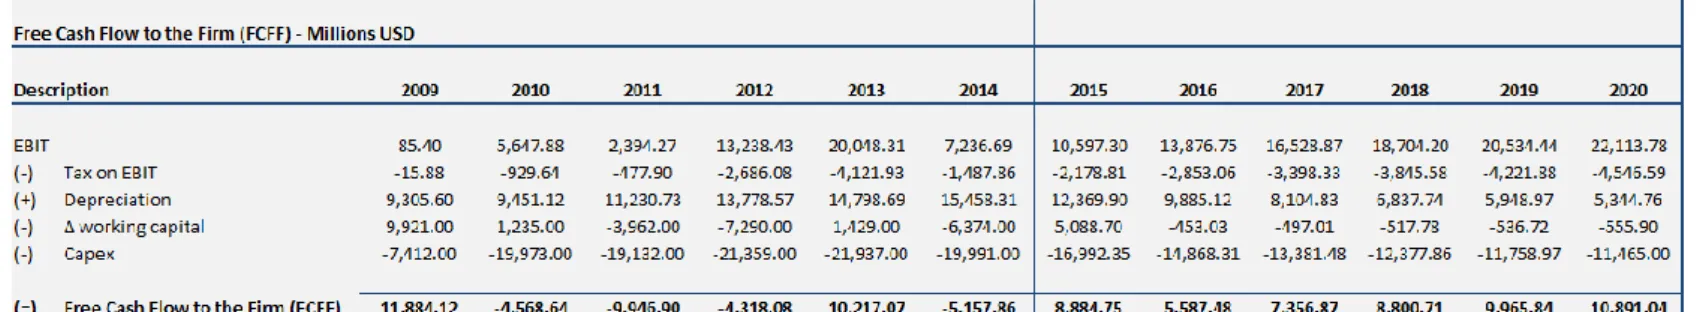
Table 7 - Samsung's FCFF
In the table 7 above we can see the free cash flows that Samsung will obtain in the next years under the assumptions that I have done for the macroeconomic scenario, see exhibit 1.1 of the annexes, and the financial statements I have forecasted for the company. As you can see Samsung’s FCFF will be stable in the next years having a minimum value of 5,587.48 million USD in 2016 and a maximum value of 10,891.04 million USD in 2020. The CAGR of the FCFF in the period comprised between 2015 and 2020 is 4.16%, showing it will gradually grow in the near future.
2.1.3.2. – Discount Rate – WACC
In order to compute the present value of Samsung’s FCFF, I used the discount rate suggested by the majority of the literature, the Weighted Average Cost of Capital. My first assumption is that in the real world, the economy and the business environment is dynamic, so I will discount each FCFF with the WACC of the respective year.
25
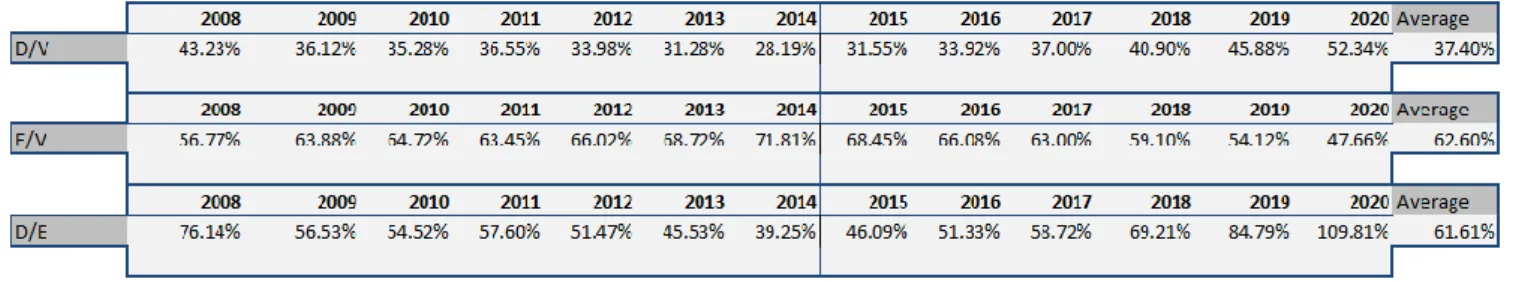
Table 8 - Samsung's Capital Structure
The table 8 above shows us that the capital structure of the company changes every single year and since it is one of the most important variables of the WACC formula, it will also change my discount rate year after year.
Table 9 - Samsung's Equity Beta
Regarding the calculation of the levered beta that I will use to reach the cost of equity, I have gathered the unlevered beta of the company in Bloomberg, whose analysts compared the risk of Samsung without any debt to the risk of the market. The Debt to Equity ratio I used was the one correspondent to the capital structure that Samsung presented in 2014, the year of the valuation. The corporate tax rate followed the same logic than the previous variable.
26
Table 10 - Weighted Average Cost of Capital
Last but not least, I have to say that the risk free rate I used was the 10 year South Korean Government Bond and that the market risk premium was computed subtracting the risk free rate to the return of the market (I have done the average return of the S&P 500 because this index includes not only Samsung and Blackberry but also their peer group).
2.1.3.3. – Valuation
Finally, with the WACC presented in the previous sub-section, we are able to discount the FCFF also showed above and reach an enterprise value of 178,015.54 million USD and an equity market value of 131,328.54 million USD for Samsung in 2014.
27
Table 12 - DCF Valuation - Equity Market Value
Once Samsung had 147.3 million shares outstanding in 2014, I have reached an equity market value per share of 891.57 USD.
Table 13 - Equity Market Value per Share (Note: #Shares is in millions and value per share is not)
2.1.3.4. – Sensitivity Analysis
As we know the real world economy is not an exact science and for this reason it is possible that some of the assumptions I have done in my model can suffer changes in the future. So, with the purpose of studying how small changes in the macroeconomic scenario can impact the valuation I have done through DCF model, I decided to apply a sensitivity analysis.
The variables I chose to test in this sensitivity analysis were the discount rate (WACC) and the growth rate (terminal value). My test comprised a variation of 1% upwards and downwards in both variables, simultaneously. Thus, I have computed the equity market value of Samsung when WACC had a value range between 9.15% and 13.15% and when the growth rate had a value range of 1.32% and 5.32%.
Actually, as you can see in exhibit 1.4 of the annexes, this sensitivity analysis was extremely useful and shows that every single change in the referred variables, even small ones, means a big impact in the company valuation. Consequently, Samsung valuation has a minimum value of 89,397.29 million USD and 224,630.81 million USD.
28 2.1.4. – Multiples Valuation
The second method I chose to get Samsung’s enterprise and equity market values was the traditional valuation by market multiples. It is useful to compare to the values I had in the previous method.
The market multiples I have used were the Price to Earnings Ratio (PER), the Enterprise Value/EBITDA and the Enterprise Value/Sales. The reason why I decided to use these multiples is that it allows me to value the company purely by its volume of sales when I use EV/Sales, it allows me to value the company through its operating earnings when I use the EV/EBITDA and finally when I use the PER I am also considering the non-operating side of the company’s business.
Table 14 - Market Multiples computation
In the table 14 above, is it possible to see the peer group I have chose to Samsung. I included these six companies in the peer group because all of them produce a wide range of consumer and industrial electronic and products such as Samsung. The majority of them were also selected due to their geographic proximity. Furthermore, all of them are quite similar to Samsung if we talk about their dimension.
As you can see in the table above, after computing the ratios for each company, I made the average of each ratio and considered it as the market multiples used for the companies with the characteristics of Samsung and that are in their industry. As a result, I will use a PER value of 10.75x, an EV/Sales of 0.5047x and an EV/EBITDA of 13.72x.
In the table 15 below I have organized the value of the revenues, EBITDA and net income projected for 2015. In table 16 you can see the valuation results I obtained with each multiple.
29
Table 15 - Market Multiples - Samsung Inputs
Table 16 - Market Multiples - Valuation
The equity market value that I get using PER and EV/EBITDA is very similar, being 95,876.45 million USD and 98,692.46 million USD, respectively. The company’s value that we get using EV/Sales, 50,795.89 million USD, is almost an half of the value we had using the previous multiples. It shows the market is more conservative predicting the value of a company when having its sales as a base because it does not show the level of efficiency and profitability a company has, i.e. if the company has a good management team.
Table 17 - Market Multiples - Samsung's Value
To conclude, I have made an arithmetic average of Samsung’s value using multiples and I came out with a final result of 81,788.27 million USD.
2.1.4.1. – Sensitivity Analysis
Exactly for the same reasons I have done the sensitivity analysis for the DCF valuation, I have repeated the same methodology for the multiples valuation. The variables I tested simultaneously were the value of the multiple itself and the input required to compute
30 the equity value, i.e. using the PER as an example, I applied a variation of 10% upwards and downwards not only on the PER’s value but also on the value of Samsung’s earnings for 2015.
The sensitivity analysis that is presented in exhibit 1.5 of the annexes shows that Samsung’s equity market value is between 47,970.93 million USD and 80,010.22 million USD when using PER, the company’s value is between 2,087.70 million USD and 34,663.82 million USD using EV/Sales and finally it is between 26,052.33 million USD and 74,634.16 million USD when calculating with EV/EBITDA.
On average, the market multiples indicate an equity value between 25,370.32 million USD and 63,102.73 million USD.
2.1.5. – Samsung’s Valuation Range
The table 18 below shows the final result I have came in after performing the company’s valuation through the two different methodologies I have presented in the previous sections. I have done an average of the results I obtained using the DCF and the multiples, giving the same weight (50%) for each type of valuation. Hence, I can conclude that Samsung has a value between 57,384.00 and 143,867.00 million USD, wherein I would suggest a more precise value of 106,558.00 million USD. The graph 9 also represents this valuation range that we are giving to Samsung.
Table 18 - Samsung's Valuation Range
Samsung Equity aluation - Millions USD
Description Equity value
Dec.2014 Minimum Maximum
Equity value by DCF 131,329 89,397 224,631
Equity value by multiples (average) 81,788 25,370 63,103
31
Graph 9 - Samsung's Valuation Range
0 50,000 100,000 150,000 200,000 250,000
Equity value by DCF Equity value by multiples (average)
Samsung Valuation
USD
32
2.2. – BlackBerry Valuation
2.2.1. – Financial Projections
As I have done in the previous section, in order to estimate the valuation of BlackBerry, I have to start this section with the forecast of the financial statements for the next six years.
Following the same methodology I have used in Samsung’s financial projections, this process resulted in a table as follows:
Table 19 - Forecast Ratios of Income Statement
As I have done in Samsung forecasts (and its showed in the table 19 above), I am considering that the Interest Income depends on the future evolution of the Cash & Market Securities. Moreover, in the exhibit 2.2 I show that the Cash and the Market Securities are dependent on the Revenues, which were one of the most important drivers in this forecast. The Revenues were forecasted differently. Its growth rate was computed through a weighted average: 25% is the historical growth’s average (Exhibit 2.1.) and 75% is the Canadian GDP growth rate. I have used this proportion once in my point of view the 11.10% correspondent to the historical average of growth is too aspiring. As we can see in the table 19 (above) the revenues growth rate had a downwards trend, being negative since 2012. So, I think they will be able to enhance their sales using a strategy that takes advantage of their intangible assets (intellectual property). In the end I believe that revenues’ growth rate will stabilize accordingly to the national GDP.
33
Table 20 - Income Statement
Through the estimations done in the table 19, it was possible to project BlackBerry’s Income Statement as it is presented in the table 20 above. My estimations concerning the future revenues are pointing out to a reverse in the negative spiral that was felt in the EBITDA and EBIT. EBITDA, which was -3,809M € in 2014 will recover for an expected value of 368.61M € in 2015 and the EBIT will follow the same path presenting a positive value of 273.72M € in 2015 after a negative result of -4,050.27 in 2014. The Net Income is in accordance with the previous items recovering also to a positive result in 2015. These are very encouraging news to Samsung, which can expect to acquire BlackBerry in a period when it seems they are fragile but recovering from the last years’ weak results.
From what we can see in the table 21 below, BlackBerry invested in its Working Capital until 2012 and disinvested a lot in 2013 and 2014. Maybe the company had more difficulties to get external financing and opted to use its working capital to invest in positive NPV projects. Additionally, the working capital was always positive which shows that the company had always enough short term assets to cover its short term debt.
Furthermore, until 2012 the working capital ratio was always higher than 2 or very close to this value, what means that BlackBerry had excessive inventory or that they were not investing their excess cash. In 2013 and 2014 the working capital ratio was between 1 and 2, which is the desirable result for this ratio. My predictions reveal a stable working capital ratio of 1.88 between 2015 and 2020, indicating that BlackBerry will be able to cover its short term debt with their short term assets and also that they will desirably have excess cash to invest in the company. It is undoubtedly a good indicator to Samsung, once they will not have to spend money to pay BlackBerry’s short term debt.
34
Table 21 - Net Working Capital
Table 22 - CAPEX
In table 22 and in the graph 10 we can see that the CAPEX of BlackBerry had an outstanding growth in 2009. This year it represented 7.53% of the sales and 28.58% of the EBITDA, percentages that were higher than the average of the last years. It was followed by much smaller increases in 2010 and 2011 but suddenly the investment in fixed assets started decreasing until 2014. It seems like BlackBerry needed to reduce the level of investment, probably due to the financial difficulties they were felting.
Graph 10 - CAPEX 2008-2014 0.00 200.00 400.00 600.00 800.00 1,000.00 1,200.00 2008 2009 2010 2011 2012 2013 2014 USD Year
CAPEX
CAPEX35
Graph 11 - CAPEX 2015-2020
The graph 11 above reveals my conviction that BlackBerry’s capital expenditures will slightly increase in the following years. After the massive reduction was made in CAPEX since 2012, I believe that in the near future the firm has to smoothly invest in the replacement of the existent fixed assets. Therefore, the capital expenditures will increase approximately 5% every year.
Table 23 - NOPLAT and EBIT
In the table 23 above I have reached the values of NOPLAT and EBIT, the last one being especially important to calculate the Free Cash Flows to the Firm (FCFF). From what we can see, the EBIT value will increase in the future. The fact that BlackBerry’s operating profit will be positive and inclusively increase, year after year, is a good indicator about the strategy the firm will follow. I just want to remember once again to the fact that I have done an adjustment in the EBIT value for the operating leases.
0.00 50.00 100.00 150.00 200.00 250.00 300.00 350.00 2015 2016 2017 2018 2019 2020 USD Year
CAPEX
CAPEX36 2.2.2. - Dupont Analysis
As stated in the table 24 below, BlackBerry presents a Return on Assets (ROA) which increases from -2.57% to -1.61%, between 2015 and 2020, but it is still negative, indicating the company will not be managing effectively the assets financed by equity and debt holders. The Return on Equity (ROE) follows the same trend. It increases from -4.81% to -3.44% in the analyzed period, but is also negative. Once again, it shows the company is not using efficiently the equity financed assets and will not generate earnings for shareholders.
Table 24 - Dupont Analysis
BlackBerry’s Net Profit Margin increases from -2.59% to -1.30%, between 2015 and 2020, but is negative. It means that each dollar invested in this company doesn’t have return. In fact each dollar invested culminates in losses to the firm. The main component that contributes to this situation is the increase in the interest burden, which will have a CAGR of 15.58%. Although its upward trend, the interest burden is still negative due to the fact the company is paying interests that are higher than its operating income. It is a problematic and unsustainable situation that should be fixed as quickly as possible. The company took excessive debt and now is “paying the bill”. In addition, the interest burden is not only responsible for the growth of the net profit margin but is also the reason why it is negative. The EBIT Margin, which will have a compound annual growth rate (CAGR) of 11.78%, also contributes to the increase of the net profit margin. The Tax Effect will be kept constant over time. This implies that whatever the tax rate, BlackBerry will have the same deduction in its pretax profits.
Regarding the Asset Turnover, known as an Efficiency Indicator, it increases from 0.99 to 1.24 between 2015 and 2020. This means that the sales generated from each dollar of assets employed had a positive evolution, showing increasing efficiency of the company’s management of the asset side of its balance sheet.
37 Concerning the ROA, we can conclude the main driver for its variation is the significant positive increase of the net profit margin, which presented a CAGR of 12.86%. It is negative which makes ROA also negative. The Total Asset Turnover will be also important for the ROA’s growth, with a CAGR of 4.57%.
Finally, to get to ROE we need the Financial Leverage component. This indicator of solvency will gradually grow until 2020, showing that the amount of equity used to finance the assets will slightly change. Furthermore, this ratio also shows that Debt value will increase (while equity is decreasing) resulting in a bigger difference between assets and equity. There are growing opportunities to boost ROE if the Financial Leverage Ratio keeps increasing in the long-run – if the assets are financed with debt, this ratio will increase and so will ROE as a product of ROA and the Financial Leverage ratio. Note that, due to a negative ROA, which is consequence of a negative net profit margin, the ROE will also be negative in the following years.
2.2.3. – DCF Model
2.2.3.1. – Free Cash Flows to the Firm
In the table 25 below we can see the free cash flows that BlackBerry will achieve in the next years under the assumptions that I have done (see exhibit 2.1. in the annexes). As you can see BlackBerry’s FCFF will decrease in the next years reaching a minimum value of 96.54 million USD in 2020. The CAGR of the FCFF in the period comprised between 2015 and 2020 is -28.36%.
Table 25 - BlackBerry's FCFF
2.2.3.2. – Discount Rate – WACC
In order to compute the present value of BlackBerry’s FCFF, I used the Weighted Average Cost of Capital as discount rate. I will discount each FCFF with the WACC of the respective year.
38
Table 26 - BlackBerry's Capital Structure
The table 26 above shows us that the capital structure of the company changes every single year and therefore my discount rate will also change year after year.
Table 27 - BlackBerry's Equity Beta
To compute the levered beta I will use to reach the firm’s cost of equity, I have gathered BlackBerry’s unlevered beta in Bloomberg. The Debt to Equity ratio I used was the correspondent to the capital structure of 2014, the year of the valuation. The corporate tax rate followed the same logic than the previous variable.
39
Table 28 - Weighted Average Cost of Capital
Last but not least, I have to say that the risk free rate I used was the 10 year Canadian Government Bond and that the market risk premium was computed subtracting the risk free rate to the return of the market (I have done the average return of the S&P 500 because this index includes not only Samsung and Blackberry but also their peer group).
2.2.3.3. – Valuation
Finally, with the WACC presented in the previous sub-section, we are able to discount the FCFF also showed above and reach an enterprise value of 2,630.45 million USD and an equity market value of 282.45 million USD for BlackBerry in 2014.