UNIVERSIDADE DE ÉVORA
ESCOLA DE CIÊNCIAS E TECNOLOGIA
DEPARTAMENTO DE BIOLOGIA
UNIVERSIDADE DE LISBOA
INSTITUTO SUPERIOR DE AGRONOMIA
Recruitment of the stalked barnacle
Pollicipes pollicipes on an artificial
substratum ("barticle") and transfer to an
extensive system of production: success
techniques and pitfalls
Joana Isabel Rodrigues Nascimento Fernandes
Orientação: Professora Doutora Teresa Cruz
Co-‐orientação: Doutor David Jacinto
Co-‐orientação: Mestre Maria Inês Seabra
Mestrado em Gestão e Conservação dos Recursos Naturais
Dissertação
Évora, 2018
Agradecimentos
Aos meus orientadores Teresa Cruz, David Jacinto e Inês Seabra pelo incentivo, discussão de ideias, revisão e críticas.
À Teresa Silva, David Mateus e Daniela Nobre pelo apoio no trabalho de campo e laboratorial.
Aos colegas do Laboratório de Ciências do Mar da Universidade de Évora (CIEMAR).
Aos projectos de investigação “AQUAPOLLIS: Viabilidade biológica e económica da aquacultura de percebe (Pollicipes pollicipes) em Portugal” (projeto piloto 31-‐03-‐05-‐FEP-‐46 financiado pelo PROMAR – Programa Operacional das Pescas 2007-‐2013) e “AQUAPOLLIS+: Aquacultura do percebe (Pollicipes pollicipes)” (Operação ALT20-‐03-‐0145-‐FEDER-‐000003 financiado pelo Programa Operacional Regional do Alentejo 2014-‐2020), que possibilitaram a realização deste trabalho.
Índice
Agradecimentos ... ii
Abstract ... iv
Resumo ... v
Introduction ... 1
Methods ... 4
Study sites and barticle deployment ... 4
Barticle’s deployment level and growing conditions ... 5
Survival and size of barnacles transferred to the platform ... 7
Monthly growth of barnacles transferred to the platform ... 8
Results ... 10
Barticle’s deployment level and growing conditions ... 10
Survival and size of barnacles transferred to the platform ... 10
Monthly growth of barnacles transferred to the platform ... 15
Discussion ... 17
Recruitment of the stalked barnacle Pollicipes pollicipes on an
artificial substratum ("barticle") and transfer to an extensive
system of production: success techniques and pitfalls
Abstract
Aquaculture potential of the stalked barnacle Pollicipes pollicipes was investigated. Artificial collectors (barticles) of larvae and juveniles were deployed at the Cape of Sines and later transferred to a floating platform in the Port of Sines for juvenile growth.
Survival and growth data and/or practical issues, justified the choice of the mid shore as the most suitable barticles’s deployment level in the field, and of plates within individual cages as the best option of the analysed growing conditions in the platform. Survival of barnacles transferred to the platform was initially high but decreased to zero over time due to intense biofouling. During winter, growth in the platform was higher than in the Cape of Sines. Barnacles’ survival and growth rate during winter in the platform are promising results, although biofouling, namely in spring and summer, is still a major problem to address.
Recrutamento do percebe Pollicipes pollicipes em substrato
artificial ("barticle") e transferência para um sistema de produção
extensivo: sucessos e insucessos.
Resumo
Este estudo analisou o potencial da aquacultura do percebe Pollicipes pollicipes. Usaram-‐se coletores artificiais de larvas (“barticles”) colocados no Cabo de Sines (SW Portugal) que foram posteriormente transferidos para uma plataforma flutuante no Porto de Sines para crescimento dos juvenis. Com base nos dados de sobrevivência e crescimento obtidos e/ou aspetos práticos, o nível intertidal médio foi considerado como o mais adequado para a colocação dos “barticles”, e as placas em redes individuais como a melhor opção para o crescimento dos percebes na plataforma. A sobrevivência dos percebes transferidos foi alta inicialmente, mas decresceu ao longo do tempo para zero, devido a “biofouling” intenso. Durante o inverno, o crescimento foi superior na plataforma relativamente ao Cabo de Sines. A sobrevivência e a taxa de crescimento dos percebes na plataforma durante o inverno constituem resultados promissores, embora o “biofouling”, nomeadamente na primavera/verão, seja ainda um problema que deverá ser mitigado futuramente.
Introduction
Stalked barnacles belonging to the genus Pollicipes are crustacean cirripedes that are found mainly on intertidal rocky shores along the eastern Atlantic coast (P. pollicipes, from France to Senegal and P. caboverdensis in the Atlantic Islands of Cape Verde) and along the eastern Pacific coast (P. polymerus and P. elegans) (Barnes, 1996; Fernandes et al., 2010).
All Pollicipes species inhabit wave-‐exposed rocky shores and are edible, being exploited as economically important coastal resources (López et al., 2012; Cruz et al., 2015a). Particularly, P.
pollicipes can be considered the most commercially valuable intertidal resource of the Iberian
Peninsula (e.g. Molares & Freire, 2003; Cruz et al., 2015b).
P. pollicipes presents several characteristics that qualify it as a marine species with high interest
for aquaculture: it is highly appreciated and considered a delicacy in Portugal and Spain (Molares & Freire, 2003; Sousa et al., 2013); it has a high commercial interest and its price can reach up to 200 euros per kilogram in Spanish restaurants; its harvesting is a very dangerous activity and dependent on sea conditions; in Portugal, exploitation has been highly intense, the state of this resource has a negative tendency and its management is considered weak (Cruz et al., 2015b); as a filter-‐feeder, is a low trophic level species, with consequently low energy requirements; it has potential to be farmed in an environmentally sustainable way, in an extensive system of production.
Besides these characteristics, aquaculture of P. pollicipes could diminish harvesting pressure on natural populations and ameliorate the management of this resource. However, there aren’t any known cases of success of P. pollicipes aquaculture. The only known attempt to produce P.
pollicipes in the wild was in Santander region (Spain), where pieces of rock with barnacles were
transplanted from the exposed intertidal areas and were suspended in the water column for two months (Goldberg, 1984). Although growth rates were high in this system, this procedure would not be sustainable as an aquaculture technique, since it requires the exploitation of barnacles with commercial interest, possibly leading to the destruction of natural populations and its habitats.
P. pollicipes adults are sessile filter-‐feeding organisms that form dense clusters on rocky shores.
They are simultaneous hermaphrodites reproducing through cross-‐fertilization (Cruz & Hawkins, 1998). Embryos are developed inside the barnacle, in the mantle cavity, until hatching of larvae. This species undergoes a pelagic larval phase comprised of six naupliar stages and one cyprid stage that settles and metamorphoses into a juvenile individual (Barnes, 1996). Although the
cyprids are able to settle directly on the rock or on other organisms, settlement and recruitment of this species is very high on conspecifics (Macho, 2006; Cruz et al., 2010) and in the southwest coast of Portugal it happens mainly during summer and autumn (Cruz et al., 2010). Maturity is reached at a maximum rostro-‐carinal distance (RC length) superior to 12.5 mm (Cruz & Hawkins, 1998). In its natural habitat, P. pollicipes can take one to two years for individuals to grow and reach commercial size (≥ 20 mm RC; Cruz et al., 2010), although growth can be highly variable (Cruz et al., 2010; Jacinto et al., 2015).
The cultivation of P. pollicipes in laboratorial conditions has been the subject of several studies regarding larval development (Molares et al., 1994; Kugele & Yule, 1996; Franco, 2014; Franco
et al., 2015; Franco et al., 2016a; Franco et al., 2016b), or juvenile and adult growth and survival
(Cribeiro, 2007; Franco, 2014; Franco et al., 2015). Several important results were achieved in these studies, such as reproduction and hatching of larvae, larval development from nauplius I to cyprid stage or the optimization of larval and adult culture conditions. However, in spite of research efforts, the conditions necessary to promote settlement of cyprids in culture are still poorly understood and this step of the life cycle represents the main bottleneck to the viability of P. pollicipes cultivation in captivity. Very low settlement rates of cyprid larvae were found in these studies, even on conspecifics (Kugele & Yule, 1996; Franco, 2014; Franco et al., 2016). Experimental studies of aquaculture with other cirripede crustaceans regard acorn barnacles of the species Austromegabalanus psittacus (“picoroco”) in the Chilean coast (López et al., 2012). This was done on a semi-‐industrial scale, with larvae collected from the wild with artificial structures and moved to a grow-‐out system where juveniles within these structures are suspended in the water column (longlines). According to these authors, the productivity of these farming systems was very high in relation to artisanal fishery of this resource, but there was spatial and temporal variability on the production and, consequently, a certain degree of unpredictability of this production. There are also experimental studies to cultivate the Azorean barnacle (Megabalanus azoricus) in a similar way, and results revealed a potential of this species for aquaculture (Pham et al., 2011).
Regarding P. pollicipes, several authors have tested a wide array of artificial substrates for settlement and recruitment of this species in the field (Coelho, 1991; Cruz, 2000; Franco, 2014; Jacinto, 2016) or in laboratorial conditions (Kugele & Yule, 1996; Franco, 2014). In those studies, there was no success in settlement or low levels of settlement were found (Kugele & Yule, 1996; Jacinto, 2016).
Recently, a new artificial substrate developed by University of Évora (2017, patent pending), named “barticle”, has proved to be efficient for larval attachment, metamorphose and growth of juveniles of P. pollicipes in the field (Darras, 2017; Mateus, 2017). The subsequent transfer of
this “barticle” to an extensive cultivation system, is a promising method for the aquaculture of this species.
The Sines region (SW Portugal) presents several features attractive for the implementation of P.
pollicipes aquaculture: the Cape of Sines is a rocky coastal area of high hydrodynamism where
this species is abundant and highly exploited by professional and recreational stalked barnacle harvesters (Sousa et al., 2013); the bay of the Port of Sines is a sheltered area adjacent to the Cape of Sines, and where it is possible to install artificial farming systems under safety conditions.
According to this, the present work is based on the use of “barticles” deployed in the Cape of Sines to collect larvae and juveniles of P. pollicipes, and later collected and transferred to support structures placed in a floating platform located in the bay of the Port of Sines, where the barnacles were allowed to grow.
This study had the following objectives:
1) To define the most suitable barticle’s deployment level in the field and growing conditions in the floating platform (support structure and anti-‐predation system);
2) To study the temporal variation of survival, size and growth of barnacles transferred to the culture system in relation to different transfer periods.
Additionally the weight of the fouling assemblages associated with “barticles” collected from the platform was quantified.
Methods
Study sites and barticle deployment
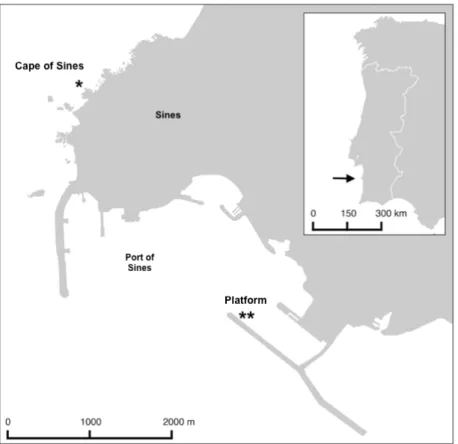
This study was carried out in the Cape of Sines (37°57'46''N; 8°53'10''W), a very exposed rocky shore where P. pollicipes occurs in abundance along the shallow subtidal and intertidal levels, and on a floating platform located in a sheltered area in the bay of the Port of Sines (37°56'17"N; 8°51'48"W; Figure 1). The floating platform consists of a series of high-‐density polyethylene (HDPE) pipes assembled together to form two squares of 5x5 m separated by a 1 m wide walkway (total dimensions: 12.5x6 m; Figure 2). The platform was anchored to the jetty nearby and to the bottom at a depth of approximately 25m. In each square, 6 parallel nylon ropes (≈70 cm apart), each with 5 superficial buoys (≈80 cm apart) were deployed along the surface and fastened to the HDPE pipes for easy access and retrieval of suspended structures. One of the squares had a suspended global cage made with a 1 cm mesh size nylon net (total dimensions: 5x5x2 m) to avoid predators.
Figure 1 -‐ Location of barticle deployment site at the Cape of Sines (*) and location of the floating platform
at the bay of the Port of Sines (**), and its relative position in relation to the coast of mainland Portugal.
The present study involved the deployment of barticles in the Cape of Sines for P. pollicipes larval attachment and metamorphosis into juveniles and its subsequent transfer to the platform for barnacle growth.
Barticles are artificial substrates formed by a pvc wall plug (8mm diameter and 38 mm length) with longitudinal grooves and a partially inserted stainless steel screw (4 mm diameter and 40 mm length). The lower end of the plug is inserted and fixed to the rock, while the screw facilitates subsequent barticle removal from the rock (University of Évora, 2017, patent pending).
A total of 832 barticles distributed by 52 plots of 16 barticles each, regularly spaced in a quadrat of approximately 100 cm2, were deployed in the intertidal zone of the Cape of Sines with the help of a cordless drill and a hammer. Barticles were deployed on two vertical levels in relation to the intertidal distribution of P. pollicipes: mid shore, that corresponds to the middle/upper level of P. pollicipes intertidal distribution (~1.5 m to 3 m above MLWS) and low shore that corresponds to the lower intertidal level of P. pollicipes distribution (~ MLWS to + 1.5 m) (Sousa
et al., 2013). Deployment of barticles was always dependent on sea conditions, but low shore
level was only accessible in spring tides and for a shorter period of time compared with mid shore level. Consequently, a higher number of barticles was deployed in the mid shore (n=32 for low shore; n=800 for mid shore).
Barticles were deployed during low tide, in June and July of 2014, before the starting of P.
pollicipes recruitment season in the southwest coast of Portugal (summer/fall, Cruz et al., 2010).
Figure 2 – a) platform scheme with individual cages (left square) and global cage (right square); b) general
view of the platform.
Barticle’s deployment level and growing conditions
In order to define the most suitable barticle’s deployment level in the field, on the 26th, 29th and
30th December 2014, 6th January and 10th, 11th and 12th February 2015, a total of 128 barticles
(32 from low shore and 96 from mid shore) were collected from the Cape of Sines using a hammer claw and taken to the laboratory in a plastic bucket. The initial number of P. pollicipes individuals per barticle (Pp_I) was recorded under a dissecting microscope. This procedure was done with a minimum manipulation of the barnacles attached to the barticles, which could have led to an underestimation of this variable. Barticles with no barnacles attached (<10%) were discarded.
Growing conditions in the platform regarded the type of support structures for barticles and an anti-‐predation system.
To define the most suitable support structure for barticles in the platform, barticles from both vertical levels (mid and low shore) were then fixed to two types of support structures: tubes, consisting in PVC pipes with a diameter of 10 cm, length of 95 cm and thickness of 0.5 cm; plates, consisting in PVC boards with a width of 20 cm, length of 95 cm and thickness of 1 cm. Six replicate tubes and three replicate plates were used in total.
Each structure had 36 insertion points (7 mm holes made with a drill) where barticles were randomly assigned and inserted with the help of a hammer. The support structures (tubes and plates) were then taken to the platform and hung from the superficial buoys in total immersion conditions.
In order to ensure protection against predation of barnacles in the platform, two anti-‐predation systems were considered for placing the support structures: global cage, as previously described; individual cage, i.e. an individualized cage for each plate or tube, placed on the other square of the platform (Figure 2a). The individual cage consisted of an iron structure (20x20x100 cm) wrapped in a nylon net with 1 cm mesh size.
All the procedures, starting from collection in the Cape of Sines until placement in the platform, were made within intervals from 2 to 4 hours after collection of the barticles in the field, in order to minimize the loss or damage of animals and the time required for their transfer.
In order to measure monthly growth of P. pollicipes fixed to barticles from different deployment levels and in different growing conditions, a sample of barticles collected from mid (n= 36) and low (n= 13) shore levels in the Cape of Sines was taken to the laboratory and submerged in a calcein solution for barnacle marking (see Jacinto et al., 2015 for method details), randomly assigned to tubes or plates and to the global or individual cages and taken to the platform the following day.
All barnacles were left to grow for three to four months in the platform without further manipulation.
On the 29th and 30th April 2015, all barticles were collected from the platform and were labeled
Following sample unfreezing in the laboratory, P. pollicipes barnacles attached to each barticle were detached and individualized. The final number of individuals of P. pollicipes per barticle (Pp_F) was recorded and RC length of each individual was measured under a dissecting microscope or with calipers depending on individual size (precision of 0.01 mm and 0.1 mm, respectively).
Barnacles marked with calcein, after having been counted (Pp_F) and measured (RC length), were immersed in commercial bleach, their capitular plates were detached from the rest of the body and the initial (at the time of marking) and final length of scutum plate was measured under an epifluorescent dissecting microscope (Leica M165FC with a UV light source and GFP3 filter) equipped with a digital camera (Leica DF 295), and monthly growth rate (∆RC30) was estimated according to the method described by Jacinto et al. (2015).
The effects of barticle’s deployment level (mid and low shore), support structures (tubes and plates) and anti-‐predation system (global cage and individual cage) on the response variables Pp_I, Pp_F, RC length and ∆RC30, were analyzed by one-‐way ANOVA to each factor and each response variable. Homogeneity of variance was assessed using Levene’s test and data were transformed when appropriate. The software SPSS was used for all analyses.
Survival and size of barnacles transferred to the platform
Transfer of the barticles from the Cape of Sines to the platform was carried out in seven transfer periods (each period comprising one to six dates):
1) T1/Dec-‐Jan (18th, 26 th, 27th, 29th, 30th December 2014 and 6th January 2015); 2) T2/February (9 th-‐12th February 2015); 3) T3/3April (3rd April 2015); 4) T4/30April (30th April 2015); 5) T5/June (9th Jun 2015); 6) T6/August (10th August 2015); 7) T7/September (28th-‐29th September 2015).
On each transfer period, barticles (n= 16 in T7/September to n= 190 in T1/Dec-‐Jan) were collected in the Cape of Sines and taken to the laboratory.
The initial number of P.pollicipes individuals per barticle (Pp_I) was measured as described above.
Additionally, in order to have an independent sample and a more accurate estimation of the number of P. pollicipes individuals per barticle and their respective size (RC length) at “time 0”
(t0), a sample of barticles (n= 8 to 25) for each transfer period was frozen until further analysis. RC length data at time 0, for T2/February and T3/3April transfer periods, was missing due to accidental loss of samples.
Barticles were then randomly assigned to twenty support structures and taken to the platform where barnacles were allowed to grow from four to twelve months, without further manipulation until time of sampling.
Five monitoring dates were considered for sampling of barticles in the platform and in the Cape of Sines (control site):
1) M1/April (29th and 30th April 2015);
2) M2/June (9th and 10th June 2015);
3) M3/August (10th and 11th August 2015);
4) M4/October (2nd and 8th October 2015);
5) M5/January (14th and 15th January 2016).
On each monitoring date, barticles from the different transfer periods were collected from the platform (n= 63 to 152) and an additional sample of barticles (n= 8 to 25) was collected from the Cape of Sines for control purposes. All barticles were labeled and frozen until further processing in the laboratory.
Following sample unfreezing in the laboratory, P. pollicipes barnacles attached to each barticle were detached and individualized. The variables Pp_F and RC length of each individual were measured.
The fouling communities (mainly mussels and acorn barnacles) associated with each barticle collected from the platform were weighted, starting on M3/August monitoring date onwards. Differences in Pp_I among monitoring dates, for each transfer period were tested through one-‐ way ANOVA. If no significant differences were found in Pp_I, we considered Pp_F as a proxy of survival.
Differences in Pp_F and in RC length among monitoring dates including at time 0 (t0 – independent sample at time of transfer), were tested through one-‐way ANOVA for each transfer period. Homogeneity of variance was assessed using Levene’s test and data were transformed when appropriate. Post-‐hoc pairwise comparisons were performed with Student-‐Newman-‐ Keuls (SNK) tests and the software SPSS was used for all analyses.
Monthly growth of barnacles transferred to the platform
In order to measure monthly growth rates of P. pollicipes transferred to the platform and in the Cape of Sines (control site), a total of 67 barticles were collected from the Cape of Sines, then
taken to the laboratory and submerged in a calcein solution for barnacle marking (see Jacinto et al., 2015 for method details), and taken to the platform in two support structures or to the Cape of Sines the following day. Two marking periods were considered: winter, with barnacles marked in December 2014 / January 2015 and collected in March / April 2015 (n= 49), and with a growth period in the field ranging from 82 to 124 days; summer, with barnacles marked in June 2015 and collected in September 2015 (n= 18), and with a growth period in the field ranging from 89 to 90 days.
In the laboratory, P.pollicipes barnacles attached to each barticle were detached and individualized, and monthly growth rate (∆RC30) per individual was estimated accordingly to the method previously described.
Variability of ∆RC30 on the two different seasons and on both locations was analysed by permutational multivariate analysis of variance, PERMANOVA (Anderson, 2001) due to unbalanced number of samples in each treatment. Two factors were considered: season (fixed factor with two levels: winter and summer) and location (fixed factor with two levels: Cape of Sines and platform). Homogeneity of univariate dispersion based on Euclidean distance was tested using the PERMDISP routine (Anderson 2006). The software PRIMER 6 and PERMANOVA+ (www.primer-‐e.com; Anderson et al. 2008) was used to perform these procedures.
Results
Barticle’s deployment level and growing conditions
The mean variation of initial (Pp_I) and final (Pp_F) number of P. pollicipes individuals per barticle, and of RC length and monthly growth rate (∆RC30) per individual, regarding different barticle’s deployment level (mid and low shore), support structures (tubes and plates) and anti-‐ predation system (global cage and individual cage) is shown in Figure 3.
There was a significant effect of barticle’s deployment level on the monthly growth rate (∆RC30) of P. pollicipes (F 1; 141 = 14.09; p = 0.000). ∆RC30 in mid shore barnacles (mean ±SE = 0.9 ±0.04
mm) was significantly larger than in low shore barnacles (mean ±SE = 0.7 ±0.06 mm). There were no significant differences between mid and low shore barticles for the variables Pp_I (F 1; 29 =
0.33; p = 0.572), Pp_F (F 1; 29 = 0.54; p = 0.467) and RC length (F 1; 851 = 3.72; p = 0.054; square
root transformed data).
There was a significant effect of the support structures on RC length (F 1; 454 = 5.07; p = 0.025)
and on ∆RC30 (F 1; 383 = 51.93; p = 0.000). RC length in tubes (mean ±SE = 6.0 ±0,16 mm) and
∆RC30 in tubes (mean ±SE = 1.5 ±0.03 mm) was significantly larger than RC length in plates (mean ±SE = 5.6 ± 0.18 mm) and ∆RC30 in plates (mean ±SE = 1.1 ±0.05 mm). There were no significant differences between tubes and plates for the variables Pp_I (F 1; 30 = 0.99; p = 0.327)
and Pp_F (F 1; 30 = 0.144; p = 0.707).
Regarding the anti-‐predation system, there were significant differences between individual cages and the global cage for the variables Pp_I (F 1; 30 = 13.28; p = 0.001; square root
transformed data) and ∆RC30 (F 1; 375 = 84.75; p = 0.000). Pp_I in the global cage (mean ±SE =
25.7 ±3.31) was significantly bigger than in individual cages (mean ±SE = 11.4 ±2.04) while ∆RC30 in the global cage (mean ±SE = 0.9 ±0.04 mm) was significantly smaller than in individual cages (mean ±SE = 1.5 ±0.03 mm). There were no significant differences between individual and global cages for the variables Pp_F (F 1; 30 = 0.38; p = 0.545; log(x+1) transformed data) and RC length (F
1; 616 = 1.94; p = 0.164).
Survival and size of barnacles transferred to the platform
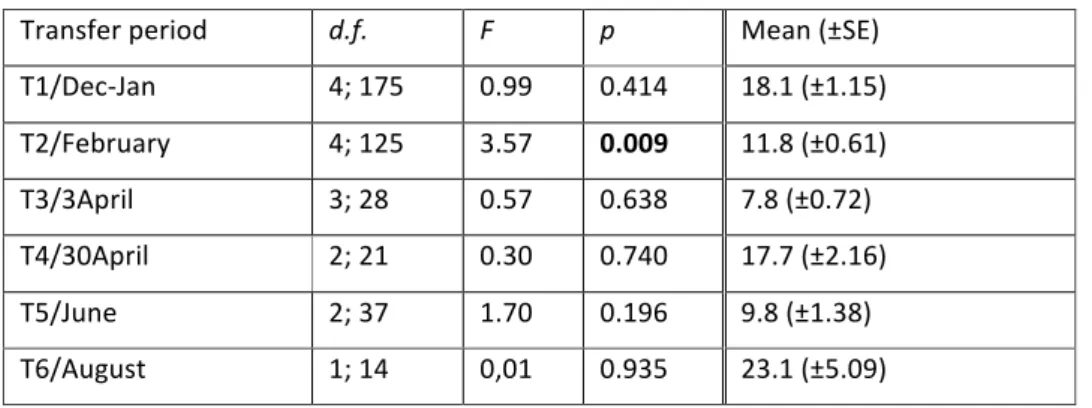
The analyses to the initial number of P. pollicipes per barticle (Pp_I) revealed that there were no significant differences for this variable among monitoring dates on most of the transfer periods
(Table 1). The only exception was for barticles transferred in T2/February, although SNK tests failed to identify a defined pattern for this transfer period.
The number of individuals per barticle transferred to the platform varied between 7.8 ±0.72 (mean ±SE) in T3/3April and 23.1 ±5.09 (mean ±SE) in T6/August (Table 1).
Considering the results of the analyses to Pp_I (no differences among monitoring dates in all transfer periods with the exception of T2), we have considered the final number of P. pollicipes per barticle (Pp_F) on each monitoring date and for each transfer period as a proxy of survival.
Figure 3 -‐ Initial number (Pp_I; mean ±SE) and final number (Pp_F; mean ±SE) of individuals of P. pollicipes
per barticle for different deployment levels, support structures and anti-‐predation system (left column graphics). Maximum rostro-‐carinal distance (RC length, bars; mean ±SE) and monthly growth rate (∆RC30, line; mean ±SE) per individual for different barticle’s deployment level, support structures and anti-‐ predation system (right column graphics).
0 10 20 30 40 Pp_I Pp_F nº -o f-i ndi vi dua ls -pe r-ba rt ic le (m ea n-± SE ) Low-shore Mid-shore 0 0,2 0,4 0,6 0,8 1 1,2 1,4 1,6 1,8 0 2 4 6 8 10 12 14 Low-shore Mid-shore ∆R C3 0-(m m ,-m ea n-± SE ) RC -le ng th -(m m ,-m ea n-± SE ) 0 10 20 30 40 Pp_I Pp_F no -o f-i ndi vi dua ls -pe r-ba rt ic le -(m ea n-± SE ) Plate Tube 0 0,2 0,4 0,6 0,8 1 1,2 1,4 1,6 1,8 0 2 4 6 8 10 12 14 Plate Tube ∆R C3 0-(m m ,-m ea n-± SE ) RC -le ng th -(m m ,-m ea n-± SE ) 0 10 20 30 40 Pp_I Pp_F nº -o f-i ndi vi dua ls -pe r-ba rt ic le (m ea n-± SE )
Individual- cage Global-cage
0 0,2 0,4 0,6 0,8 1 1,2 1,4 1,6 1,8 0 2 4 6 8 10 12 14
Individual- cage Global-cage
∆R C3 0-(m m ,-m ea n-± SE ) RC -le ng th -(m m ,-m ea n-± SE )
Table 1 –Analyses of variance (ANOVA) on the initial number of P. pollicipes per barticle (Pp_I) in relation
to factor “monitoring date” for each transfer period and mean values (±SE) of pooled data of all monitoring dates for each transfer period. Bold – significant p-‐values (p≤0.05). Untransformed data.
Transfer period d.f. F p Mean (±SE)
T1/Dec-‐Jan 4; 175 0.99 0.414 18.1 (±1.15) T2/February 4; 125 3.57 0.009 11.8 (±0.61) T3/3April 3; 28 0.57 0.638 7.8 (±0.72) T4/30April 2; 21 0.30 0.740 17.7 (±2.16) T5/June 2; 37 1.70 0.196 9.8 (±1.38) T6/August 1; 14 0,01 0.935 23.1 (±5.09)
The final number of individuals of P.pollicipes per barticle (Pp_F) at time 0 (t0) of each transfer period was highly variable and it varied between 8.4 ±1,18 (mean ±SE) in T3/3April and 58.1 ±15.54 (mean ±SE) in T6/August transfer period (Figure 4).
There was a decrease of Pp_F over time and, with the exception of the barticles transferred in T7/September, on the last monitoring date (M5/January 2016), the mean number of individuals per barticle was approximately zero for all the transfer periods (Figure 4).
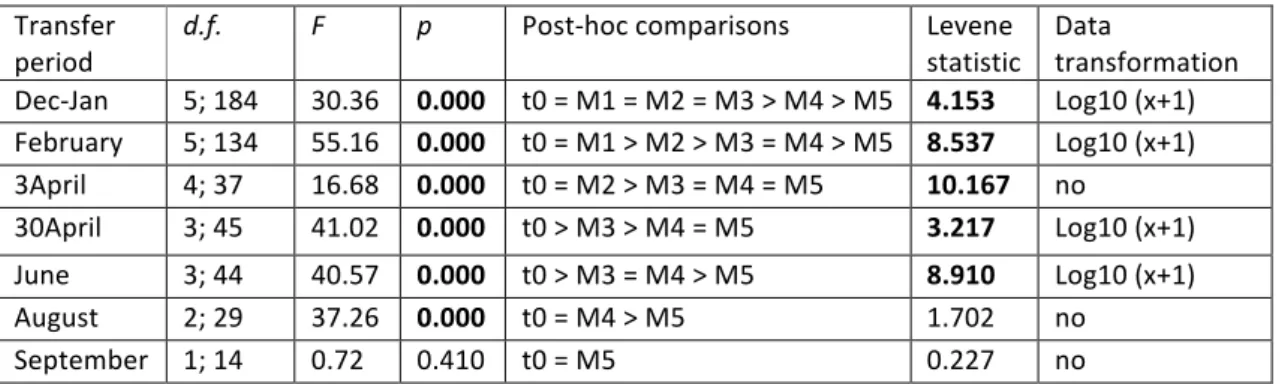
ANOVA results indicate significant differences in Pp_F among monitoring dates (including t0) for all transfer periods except for T7/September (Table 2). The mean number of individuals per barticle significantly decreased over time from t0 to M5/January. This decrease occurred immediately after t0, as in T4/30April and T5/June transfer periods, or later, as in T1/Dec-‐Jan transfer period where it occurred only in M4/October monitoring date (Table 2).
The size of P.pollicipes individuals at t0 for each transfer period was highly variable and RC length varied between 1,4 ±0.08 mm (mean ±SE) in T1/Dec-‐Jan and 4,3 ±0.28 mm (mean ±SE) on T4/30April transfer periods (Figure 4).
Despite a significant increase in size in the first monitoring date after transfer, for most of the transfer periods (except T2/February in which this increase occurred on M3/August, and T4/30April and T6/August in which there were no significant differences), mean RC length remained similar (T1/Dec-‐Jan transfer period) or significantly decreased on the last monitoring date (T2/February, T3/3April and T5/June transfer periods) (Table 3).
Figure 4 – Number of individuals of P. pollicipes per barticle (Pp_F; mean ±SE) at time 0 (t0; white dot)
and at the five monitoring dates (grey dot) (left column graphics) and maximum rostro-‐carinal distance per individual (RC length; mean ±SE) at time 0 (t0; white dot) and at the five monitoring dates (grey dot) (right column graphics) for each transfer period of barticles to the platform. RC length data at t0 is missing for T2/February and T3/3April transfer periods. Note the different y-‐axis scale in T6/August transfer period for the variable Pp_F.
n=10 n=47 n=27 n=33 n=56 n=17 0 5 10 15 20 25 30 35 40 no ,o f,i ndi vi dua ls ,pe r, ba rt ic le , (m ea n, ± SE ) n=10 n=24 n=28 n=14 n=48 n=16 0 5 10 15 20 25 30 35 40 no ,o f,i ndi vi dua ls ,pe r, ba rt ic le , (m ea n, ± SE ) n=10 n=8 n=8 n=8 n=8 0 5 10 15 20 25 30 35 40 no ,o f,i ndi vi dua ls ,pe r, ba rt ic le , (m ea n, ± SE ) n=25 n=8 n=8 n=8 0 5 10 15 20 25 30 35 40 no ,o f,i ndi vi dua ls ,pe r, ba rt ic le , (m ea n, ± SE ) n=8 n=8 n=24 n=16 0 5 10 15 20 25 30 35 40 no ,o f,i ndi vi dua ls ,pe r, ba rt ic le , (m ea n, ± SE ), n=16 n=8 n=8 0 10 20 30 40 50 60 70 80 no ,o f,i ndi vi dua ls ,pe r, ba rt ic le , (m ea n, ± SE ) n=8 n=8 0 5 10 15 20 25 30 35 40 Ja nC 15 Fe bC 15 Ma rC 15 Ap rC 15 Ma yC 15 Ju nC 15 Ju lC15 Au gC 15 Se pC 15 Oc tC 15 No vC 15 De cC 15 Ja nC 16 no ,o f,i ndi vi dua ls ,pe r, ba rt ic le , (m ea n, ± SE ) T1 Dec /Jan* T2 February T3 3*April T4 30*April T5 June T6 August T7 September n=212 n=1004 n=509 n=641 n=314 n=4 0 1 2 3 4 5 6 7 8 RC /le ng th (m m ,/m ea n/ ± SE ) n=405 n=195 n=37 n=61 0 1 2 3 4 5 6 7 8 RC /le ng th (m m ,/m ea n/ ± SE ) n=64 n=15 n=4 0 1 2 3 4 5 6 7 8 RC /le ng th (m m ,/m ea n/ ± SE ) n=418 n=39 n=9 0 1 2 3 4 5 6 7 8 RC /le ng th (m m ,/m ea n/ ± SE ) n=183 n=32 n=65 0 1 2 3 4 5 6 7 8 RC /le ng th (m m ,/m ea n/ ± SE ) n=924 n=264 n=6 0 1 2 3 4 5 6 7 8 RC /le ng th (m m ,/m ea n/ ± SE ) n=192 n=123 0 1 2 3 4 5 6 7 8 Ja n> 15 Fe b> 15 Ma r> 15 Ap r> 15 Ma y> 15 Ju n> 15 Ju l>15 Au g> 15 Se p> 15 Oc t> 15 No v> 15 De c> 15 Ja n> 16 RC /le ng th (m m ,/m ea n/ ± SE )
Table 2 –Analyses of variance (ANOVA) on the final number of P. pollicipes per barticle (Pp_F) in relation
to factor “monitoring date” for each transfer period. Bold – significant p-‐values (p≤0.05). Monitoring dates: t0– time 0; M1-‐ April 2015; M2-‐ June 2015; M3-‐ August 2015; M4-‐ October 2015; M5-‐ January 2016.
Transfer period
d.f. F p Post-‐hoc comparisons Levene
statistic Data transformation Dec-‐Jan 5; 184 30.36 0.000 t0 = M1 = M2 = M3 > M4 > M5 4.153 Log10 (x+1) February 5; 134 55.16 0.000 t0 = M1 > M2 > M3 = M4 > M5 8.537 Log10 (x+1) 3April 4; 37 16.68 0.000 t0 = M2 > M3 = M4 = M5 10.167 no 30April 3; 45 41.02 0.000 t0 > M3 > M4 = M5 3.217 Log10 (x+1) June 3; 44 40.57 0.000 t0 > M3 = M4 > M5 8.910 Log10 (x+1) August 2; 29 37.26 0.000 t0 = M4 > M5 1.702 no September 1; 14 0.72 0.410 t0 = M5 0.227 no
Table 3 –Analyses of variance (ANOVA) on maximum rostro-‐carinal distance (RC length) of P. pollicipes
individuals in relation to factor “monitoring date” for each transfer period. RC length at t0 data not available for T2/February and T3/3April transfer periods. Bold – significant p-‐values (p≤0.05). Monitoring dates: t0– time 0; M1-‐ April 2015; M2-‐ June 2015; M3-‐ August 2015; M4-‐ October 2015; M5-‐ January 2016. n.d.p – no defined pattern.
Transfer
period d.f. F p Post-‐hoc comparisons Levene statistic Data transformation
Dec/Jan 5; 2678 204.92 0.000 t0 < n.d.p. 155.701 Log10 February 3; 694 5.30 0.001 M1 = M2 = M4 < M3 2.339 no 3April 2; 80 7.60 0.001 M4 < M2 = M3 0.382 no 30April 2; 463 2.36 0.096 1.130 no June 2; 277 13.91 0.000 t0 = M4 < M3 2.442 no August 2; 1191 0.17 0.847 1.334 no September 1; 313 40.99 0.000 t0 < M5 2.630 no
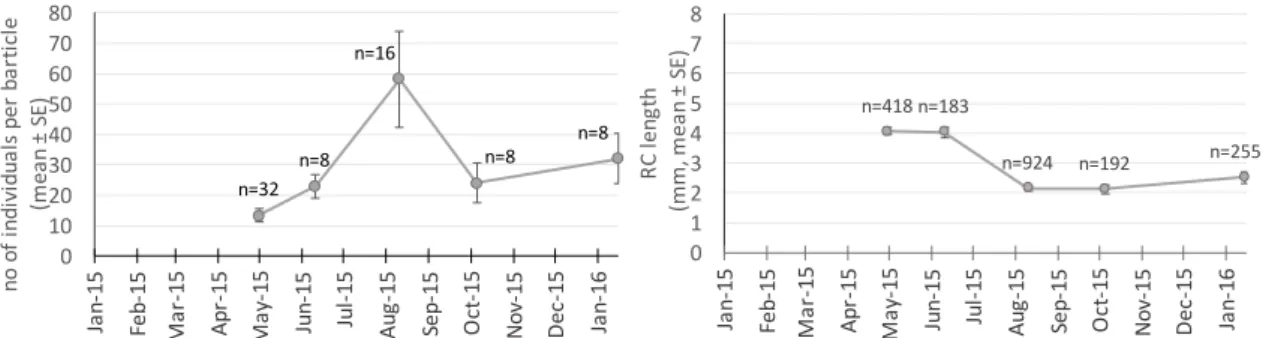
In the Cape of Sines (control site), the number of juveniles of P. pollicipes per barticle for the five monitoring dates varied between 13.2 ±2.16 (mean ±SE) in M1/April and 58.1 ±15.54 (mean ±SE) in M3/August (Figure 5). The RC length for these individuals varied between 2.2 ±0.14 mm (mean ±SE) in M3/August and 4.3 ±0.28 mm (mean ±SE) in M1/April (Figure 5).
The weight of fouling organisms per barticle in M3/August 2015 monitoring date and for barticles transferred to the platform between the periods T1/Dec-‐Jan and T5/June varied between 12.6 ±1.60 g (mean ±SE) (T5/June) and 89.1 ±7.23 g (mean ±SE) (T1/Dec-‐Jan), while in M5/January 2016, and for the same transfer periods, the fouling weight varied between 177.1 ±21.27 g (mean ±SE) (T5/June) and 273.9 ±36.50 g (mean ±SE) (T1/Dec-‐Jan) (Figure 6).
Barticles transferred later to the platform on T6/August and T7/September transfer periods, had a mean fouling weight of 20.6 ±2.39 (mean ±SE) and 3.4 ±1.84 g (mean ±SE) respectively, on M5/January monitoring date. Acorn barnacles settled often on the capitular plates of P.
Figure 5 -‐ Number of juveniles of P. pollicipes per barticle (mean ±SE) (left side graphic) and maximum
rostro-‐carinal distance (RC length) per individual (mean ±SE) (right side graphic) on the five monitoring dates in the Cape of Sines.
Figure 6 – Mean weight of fouling organisms per barticle on three monitoring dates (M3/August;
M4/October; M5/January 2016), for each of the seven transfer periods.
Monthly growth of barnacles transferred to the platform
Monthly growth rate (∆RC30) of P. pollicipes at the platform varied between 0.9 ±0.04 mm (mean ±SE) in summer and 1.2 ±0.02 mm (mean ±SE) in winter, while at the Cape of Sines varied between 0.6 ±0.04 mm (mean ±SE) during winter and 1.0 ±0.06 mm (mean ±SE) in summer period (Figure 7).
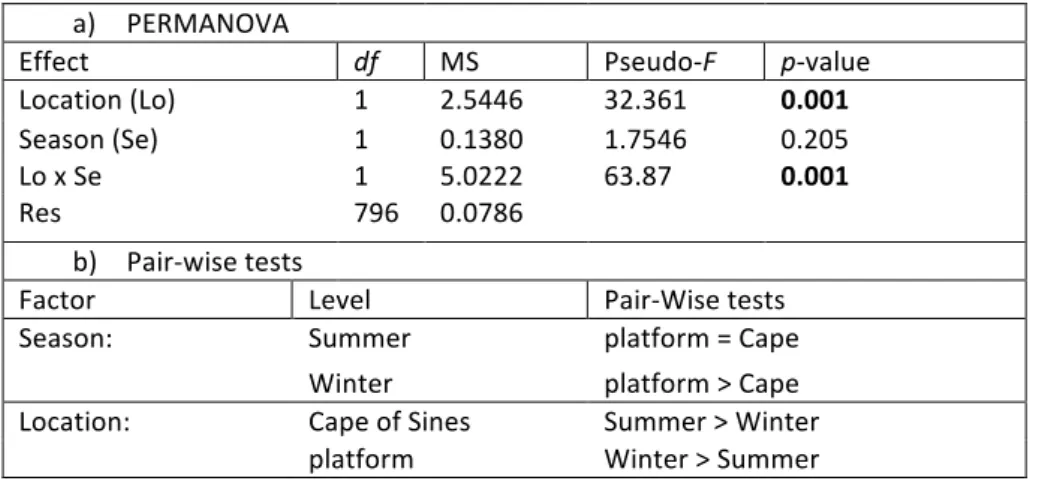
PERMANOVA results revealed a significant interaction between the two main factors (Location*Season) (Table 4a). Pairwise tests to the interaction term indicate that during winter period, monthly growth rate is higher at the platform than in the Cape of Sines while in summer there are no significant differences between the two locations. On the other hand, monthly growth at the platform during winter is significantly higher than during summer, while at the Cape of Sines the opposite pattern is observed, i.e. a higher monthly growth during summer than winter (Table 4b).
n=418 n=183 n=924 n=192 n=255 0 1 2 3 4 5 6 7 8 Ja n/ 15 Fe b/ 15 Ma r/ 15 Ap r/ 15 Ma y/ 15 Ju n/ 15 Ju l/15 Au g/ 15 Se p/ 15 Oc t/ 15 No v/ 15 De c/ 15 Ja n/ 16 RC Ele ng th (m m ,Em ea nE ± SE ) n=32 n=8 n=16 n=8 n=8 0 10 20 30 40 50 60 70 80 Ja n/ 15 Fe b/ 15 Ma r/ 15 Ap r/ 15 Ma y/ 15 Ju n/ 15 Ju l/15 Au g/ 15 Se p/ 15 Oc t/ 15 No v/ 15 De c/ 15 Ja n/ 16 no Eo fEi ndi vi dua ls Epe rE ba rt ic le E (m ea nE ± SE ) 0 50 100 150 200 250 300 Ja n) 15 Fe b) 15 Ma r) 15 Ap r) 15 Ma y) 15 Ju n) 15 Ju l)15 Au g) 15 Se p) 15 Oc t) 15 No v) 15 De c) 15 Ja n) 16 Fo ul in g? w ei gh t?( g) T1/Dec)Jan T2/February T3/3April T4/30April T5/June T6/August T7/September
Figure 7 – Comparison of monthly growth rate (mean ±SE) of P. pollicipes during different seasons
between the platform and the Cape of Sines (control site).
Table 4 – a) PERMANOVA analysis of factors Season (Se) and Location (Lo) on monthly growth of P.
pollicipes. All data were square root transformed. PERMDISP test: F= 2.8182; p= 0.057. Bold – significant
p-‐values (p≤0.05). b) Pair-‐wise tests to significant interaction term (Lo*Se).
a) PERMANOVA
Effect df MS Pseudo-‐F p-‐value
Location (Lo) 1 2.5446 32.361 0.001
Season (Se) 1 0.1380 1.7546 0.205
Lo x Se 1 5.0222 63.87 0.001
Res 796 0.0786
b) Pair-‐wise tests
Factor Level Pair-‐Wise tests
Season: Summer platform = Cape
Winter platform > Cape
Location: Cape of Sines Summer > Winter
platform Winter > Summer
n=#63 n=#528 n=#94 n=#115 0 0,2 0,4 0,6 0,8 1 1,2 1,4 Winter Summer Mo nt hl y# gr ow th #r at e (∆ RC 30 ,#m m ,#m ea n# ±SE ) Cape#of# Sines platform
Discussion
This study was based on the use of barticles as artificial substrates for P. pollicipes larval attachment and juvenile growth and its subsequent transfer to a grow-‐out system. The mean initial numbers of P. pollicipes obtained in the Cape of Sines and transferred to the platform were substantial, although highly variable and, depending on the transfer period, ranged from 7.8 (Pp_I at T3/3April) to 58.1 (t0 at T6/August) individuals per barticle. Variation is probably due to small scale spatial variability of settlement and recruitment on barticles but also due to time of transfer. In fact, barticles transferred between December 2014 (T1) and June 2015 (T5) collected settlers from the 2014 recruitment season while barticles transferred in August 2015 (T6) and September 2015 (T7) had accumulated settlers from two recruitment seasons (2014 and 2015).
One of the main challenges for the development of aquaculture of barnacles (López et al., 2010) or of many other species around the world (Fuentes & Molares, 1994) is to ensure both a sufficient and reliable quantity of seed for grow-‐out systems. In the case of P. pollicipes, larval settlement in artificial substrates was a main bottleneck for the aquaculture of this species (Cruz, 2000; Franco, 2014). Here we demonstrate that barticles are a relatively easy and low cost method for seed collection and subsequent transfer to grow-‐out systems.
Regarding barticle’s deployment level in the Cape of Sines, results suggest no differences in size between mid and low shore barnacles. However, mid shore barnacles presented a higher monthly growth rate than low shore barnacles in the platform. Jacinto et al. (2015) didn’t find any effect of shore level on P. pollicipes barnacles growth rate on a study at Cape Sardão (~40 Km south of Cape of Sines).
Considering practical issues, mid shore barticles were much easier to access and collect in the intertidal rocky shore. Although collection of the barticles was always dependent on sea conditions, low shore barticles were accessible only in spring tides and for a shorter period of time compared with mid shore barticles. Considering our results and practicality of barticles deployment and collection in the field, mid shore was chosen as the most suitable level for barticle deployment.
The support structures for barticles (tubes and plates) had no effect on survival, but tubes had barnacles with a larger size and a higher monthly growth rate than plates. In a study on acorn barnacle aquaculture, López et al. (2012) also found that pvc tubes were more efficient for barnacle growth than plates, which could be associated with the collector surface -‐ water column relationship. However, in our study, the interior part of the tubes ended up serving as