CISMOB - Cooperative information
platform for low carbon and
sustainable mobility
ICT towards low carbon and
sustainable mobility
ICT towards low carbon and sustainable mobility
A multiscale perspective
1
CISMOB
Cooperative information platform
for low carbon and sustainable mobility
ICT towards low carbon and sustainable mobility
– a multiscale perspective
CISMOB Project Index Number: PGI01611, co-funded by the Interreg Europe Programme Project Coordinator: Jorge Bandeira
CISMOB Lead Partner: University of Aveiro (PP1), Portugal CISMOB Advisory Partner: Stockholm University (PP2), Sweden
CISMOB Project Partners: Municipality of Águeda (PP3), Portugal; Bucharest Metropolitan Transport Authority (PP4), Romania; Intelligent Transport Systems Romania (PP5), Romania; Extremadura Energy Agency (PP6), Spain
CISMOB Team: J.M. Bandeira, E. Macedo, M. Niculescu, C. Sampaio, M.C. Coelho, M. Glinos, C. Couceiro, C. Borrego, J.P. Santos, L. Cuadros, C. Dominguez, C. Barbu, V. Koulolias, C. Laranjeira, F. Pocostales
Publisher: UA Editora - Universidade de Aveiro ISBN: 978-972-789-578-6
Acknowledgements: Authors would like to thank all CISMOB partners for their cooperation in providing valuable information for the preparation of this agenda. Special thanks go to CCDR-C (Centro Regional Coordination and Development Commission) and Ministry of Regional Development of Romania for their help in providing information to improve the report.
2
Contents
INTRODUCTION ... 9
PROJECT OBJECTIVES ... 11
AGENDA OBJECTIVES ... 15
IMPACTS OF TRANSPORT IN EUROPE ... 17
EU towards more sustainable and greener mobility ... 20
Transport infrastructure quality ... 20
Congestion levels ... 24
Alternative fuels ... 26
Environmental impact ... 28
Social impact ... 31
General overview ... 38
A closer look at the Transport Sector within the CISMOB Partnership ... 40
Modal Split for Passenger Transport ... 40
Evolution of Alternative fuels in Road Transport ... 40
Competitiveness Performance ... 42
ITS TOWARDS MORE EFFICIENT AND SUSTAINABLE MOBILITY ... 47
ASSESSING ENVIRONMENTAL AND ECONOMIC FACTORS ... 55
The Impact Pathway Approach to estimate monetary values of emission ... 56
Methodological approaches to estimate road transport emissions ... 57
Methodological approaches to estimate road transport emission costs ... 61
Relative share of difference in emissions and traffic-related environment costs of CISMOB countries in average emissions in EU 28comparison with EU 28 Average ... 63
GOOD PRACTICES ON LOW CARBON AND SUSTAINABLE MOBILITY ... 65
PROMOTING CO2 REDUCTIONS AND ICT PENETRATION IN POLICY INSTRUMENTS ... 71
How the merit of a Project is evaluated ... 71
CENTRO 2020 ... 71
ROMANIA 2020 ... 75
Estimating Project Impacts and Comparison grid evaluation framework of Policy Intruments ... 77
Metropolitan areas – Congestion charging system ... 77
ICT towards low carbon and sustainable mobility
A multiscale perspective
3
FINAL NOTES ... 85
Improving Policy Instruments – lessons from Interregional cooperation ... 85
Potential solutions ... 87
Transition to low carbon mobility - conclusion ... 89
ICT towards low carbon and sustainable mobility
A multiscale perspective
5
LIST OF FIGURES
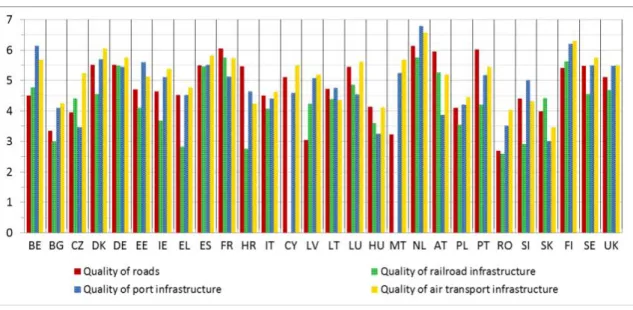
Figure 1 Satisfaction with infrastructure quality (2016-2017) ... 21
Figure 2 Average annual hours spent in congestion per vehicle (2015) ... 24
Figure 3 PEV market share in new passenger cars (M1) registrations (2016) ... 26
Figure 4 Transport environmental taxes as % of total taxation (2015) ... 28
Figure 5 Annual number of fatalities, injury accidents and injured people in EU between 2016-2015 ... 31
Figure 6 Share of fatalities by road type in the EU for the year 2015 ... 32
Figure 7 Number of people exposed to average day-evening-night noise levels in EU-28 (Lden) ≥ 55 dB . 33 Figure 8 Number of people exposed to night-time noise in EU-28 (Lnight) ≥ 50 dB ... 34
Figure 9 Urban and suburban background PM2.5 concentrations presented as 3-year averages in the EU‑28 (2012–2014), as an approximation of the average exposure indicator ... 35
Figure 10 Alternative fuel passenger cars market share for the period 2011-2016 ... 41
Figure 11 Competitiveness performance of CISMOB Partnership Regions in terms of scores ... 43
Figure 12 ITS categories and subcategories ... 48
Figure 13 Important characteristics of urban traffic ... 49
Figure 14 IPA framework: 1) emissions; 2) dispersion; 3) exposure; 4) impacts; and 5) damage ... 56
Figure 15 Decision tree for exhaust emissions from road transport ... 58
Figure 16 Basic framework for a Tier 3 approach ... 60
Figure 17 Input variables in COPERT... 61
Figure 18 Relative share of difference in emissions and traffic-related environment costs of CISMOB countries in average emissions in EU 28 comparison with EU 28 Average ... 63
Figure 19 Example of annual external cost savings (in Million EUR) related to emissions due to the reduction of traffic caused by a congestion charching system (traffic fleet and activity data (EMISIA, 2014)... 78
Figure 20 Real time information schedules on an outdoor e-paper technology and solar energy panel ... 81
Figure 21 Mode substitution in selected cities (Bike share’ s impact on car use: Evidence from the United States, Great Britain, and Australia) SOURCE: (Fishman et al., 2014). ... 82
Figure 22 Example of annual external costs savings related to emissions due to the reduction of traffic motivated by a e-bike sharing system (traffic fleet and activity data (EMISIA, 2014)) ... 84
ICT towards low carbon and sustainable mobility
A multiscale perspective
7
LIST OF TABLES
Table 1 Example of regional stakeholder groups and their interests ... 13
Table 2 Modal split for passenger transport in 2015... 40
Table 3 Global Competitiveness Index 2017-2018 for the countries within the CISMOB Partnership ... 42
Table 4 ITS and traffic management measures deployment and benefit KPIs ... 50
Table 5 Updated damage costs in € per tonne (2010) ... 62
Table 6 Best practices identified between partners countries ... 66
Table 7 Estimation of potential impacts of implementing a congestion charging system in a metropolitan area ... 78
Table 8 Assumptions for estimating impacts of RTIPT in a medium-sized city ... 79
Table 9 Estimation of expected emissions and energy savings due to avoided trips in private vehicles due to RTIPT in a medium-sized city ... 80
Table 10 Key perfomance indicators of RTIPT ... 80
Table 11 Assumptions for estimating impacts of a e-bike sharing system in in a small-sized city ... 83
Table 12 Estimation of expected emissions and energy savings due to an implementation of e-bike sharing system in in a small-sized city ... 83
ICT towards low carbon and sustainable mobility
A multiscale perspective
9
INTRODUCTION
The transport sector has an important contribution to the economy, employment and to the citizens’ mobility. However, it is also a major contributor to greenhouse gas (GHG) emissions, representing almost a quarter of Europe's GHG emissions, and air pollution, which reduces air quality in cities with direct effects on public health. In particular, road transport is responsible for almost a fifth of total EU emissions and 73% of emissions from transport (European Commission, 2017).
Intelligent Transport Systems (ITS) is the application of sensing, analysis, control and communications technologies for the management of the transport process to improve safety, mobility and efficiency, increase security and reduce environment impact. The use of ITS tools in transport has brought significant improvement in transport systems performance and it is a key element in reducing carbon footprint, as well as increasing the sustainability on an urban scale. The increasing road transport volumes in the EU are the primary cause of growing congestion and energy consumption, as well as a source of environmental and social problems (Tafidis & Bandeira, 2017). According to EC, ITS can contribute to the main transport policy objectives by reducing environmental impacts
10
and save energy through better demand management. Therefore, the primary goals for urban transport should be the promotion of cleaner cars and fuels and the reduction of road accidents and traffic congestion. ITS tools can have a significant role to a cleaner, safer and more efficient transport system. EC with the ITS Directive (2010/40/EU) gave the necessary legal framework to their member states to accelerate the implementation of smart technologies in transport sector, giving each country freedom to decide their priorities (Urban ITS Expert Group, 2013).
Regarding the mobility sector, there is a clear lack of well-structured policy guidelines that leverage the use of Information and Communication Technologies (ICT), sensing systems and big data to promote a more sustainable use of infrastructures. Specifically, there is still a waste of available resources for estimation real time mobility impacts and an even more obvious inability to use this information to implement sustainable mobility policies. The concept of sustainability in CISMOB concerns not only the carbon footprint but also the local economy and the social dimension, including active transport networks, users and the rest of citizens. Against this background, CISMOB partnership was developed in order to collect new ideas and practical experience.
ICT towards low carbon and sustainable mobility
A multiscale perspective
11
PROJECT OBJECTIVES
The main goal of the Interregional European Cooperation Project CISMOB is to improve the implementation of regional policies with the ultimate goal of reducing the carbon footprint. This goal can be achieved by promoting the efficient use of urban transport infrastructures through the application and use of ICT. Low carbon essentially means less energy consumption and therefore, a more efficient use of infrastructure. However, this optimization must be performed based on a holistic perspective integrating other environmental externalities (such as noise and other than CO2 atmospheric pollutants),
ensuring equitability, and social cohesion throughout proactively addressing specific local environmental and social vulnerabilities. Subsequently, CISMOB seeks to exchange regional level experiences in developing win-win strategies to achieve common benefits in reducing mobility related carbon footprint. The strategies should be supported by the innovative technology sector, which shall provide tools to increase the promotion of sustainable multimodal urban mobility and mitigate transport related environmental and social impacts. This objective is logically targeted at competent local and regional public authorities. However, universities have a key role by influencing local policy instruments and promoting the collaboration with innovative SMES.
While there are many European strategies and policies for ITS development and pollution reduction, it can be sometimes difficult for countries to translate them into national and
12
regional efficient and harmonized policies. This is where CISMOB can have a major contribution.
The composition of CISMOB partnership was created in order to deepen the relations between regional authorities, universities and stakeholders on a European level, bringing together different regional experiences in the field of smart, low carbon and sustainable mobility management. The partners are: University of Aveiro (PT); Stockholm University (SE), City of Águeda (PT), ITS-Romania (RO), Bucharest-Ilfov Inter-Community Development Association for Public Transport (Bucharest Metropolitan Transport Authority until 31/03/2018) (RO), and Agency of Energy of Extremadura (ES).
The process to drive policy change occurred at different levels over an iterative exchange of expertise programme. This process included a set of learning events, which led to the development of a set of technical documents and action plans for policy improvement. Firstly, a Baseline Assessment Report (BAR) was prepared for evaluating i) how ICT and sensor technology are used in the transportation system and, ii) how carbon footprint and sustainability indicators are considered in the European regions represented by CISMOB partners. BAR identifies Good Practices across the CISMOB Partnership and classify them, namely, in which extent they can be transferred to other Cities and Regions with different scales. This action fosters the knowledge at individual and organizational level (1 and 2). During the first phase of the project timeline, three Building Capacity Workshops (BCW) and three Thematic Seminars were performed. The BCW were organized by local Authorities/Agencies. These events addressed project’s outputs and shared each partner’s best Practices to partner’s staff and key stakeholders. The thematic seminars, organized by universities and ITS non-profit organizations aimed at providing participants with state-of-the-art information (at global level) in the area of capacity building toolkits, ICT and e-governance, as well as to promote social cohesion and urban sustainability (Stockholm University); monitoring and online impacts assessment (University of Aveiro), promoting of intelligent transport systems towards a low carbon mobility (ITS Romania).
It should be highlighted that both the weaknesses and best practices identified in the BAR will influenced the content for these regional events. Conversely, working groups integrating key staff of each partner participated in the development of technical papers pointing out the best practices found in each region, taking also advantage of the scientific, technical and empirical knowledge shared by research institutions and stakeholders.
These actions broaden the level of knowledge acquisition to the third level since regional stakeholders will actively participate in the learning process. CISMOB also supported staff
ICT towards low carbon and sustainable mobility
A multiscale perspective
13 world with local authorities. In turn, local authority staff had the opportunity to exchange
experiences in other regions as well as to acquire specific skills and techniques in R&D institutions.
The outputs of the exchange of experience process are consolidated in this document entitled "ICT Towards Low Carbon and Sustainable Mobility - a Multiscale Perspective". This document shares methodologies that can be used in various regions to identify the main negative externalities of the transport sector and potential good practice solutions observed during the interregional cooperation.
The focus of CISMOB is the engagement of pertinent stakeholders (decision and policy makers and all relevant actors, with particular focus on ICT and transport sector) in order to speed up decision making for the advance of policies for implementation of ICT measures in transport and contributing to mitigate transport related impacts in the consortium regions. Table 1 summarizes some stakeholder groups and their main interests.
Table 1 Example of regional stakeholder groups and their interests
Managing authorities R&D and Technological Platforms,
Universities
Funding and selection of new sustainable mobility projects,
Mobility plans (big demand generator), technical expertise IT companies and transport private
sector
Promoting R&D support and dissemination of products (e.g., smart transport apps, car sharing, integrated transit ticket solutions)
Public transport providers and transport authorities
Promoting multimodal information, integrated ticketing systems
Increase public transport usage Public tendering of mobility services Environmental Associations Ensuring Environmental Sustainability Institutional, energy and environmental
agency, mobility and transport institutions
Ensuring consistency between regional objectives and national legislation
ICT towards low carbon and sustainable mobility
A multiscale perspective
15
AGENDA OBJECTIVES
This AGENDA brings together outputs produced by the INTERREG EUROPE CISMOB project, which is a four-year partnership of six organizations from four European Union (EU) member states namely Portugal, Spain, Romania and Sweden (PT, ES, RO, SE).
This Agenda aims at providing regions and decision makers and managing authorities with simple methodological approaches:
- to estimate the transport-related environmental and social impacts of the transport sector on their region;
- to identify and classify regions regarding the penetration of ICT and ITS (Intelligent Transport Systems);
- to predict potential environmental gains of projects focused on sustainable mobility in order to set up ambitious, but realistic targets on regional policy instruments;
16
This Agenda can be considered as a support tool for regions to develop strategies for reducing the carbon footprint. By assessing estimates of road transport emissions, regions have a more clear perspective on their level of contribution for the GHG emissions. This Agenda is intended to raise awareness among regions on their crucial role to move towards low-carbon and sustainable urban mobility. Good practices highlighted here are expected to contribute to other regions to get inspired on these examples of success, and thus, can adapt and/or replicate them in their own regions.
ICT towards low carbon and sustainable mobility
A multiscale perspective
17
IMPACTS OF TRANSPORT IN EUROPE
Transport has several impacts on the environment. Emissions contribute to air pollution and climate change, noise causes nuisance and health risks. In addition to these impacts on the environment, transport has also other severe impacts on society.
Road transport is an important source of both greenhouse gases and air pollutants. The conditions are usually worst in areas that generate and attract many trips, such as city centres, shopping areas etc. In some cases, the low level of public transport services or even more the absence of alternative transport modes encourage the use of private vehicles aggravating the situation even more (EEA, 2016).
Despite improvements in vehicle efficiencies over past decades, today the sector is responsible for almost one fifth of Europe's greenhouse gas emissions (EEA, 2016). One of the main objectives of the European transport strategy in its 2011 White Paper is to build a competitive and resource efficient transport system that will increase mobility. The strategy includes reducing the fossil fuel dependency and the private car usage, by promoting alternative modes of transport.
EU is committed in reducing the environmental impacts of transport in Europe, including its greenhouse gas emissions, and EU’s overall goal is to reduce greenhouse gas emission associated to transport by 80-95% by 2050. In particular, key targets to be reached include reducing average CO2 emissions of new cars and vans to 95g/km and 147g/km,
18
respectively, by 2020 onwards and oil consumption by 70% by 2050 from 2008 levels (EEA, 2014).
The challenge of sustainable mobility is a worldwide problem, shared by a rising number of countries and regions. This challenge is leading to an increasing global demand for clean products, technologies, and business models focused on green mobility, which presents a huge business opportunity for a competitive EU industry in this sector. Transport represents almost a quarter of Europe's greenhouse gas emissions and is the main cause of reduced air quality in cities, which poses a serious threat to public health. Road transport alone is responsible for almost a fifth of total EU emissions and 73 per cent of emissions from transport.
ICT towards low carbon and sustainable mobility
A multiscale perspective
19
European Strategy for low-emission mobility
With the global shift towards a low-carbon, the Commission's low-emission mobility strategy, adopted in July 2016, aims to ensure Europe stays competitive and able to respond to the increasing mobility needs of people and goods. The strategy integrates a broader set of measures to support Europe's transition to a low-carbon economy and supports jobs, growth, investment and innovation. European Commission guiding principles on strategies to move towards low-carbon mobility state that the main elements should include:
• ability to respond to the increasing mobility needs of people and goods, • increasing the efficiency of the transport system by making the most of digital
technologies, smart pricing and further encouraging the shift to lower emission transport modes,
• speeding-up the deployment of low-emission alternative energy for transport, such as advanced biofuels, electricity, hydrogen and renewable synthetic fuels and removing obstacles to the electrification of transport,
• moving towards zero-emission vehicles. While further improvements to the internal combustion engine will be needed, Europe needs to accelerate the transition towards low- and zero-emission vehicles.
Cities and local authorities are crucial for the delivery of low-carbon mobility strategies, by implementing incentives for low-emission alternative energies and vehicles, encouraging modal shift to active travel (cycling and walking), public transport and/or shared mobility schemes, such as bike, car-sharing and car-pooling, to reduce road congestion and traffic-related pollution.
Emission cuts by Transport Sector
Emissions from transport could be reduced to more than 60% below 1990 levels by 2050. In the short term, most progress can be found in petrol and diesel engines that could still be made more fuel-efficient. In the mid- to long-term, plug-in hybrid and electric cars will allow for steeper emissions reductions. Biofuels will be increasingly used in aviation and road haulage, as not all heavy goods vehicles will run on electricity in future.
20
EU towards more sustainable and greener mobility
The main challenges for the transport sector in the EU include improvements for multi-modal mobility and shifting towards low-emission mobility.
EU is committed in minimizing the negative effects generated by transport (e.g., accidents, greenhouse gas emissions, air pollution, noise and environmental effects) and has been promoting low-carbon mobility solutions and its impact to economic growth and jobs in the EU.
Efficient transport services and infrastructure are crucial for all regions of the EU.
The EC communications "A European Strategy for Low-Emission Mobility" (adopted in July 2016) and "Europe on the Move" (31 May 2017) present measures with the aim to enable a transition towards low and zero emission mobility. In particular, the areas on which Commission initiatives will focus are:
• digital mobility solutions;
• fair and efficient pricing in transport (which should better reflect negative externalities of transport);
• promotion of multi-modality;
• an effective framework for low emission alternative energy; • roll-out infrastructure for alternative fuels;
• interoperability and standardisation for electromobility; • improvements in vehicle testing;
• a post-2020 strategy for all means of road transport, supported by research efforts and investment.
Transport infrastructure quality
Since the global economic crisis, the EU has been suffering from low levels of investment and maintenance in transport, especially in road and rail, infrastructures. This has led to a degradation on the state of roads and consequently, an increase in the risks of accidents, and also an increase of congestion, noise and pollutant emission levels in many EU countries.
Policies should take into account the fact that EU countries have different infrastructure needs. According to (European Commission, 2018), given the regional specificities and
ICT towards low carbon and sustainable mobility
A multiscale perspective
21 the EU countries is the index of satisfaction with transport infrastructure quality (Figure
1). Figure 1 shows that the overall satisfaction with transport infrastructure is the lowest in the Central and Eastern European countries, (which includes Romania), and the highest for e.g., Spain, Finland, France and the Netherlands. Within the CISMOB partnership regions, Spain and Sweden are quite similar in these four components, with exception for the quality of the railroads, where Spain presents higher levels of satisfaction. In particular, in terms of infrastructure quality of roads, for instance, Portugal belongs to the top 3 along with the Netherlands and France, presenting higher levels of satisfaction when compared to several other countries including Denmark, Germany, Finland, Sweden, UK or Spain.
Figure 1 Satisfaction with infrastructure quality (2016-2017)
Source: World Economic Forum, The Global Competitiveness Report database 2016-2017. Scale from 1 [extremely underdeveloped] to 7 [extensive and efficient by international standards]. The countries were ranked on their overall performance on transport infrastructure.
EU has a financial mechanism to support infrastructure networks and the largest part of the funding should be assigned to:
• developing the European rail network (EUR 1.8 billion);
• decarbonising and upgrading road transport and developing intelligent transport systems (EUR 359.2 million);
Portugal and Romania are two of the 15 EU countries that benefit this funding for the period 2014-2020.
22
5G CONNECTED BIKE: a new way for data gathering
The world’s first 5G connected bike is a project from Urban ICT Arena in Kista, Sweden. Through the innovative use of information and communication technologies, a bike equipped with sensors to measure, for instance:
• humidity, • UV radiation,
• noise and air pollution, • particulates,
can be an important source for collecting traffic-related effects data.
The 5G connected bike coupled with a Raspberry Pi version 3 computer board running Rasbian allows to serve as a rolling wireless LAN access point, HTTP server, data center, Bluetooth device, and Internet of Things platform with the ability to use any number of sensors.
Moreover, incorporating a 4G dongle, it can be used with a 4G network.
Having a bike with sensors allows to collect data right on where vulnerable road users are passing by.
ICT towards low carbon and sustainable mobility
A multiscale perspective
23
U-BIKE: a step forward to soft mobility
Universities are workplaces involving many thousands of people and the usage of private car in the campuses is a problem in terms of congestion and pollutant emissions. In an attempt to promote soft mobility habits, U-Bike Portugal is a platform where a bike can be allocated to a member of the academic community.
This good practice aims to:
1. promote the use of electrical and conventional bicycles in academic communities; 2. contribute for the reduction of primary energy consumption;
3. contribute for the reduction of greenhouse gases;
4. modification of the modal split in urban transport, namely the transfer of the motorized individual mode of transport to the cycling mode.
Through the U-Bike platform, one has the possibility of renting one of the 3234 bicycles (2096 electric and 1138 conventional) for a large time period (semester or year).
For instance, in the University of Aveiro (Portugal), 46% of the community uses private car. Within the U-Bike Project, as an incentive, the University of Aveiro provides healthy breakfast and showers for those students which use the bicycle as transport to the campus.
In the Aveiro Region, it is estimated that such bicycles will travel around 2.5millions km along 26 municipalities, which corresponds to saving almost 170tonnes of oil equivalent and a consequent reduction of more than 500tonnes of CO2 equivalent.
24
Congestion levels
The main external costs of transport are those linked to greenhouse gas emissions, local air pollution, congestion, capacity bottlenecks, accidents and noise. Traffic congestion on roads not only increases the fuel consumption but consequently leads to increase in carbon dioxide emissions, outdoor air pollution as well as increase in the exposure time of the passengers and vurlnerable road users. For instance, in 2015, in the EU at least 33% of the final energy consumption and 24% of greenhouse gas emissions (which represents 23% more greenhouse gas emissions than in 1990) were derived from transport (European Commission, 2018).
A possible indicator to compare the situation in terms of congestion levels among the EU countries can be derived by measuring the hours spent by cars in road congestion every year (Figure 2). The countries with the highest congestion levels include Malta (more than 75 hours spent in road congestion annually), UK (more than 40 hours), and Romania (more than 30 hours), while the countries with the smallest congestion levels include Finland and Sweden. Portugal presents higher levels of congestion with approximately 28 hours spent in road congestion annually, when compared with Spain (around 25 hours), or Sweden (around 20 hours).
Figure 2 Average annual hours spent in congestion per vehicle (2015)
Data source: European Commission, Joint Research Centre, based on TomTom data. No data available for Cyprus. For methodological reasons, the data for Malta are of limited comparability with the ones for the other countries studied.
There is the need to improve the efficiency in the use of urban transport infrastructure. One possible way is through time-differentiated congestion charging, which have proven to be effective in limiting peak-hour congestion, but currently, its application on EU roads is marginal. Another tool for fostering a more efficient use of roads (not only in terms of congestion, but also in terms of environmental and air pollution and road safety) can be using the full capabilities of available technologies. This is one of the objectives of the CISMOB project: promote innovative ways to reduce carbon footprint and increase sustainability by improving the efficiency in the use of urban transport infrastructure through ICT.
ICT towards low carbon and sustainable mobility
A multiscale perspective
25
Improving Public Transport Management
Public transport can be made more efficient by using innovative and ICT systems for public transport management (PTM). For instance, an innovative and complex PTM system was implemented in the city of Timisoara, in Romania, under responsibility of RATT – Societatea Transport Public Timisoara (Timisoara Public Transport Company). This system involves two major components: integrated e-ticketing and Automatic Vehicle Location by GPS (AVL). The e-ticketing system is implemented with contactless cards, which are easy to use and allow the implementation of a flexible and efficient tariff policy, while providing the possibility to monitor public transport usage and passenger flows. The AVL transmits information from individual vehicles over a digital link via GPRS connection to the Control Centre of RATT.
The most important subsystems of AVL are: 1. fleet management;
2. real-time passenger information on board and in stops; 3. passenger counting;
4. communication network; 5. fuel consumption monitoring.
Thus, RATT is able to managing an integrated PTM system for its fleet of buses, trolley-buses and trams providing real-time information on-board and in stops and e-ticketing. Timisoara is able to efficiently manage public transport with an investment of around 4Million EUR.
By implementing this type of PTM systems, public transport becomes more efficient, convenient and accessible for everyone.
26
Alternative fuels
Alternative fuels are another way to reduce the negative impacts of both passenger transport, - private and public - and freight transport in terms of environment- and health- harmful emissions.
In EU, there is being an increasing trend of alternative fuel vehicles, such as electricity, hydrogen fuel cells, natural gas, etc..
Figure 3 shows the share of battery electric vehicles (BEV) and plug-in electric vehicles (PEV) in new passenger car registrations for the year 2016. The Netherlands (around 5%) and Sweden (around 3%) present the highest shares for PEVs, while France and Austria have the highest share of BEVs (both countries present more than 1%). Within the CISMOB partnership regions, Portugal has approximately 0,5% share of PEVs and 0,5% of BEVs, while Spain and Romania have the lowest shares for both PVEs and BEVs (less than 0,25%). According to (European Commission, 2018), it is also possible to see that in most countries there is a clear relationship between the incentives offered and an increase in the number of greener vehicles.
Figure 3 PEV market share in new passenger cars (M1) registrations (2016)
Source: European Alternative Fuels Observatory.
ICT towards low carbon and sustainable mobility
A multiscale perspective
27
How crowded is the public transport?
Crowding in public transport is becoming a growing concern as demand grows. Crowding information is related to the level of load capacity of the public transport (e.g., bus, metro, train).
From passenger’s perspective, it is expected that experienced crowding leads to increased dissatisfaction, and thus, deteriorating the experience in commuting in this mode of transport and influencing decisions on whether to use public transport in further trips.
In Stockholm, Sweden, in a pilot project, real-time crowding information is displayed to metro users, which enables them to know in real-time the load of the metro, and then, decide which one they will choose to proceed with their trip. During the pilot, it was estimated that 25% of the passengers noticed, understood and considered the provided information useful.
The implementation of this practice consists in having the information in two formats: visual (an overhead screen) and vocal (through speaker system).
The information is collected by an officer stationed in the previous station that will evaluate the metro train load in 3 levels: low, average and high.
The whole system is estimated to require an investment around 3100EUR per month.
highlights
28
Environmental impact
The continuous increase of vehicle fleet along with the development of road transport networks has associated a wide range of externalities. Main types of externalities refer to environmental impact, expressed as degradation of air quality, greenhouse gas emissions, increased threat of global climate change, degradation of water resources, and noise; social impact, expressed as quality of people life, human health, and economic impact, expressed as economic growth. Current development of road transport promotes a growing interest for sustainable and eco-friendly transport worldwide (European Commission, 2018).
However, road transport presents the highest share of CO2 emissions in the transport
sector, and thus, EU countries have to made efforts to mitigate this impact.
Road charging systems on European roads vary in terms of network coverage, charge levels and other conditions, which poses, for instance, administrative burden. Current systems do not necessarily take into account the environmental impact of vehicles. Thus, a more efficient tolling scheme is needed.
Transport fuel taxes can have effects in terms of a more sustainable use of cars and/or alternative fuels. Concerning fuels tax rates, there is a very significant difference across EU countries. However, for almost all EU countries diesel is taxed less than petrol. The following figure illustrates the share of transport environmental taxes w.r.t. total taxation.
ICT towards low carbon and sustainable mobility
A multiscale perspective
29 Figure 4 shows the transport environmental taxes as % of total taxation for the year 2015.
A first observation is that the share of environmental taxes in total transport taxation reflects in general, a small component of the taxation system, meaning that it does not properly address transport externalities. Higher environmental taxes are applied in Malta and Denmark.
Current fuel taxes in the EU vary substantially across member states. An increase in fuel prices can result in a decrease in fuel and transport demand, and greenhouse gas emissions. Fuel taxation is a potential instrument for reducing emissions from transport, representing the best charge structure for internalising climate change related externalities (EEA, 2017b). The European Commission is aiming to achieve fair and efficient pricing of transport, which implies that transport charges should aim to reflect the external costs of transport. However, to date fuel taxation is not generally used to internalise the environmental externalities of transport, possibly because high fuel tax is often politically unviable. However, fuel taxes are not the only way towards fair pricing. For example, charging per kilometre or vehicle regulations could be some effective measures (EEA, 2017b).
Within the CISMOB partnership regions, Romania and Portugal have higher transport taxes, while Spain and Sweden have lower. In terms of the environmental tax component, Romania and Spain have similar lower shares, when compared to Portugal, which has the highest environmental tax component within the CISMOB regions.
Besides taxation and charges such as "user pays" and "polluter pays" principles, according to EC, measures that can address transport negative externalities consist in:
• deploying clean fuels for transport; • deploying intelligent transport systems; • setting efficiency standards for vehicles; • sharing best practices (including eco-driving); • encouraging the use of collective transport.
These measures are part of the Communications "A European Strategy for Low-Emission Mobility" and "Europe on the Move", where, for instance, new CO2 standards for cars and
vans after 2020 are proposed, as well as an action plan to boost investment in alternative fuel infrastructure and develop a network of fast and interoperable recharging stations.
30
Urban ICT Arena: opening new possibilities of digitalization
Urban ICT Arena is an open co-creation arena and testbed in Kista, Sweden.
With Urban ICT Arena, Kista can be regarded as a cluster for the development and demonstration of innovative solutions that benefit society.
Urban ICT Arena was created envisaging a cooperation between industry, academia and public sector and it consists of a massive IT-infrastructure, display window, meeting arena, project place and various projects and project participants.
The overall purpose of Urban ICT Arena is to help develop tomorrow’s sustainable cities, boost innovation and secure jobs for the future. In particular, it has three objectives:
• Developing sustainable cities (foster more ICT-based solutions for urban sustainability challenges than there are at present resulting in both greater impact and lower costs),
• Boosting innovation (One aim of Urban ICT Arena is to secure and strengthen the capability to support innovation processes and to support SMEs and start-ups in developing ICT-based products and services.) and
• Securing the jobs of tomorrow (One of the long-term aims of Urban ICT Arena is to advance the region and prepare it for new future demands).
For instance, one of the projects within the Urban ICT Arena is with electric self-driving shuttle buses, which is the first test in Sweden of autonomous vehicles on public roads (Autopiloten Kista). On average, more than 200 people travel on the bus every day. Other project is the 5G NotBoring Connected Bike.
ICT towards low carbon and sustainable mobility
A multiscale perspective
31
Social impact
The past decades showed evidence linking transport, particularly motorised road transport, with damage to human health as a direct consequence of road accidents and exposure to pollutant and noise emissions (European Commission, 2018). Thus, transport can impact society in terms of heath issues through various ways, including:
• road traffic injuries and deaths, • noise pollution,
• air pollution.
Road Accidents
Road traffic accidents in the Member States of the EU claim about 26.100 lives and leave more than 1.4 million people injured (around 2900 per day) in 2015. The following figure illustrates the annual number of fatalities, injury accidents and injured people in EU for the period 2016-2015.
Figure 5 Annual number of fatalities, injury accidents and injured people in EU between 2016-2015
32
It can be observed a reduction around 40% in the fatalities in this period, but in terms of injury accidents, the reduction is more slightly, not reaching the level of 20%.
Figure 6 shows the share of fatalities by road type in the EU for the year 2015. A closer look on the type of road permits to conclude that in EU, in 2015, more than half of the fatalities occurred in rural roads.
Figure 6 Share of fatalities by road type in the EU for the year 2015
SOURCE: https://ec.europa.eu/transport/road_safety/sites/roadsafety/files/pdf/statistics/dacota/aar2017_infographics.pdf
Road traffic noise
The impacts of exposure to high levels of environmental noise include annoyance, stress reactions, sleep disturbance, poor mental health and well-being, as well as negative effects on the cardiovascular and metabolic system (World Health Organization, 2011), (European Commission, 2015). Environmental noise causes approximately 16 600 premature deaths in Europe each year, with almost 32 million adults suffering from annoyance and over 13 million suffering sleep disturbance. The WHO has identified noise as the second most significant environmental cause of ill health in western Europe, the first being air pollution.
Noise pollution is a major environmental health problem in Europe, and road traffic i sone of the most contributors. However, railways, air traffic and industry are also important sources of noise.
ICT towards low carbon and sustainable mobility
A multiscale perspective
33 The following figures show the estimated number of people in Europe who are exposed
to levels of environmental noise that are above noise indicator levels. Here, Lden represents the Long-term average indicator designed to assess annoyance and defined by the Environmental Noise Directive (END), it refers to an annual average day, evening and night period of exposure with an evening weighting of 5 dB(A) and a night weighting of 10 dB(A); Lnight is the Long-term average indicator defined by the END and designed to assess sleep disturbance and it refers to an annual average night period of exposure.
Figure 7 Number of people exposed to average day-evening-night noise levels in EU-28 (Lden) ≥ 55 dB
SOURCE: "Population exposure to environmental noise"
https://www.eea.europa.eu/downloads/5c9bbb02e71247e586deb718c858e9cb/1532009381/assessment-2.pdf
It is estimated that approximately 104 million people in the EU-28 are exposed to high Lden noise levels (annual average day, evening and night exposure to noise) from road traffic, which is also an importante source of noise at night-time with almost 60 million people exposed to high noise levels.
34
Figure 8 Number of people exposed to night-time noise in EU-28 (Lnight) ≥ 50 dB
Road traffic air pollution
Vehicle emissions from burning petrol and diesel include particulate matter (PM10 and PM2.5), and nitrogen dioxide, carbon monoxide and other gases. Exposure to particulate matter can lead to chronic respiratory and cardiovascular diseases, some cancers and low birthweight, while Nitrogen dioxide is associated with acute respiratory effects such as asthma symptoms, especially in children (Beelen, R.; Rasschou-Nielsen, O.; Staffogia, M.; Andersen, 2014; Hoek, G.; Krishnan, R.M.; Beelen, R.; Peters, 2013; Jacquemin, B.; Sunyer, J.; Forsberg, B.; Aguilera, 2009; Pedersen, M.; Giorgis-Allemand, L.; Bernard, C.; Aguilera, 2013; Stafoggia, M.; Cesaroni, G.; Peters, A.; Andersen, 2014).
The transport sector is a very important source of greenhouse gases within the EU and the largest contributor to NOX emissions, accounting for 46% of total EU‑28 emissions in
ICT towards low carbon and sustainable mobility
A multiscale perspective
35 real-life driving conditions are often higher, especially for diesel vehicles, than those
measured during the approval test.
Transport also contributed to 13% and 15% of total PM10 and PM2.5 primary emissions, respectively, in the EU‑28 in 2014.
In 2014, about 16% of the EU‑28 urban population was exposed to PM10 above the EU daily limit value (i.e., 50 μg/m3 not to be exceeded on more than 35 days per calendar year, for short-term exposure). Regarding PM2.5 exposure, about 8 % of the EU‑28 urban population was exposed to levels above the target value set by the Ambient Air Quality Directive (EU, 2008) to be 25 μg/m3 annual mean.
The following figure shows the 3-year averaged concentrations from measurements at all urban and suburban background stations. This 3-year running mean of PM2.5 concentrations is calculated as the average over all operational urban or suburban background stations within a Member State in the period 2012–2014.
Figure 9 Urban and suburban background PM2.5 concentrations presented as 3-year averages in the EU‑28 (2012–2014), as an approximation of the average exposure indicator
36
It can be observed that the average urban concentrations in 2012–2014 were above 20 μg/m3, which is the legally binding level for exposure concentration.
From Figure 9, the results for CISMOB Partnership Regions show Sweden, followed by Portugal and Spain present average values below 10, while Romania levels are rather close to 17 μg/m3.
ICT towards low carbon and sustainable mobility
A multiscale perspective
37
Solar powered e-paper display for real-time public transport information
Promoting the use of public transport may help in decreasing traffic congestion and air pollution in urban areas. Moreover, providing reliable and real-time updated information to public transport users is important to making users able to manage their personal mobility.
For instance, in the city of Coimbra, Portugal, the Municipality applied for funding for the project “Informação em tempo real” (Real Time Information), in order to be able to implement real time information panels for public transport.
SMTUC - Serviços Municipalizados de Transportes Urbanos de Coimbra (Urban Transport Municipal Services of Coimbra) are responsible for providing real-time public transport information displayed in several bus stops through solar powered e-papers, which allow energy savings. There is a total of 32 panels, being 5 of them indoor panels specially conceived to provide real time public transport information on the surroundings of buildings such as hospital, school, commercial or transport interfaces.
The panels consist in a solar powered e-paper technology that shows in real time the waiting time until the next buses, and their respective line.
The buses have installed a GPS that communicates with a platform real time location. An open data platform will also be implemented.
It is estimated that each solar powered e-paper panel costs around 3.500EUR.
highlights
38
General overview
Bearing in mind the current situation of transport in EU, this means that the current transport system might not be sustainable and needs to be adjusted. Promoting a shift to low emission mobility and addressing negative externalities is one the main objectives of the EC.
Adjustment of infrastructure to new mobility patterns (e.g., alternative fuels) require new investments and a different approach to the (re-)design of networks. Despite a good provision of infrastructures, there exist European countries with high levels of road congestion. This situation reinforces the need of an efficient and sustainable transport system that requires integration of different modes of transport, including equipment for traffic management and innovative technologies, and appropriate pricing for the use of infrastructure.
ICT tools play a key role in minimizing transport-related externalities. Digital technologies play a crucial role for creating a multimodal transport system. Cooperative intelligent transport systems (C-ITS) allow road users and traffic managers to share information and use it to coordinate their actions. The deployment of intelligent transport systems for road and its interface with other modes varies across Europe.
There is a strong commitment of all EU countries in the deployment of intelligent transport systems for road and its interface with other modes. In this light, EC is committed in reducing CO2 emissions, congestion and air pollution to improve the quality
of life of European citizens and to reach the goals set by the Paris Agreement. Multimodality can have an important role in reducing such transport externalities. Thus, EC set the year 2018 to be the “Year of Multimodality” and the EC is promoting the importance of multimodality for the EU transport system, by proposing a set of legislative and policy initiatives. In particular, the key thematic areas include:
- Digitalisation with focus on digital corridor information systems and multimodal travel information and ticketing;
- The use of economic incentives to promote multimodality;
- Support to multimodal infrastructure and innovation, physical and digital; - The promotion of 'active mobility' integrated with other modes in particular,
ICT towards low carbon and sustainable mobility
A multiscale perspective
39
Trafiklab: Providing Public Transport Information
Trafiklab is an open data platform providing access to data on public transport in Sweden, making data and information available to every potential user. Trafiklab platform gathers multiple data information about transports in Sweden and make it available, so that users can develop and share smartphone app’s. There exist many different API’s (Application Programming Interfaces which make it possible for developers to use routines or data that is outside their code), among which one can point: 1) ResRobot - Trip Planner (public transport schedules in Sweden and their geographic location); 2) Traffic State SL 2 / Trafikverket open API (traffic conditions); 3) SL (Storstockholms Lokaltrafik AB) Real Time Information (real time information on buses, subways, commuter trains, local trains and boats in Stockholm).
The main goals of this good practice are: 1) Make all traffic data in Sweden available; 2) Share APIs to foster transportation sector entrepreneurship; 3) Share to the population all the apps created; 4) - Increase the usage of public transport. Trafiklab functions as a socio-technical value-creating mechanism, primarily for third-party developers. There are however, some challenges in creating a public transport open data platform since it requires to engage public transport companies regarding innovation and open data benefits, and collaboration and common priorities among a wide range of stakeholders.
Nowadays, most travelers have access to a mobile device with an internet connection, which allows instant access to information about delays and keep their personalized timetable updated regarding public transport. The public transport open data platform enables that public transport can be used more efficiently by its users and attract new users. Political willingness to work with open data is crucial and enables transparency and diffusion of public transport information.
40
A closer look at the Transport Sector within the CISMOB
Partnership
Modal Split for Passenger Transport
All countries within the CISMOB partnership record a high use of passenger cars (European Commission, 2018). In 2015, car trips represented more than 80% of the passenger-kilometres travelled for Portugal and Sweden, which are both above the EU average. Romania presents the lowest. Regarding the use of buses and coaches, Portugal records a lower use along with Sweden than the EU average, while Spain and Romania present higher shares. Despite the importance of rail transport, its share in the modal split in Spain, Portugal and Romania is still low comparing to the EU average, while Sweden records higher use of railways. In terms of use of tram and metro, Portugal presents the lowest, while Romania records a high use, representing more than two times more than the EU average.
Table 2 Modal split for passenger transport in 2015
Passenger cars Buses and coaches Railways Tram and metro
ES 79.9 11.7 6.6 1.8
PT 88.5 6.3 4.1 1.1
RO 74.8 14.5 4.3 6.3
SE 81.7 7.2 9.3 1.8
EU-28 81.3 9.4 7.6 1.8
(%-shares based on passenger-kilometres)
Evolution of Alternative fuels in Road Transport
All countries within the CISMOB partnership present very different BEV, PHEV and CNG shares (European Commission, 2018). A first observation we can make is that the shares in Sweden are by far higher than the remaining countries. All these countries present a significant growth trend in the share of PHEVs, more evident in 2015-2016. The share of alternative-fuelled cars in total sales in Spain is smaller than in Portugal or Sweden. With respect to Portugal and Romania, the number of electric charging points has been increasing and well as the number of alternative-fuelled cars is increasing. However, the number of new passenger cars using alternative fuels remains below 1% of the overall
ICT towards low carbon and sustainable mobility
A multiscale perspective
41 An evident point is that CNG cars, which share recorded approximately 0,40%, are no
longer being registered. ES
PT
RO
SE
Figure 10 Alternative fuel passenger cars market share for the period 2011-2016
SOURCE: EUROPEAN ALTERNATIVE FUELS OBSERVATORY (BEV = battery electric vehicle; PHEV = plug-in hybrid electric vehicle; CNG = compressed natural gas).
42
Competitiveness Performance
The Global Competitiveness Index (GCI) (Schwab, 2017) tracks the performance of 137 countries on several pillars of competitiveness. The idea behind this index is to provide a multidimensional measure of economic/innovation development to help decision makers understand the complex nature of the development challenge; to design better policies, and to take action to economic progress. Different pillars and subpillars are considered; for instance, it encompasses perspectives in terms of innovation, quality of infrastructures, technological readiness and a more complex issue such as diversion of public funds.
The Global Competitiveness Report (Schwab, 2017) provides a ranking for each one of the 137 countries. The report defines “competitiveness as the set of institutions, policies, and factors that determine the level of productivity of an economy, which in turn sets the level of prosperity that the economy can achieve”. The GCI establishes a common framework to measure the ability to provide sustained economic growth and well-being, allowing decision makers to monitor their annual progress presenting an index that is a position from 1-137, being the rank of the country compared to the rest of the world. The following table presents the rankings of GCI 2017–2018 for Spain, Portugal, Romania and Sweden.
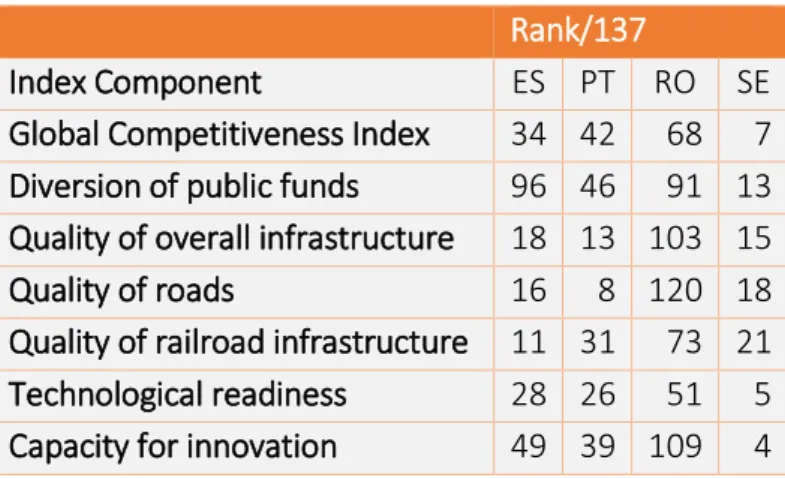
Table 3 Global Competitiveness Index 2017-2018 for the countries within the CISMOB Partnership
Rank/137
Index Component ES PT RO SE
Global Competitiveness Index 34 42 68 7
Diversion of public funds 96 46 91 13
Quality of overall infrastructure 18 13 103 15
Quality of roads 16 8 120 18
Quality of railroad infrastructure 11 31 73 21
Technological readiness 28 26 51 5
Capacity for innovation 49 39 109 4
The results provided in this table suggest Sweden outperforms other countries, with GCI equals to 7, while Romania presents compelling results.
ICT towards low carbon and sustainable mobility
A multiscale perspective
43 Spain is at position 34, followed by Portugal at 42. Romania is practically in the middle of
the ranking. Regarding subpillars “Diversion of public funds” and “Capacity for innovation”, Sweden and Portugal present the best results, being at the top 50 and 40, respectively. Spain presents a compelling result in terms of “Diversion of public funds”. It can be observed that Portugal has better quality of overall infrastructures, followed by Sweden. In particular, Portugal has very good quality of roads, while Spain presents better results in terms of railroads. In terms of “Technological readiness”, Spain and Portugal are practically at the same level, while Sweden is at the top 5, along with “Capacity for innovation” subpillar.
The following figure shows the competitiveness performance of CISMOB Partnership Regions in terms of scores.
Figure 11 Competitiveness performance of CISMOB Partnership Regions in terms of scores
SOURCE: (Schwab, 2017)
Using a scale from 1 to 7, the final score for each subpillar is more informative for policymakers as a guide to action. In essence, the score may be a better indication of the
44
direction of change, allowing to policymakers understand the drivers of competitiveness and then, evaluate, adjust, or develop strategies and policies accordingly.
There are evident differences within the CISMOB partnership. The first observation we can make is that Romania is by far the country that is falling behind others in all subpillars of competitiveness. On the other hand, Sweden presents high-level results, recording in practically all subpillars a level of 5 or more. Comparing the scores for Portugal and Spain, it can be observed that Portugal outperforms Spain in all the analysed subpillars, except for the quality of railroads. In fact, these scores allow one to conclude that Spain has better quality of railroads than other of these countries. In case of “technological readiness”, higher scores are reported for Sweden, followed by Portugal and Spain with very similar levels. Concerning the level of technological readiness, Romania presents a good score, while for the remaining subpillars the levels remain relatively low.
ICT towards low carbon and sustainable mobility
A multiscale perspective
45
Fully integrated innovative electric mobility model
Electric mobility has playing a crucial role to move towards low carbon mobility solutions. Portugal is one of the first countries in the world to have an integrated policy for electric mobility and a charging network for Electric Vehicles with national coverage.
The MOBI.E electric mobility model is a fully integrated and totally interoperable system, multi‐retailer and multi‐operator.
In practice, it is a national electric mobility system that allows any individual the access to any provider of electricity in any charging point explored by any service operator. This ensures transparency, low entry barriers and competition along the value chain, and runs under a business and service model that takes advantage on the growing importance of electricity produced with basis on renewable energy.
Charging systems such as MOBI.E allows an open access, fully interoperable system, able to integrate different players of the service value chain. MOBI.E enables the integration of several electric mobility electricity retailers and charging service operators into one single system, thus stimulating competition.
The central management system, with a dedicated layer for full compatibility, makes it possible to integrate any charging equipment from any manufacturer and to connect to multiple systems from third parties.
Hence, MOBI.E allows any user to charge any vehicle in any location without any worries for technical compatibility, by using a single subscription service and authentication mechanism. At the same time, it allows full transparency for all stakeholders and the generation of multiple market‐based opportunities with different business models.
46
There are available three types of charging stations:
1. normal (3,7 kWh, 6-8 hours for 100% of the battery capacity); 2. semi-fast (22 kWh, 1 hour for 80% of the battery capacity) and 3. fast (20-30 minutes for 80% of the battery capacity).
MOBI.E consists in a network composed by 600 charging stations in Portugal, initially the charge had no costs, but a tariff is now being tested.
The MOBI.E system relies on a comprehensive IT management platform that interconnects all stakeholders around a well defined service value chain, through the integration of all information, energy and financial fluxes, ensuring transparency, service integration, competition and reinforced management capability for all stakeholders. Some of the system’s main features include:
1. Real‐time monitoring of charging points, including charging status and vacancy information
2. Remote monitoring of the charging process
3. Web‐based multi‐platform access: PC, PDA, cell phone
4. Integrated invoicing with supplementary services: Parking, public transports, domestic electricity, personal and business accounts.
Since its implementation, it is estimated: • almost 5.5 thousand users,
• more than 4GWh of energy consumed, • almost 500 thousand chargings
ICT towards low carbon and sustainable mobility
A multiscale perspective
47
ITS TOWARDS MORE EFFICIENT AND SUSTAINABLE
MOBILITY
CISMOB main vision is to take full advantage of ICT to improve the efficiency in the use of urban transport infrastructure. During the first phase of the project, partners were able to learn good practices of sustainable management of urban transport taking advantage of ICT.
Intelligent Transport Systems (ITS) applications help cities to achieve policy goals with regard to accessibility, livability and safety. New advances in technology have increased the possibilities of using ITS and traffic management in urban environments.
Specifically, ITS are applications of advanced sensor, computer electronics and communication technologies which, without embodying intelligence as such, aim to provide innovative services relating to different modes of transport and traffic management and enable various users to be better informed and make safer, more coordinated, and ‘smarter’ use of transport networks. ITS applications include telematics and all types of communications in vehicles, between vehicles (e.g., vehicle-to-vehicle), and between vehicles and fixed locations (e.g., vehicle-to-infrastructure) (Eline & Teije, 2015).
48
Figure 12 ITS categories and subcategories
SOURCE: CIVITAS WIKI consortium civ_pol-not6_its_web (Eline & Teije, 2015)
Managing urban traffic can be considered a challenge, especially in an era where cities are expected to grow, leading to an increase in traffic demand. Figure 13 illustrates the reasons why it is complex to deploy ITS in urban areas. In particular, these characteristics are key factors when selecting measures.
ITS and traffic management approaches can lead to positive effects on the experience of travelling, in particular with significant impacts in terms of reducing travel times, air pollution and fuel consumption, and increasing road safety. For instance, real time information on eco-friendly modes of transport such as walking, cycling and public transport, can influence change to more sustainable modes, whilst optimizing control settings of traffic signals can reduce fuel consumption and emission of pollutants. EC with the ITS Directive (2010/40/EU) gave the necessary legal framework to their member states to accelerate the implementation of smart technologies in transport sector, giving the freedom to each country to decide their priorities (Urban ITS Expert Group, 2013). Available ITS tools vary in technologies applied, from basic management systems such as car navigation and traffic signal control systems to more advanced applications that enables the use of real-time data and involve various technologies, such as: software and sensor technologies, wireless communications, computing technologies; floating car data/floating cellular data and sensing technologies (Yen & Lyoen, 2012).
ICT towards low carbon and sustainable mobility
A multiscale perspective
49
Figure 13 Important characteristics of urban traffic
50
In essence, the idea of using ITS applications is to minimise road traffic-related environmental impacts and improve road safety, being a key element in reducing carbon footprint, as well as increasing the sustainability on an urban scale. This can be achieved by considering:
• Optimal use of road traffic and travel data, • Network efficiency and minimise congestion, • Enhance modal integration.
The following table presents insights that can be used to help in the initial selection of ITS and traffic management measures to meet local conditions of mobility characteristics, challenges and policy goals (Marsili et al., 2017).
Table 4 ITS and traffic management measures deployment and benefit KPIs
Deployment KPIs description definition calculation
Automated speed detection/ Information gathering infrastructures / equipment Length and % of road network type covered
Road based on ITS
infrastructures/equipment (sensors, cameras, FCD) enabling speed detection, and traffic, weather and emissions monitoring. Data collected can be used for traffic measures and information services.
KPI = (kilometres of road network type equipped with information gathering infrastructures / total kilometres of same road network type) x 100 Dynamic Public Transport Traveller Information % of road / transport network type covered Or Number and % of urban, inter-urban and/or rural public transport stops
Information on up-to-date estimates of public transport services such as arrival time, delays or cancellations. It can also include information on multimodal interchanges nodes. Such information can be displayed on public transport stops through variable message signs or via apps.
KPI = (kilometres of transport network type with provision of dynamic travel information Services / total kilometres of same transport network type) x 100 KPI = (number of transport nodes with provision of dynamic travel information Services / total number of same transport