Pressure Sensors for Electronic Devices
Vera Filipa Barbosa das Neves Gonçalves
Dissertation presented to obtain the degree of
Doctor in Chemical and Biological Engineering
by the
University of Porto
Supervisor:
Adélio Miguel Magalhães Mendes, Associated Professor
Co-Supervisors:
Lúcia Raquel Brandão, Post-Doc Researcher Sérgio Reis Cunha, Assistant Professor
Paulo Ferreira dos Santos, Coordinator at Kinematix
LEPABE - Faculty of Engineering University of Porto
____
Kinematix – Making Sense of Body Dynamics Porto, 2014
“Valeu a pena? Tudo vale a pena se a alma não é pequena.” Fernando Pessoa
Acknowledgments
I would like to acknowledge financial support of the Portuguese Foundation for Science and Technology (FCT) and Kinematix (former Tomorrow Options) for my PhD grant (Ref. SFRH/BDE/33880/2009). I would also like to thank LEPABE, DEQ and FEUP for giving me the conditions to accomplish my work.
My thankful words go to my supervisors Professor Adélio Mendes, Dr. Lúcia Brandão and Professor Sérgio Cunha for all the helpful weekly discussions. I would like to thank Prof. Adélio for always finding time for me, supervision and support, to Dr. Lúcia Brandão for her patience during discussions and to Prof. Sérgio Cunha for his vision. I would like to also acknowledge Professor Fernão Magalhães for helpful discussions.
I would like to express my gratitude to Dr. Paulo Ferreira dos Santos for the opportunity of working in business environment and for helpful discussions. I want to thank to Eng. João Neiva for guidance and fundamental support in the development of my work.
Many thanks to my labmates, for their friendship and support: Margarida Catarino, Alfredo Tanaka, Paula Oliveira, Yoann Leydet, Isabel Mesquita, Ana Catarina Duarte, Paula Dias, Diana Dias, Sandra Rodrigues, Sofia Félix, Daniel Ferreira and Cecilia Pedrero. I want to thank with a special word to my friend Joana Ângelo for the affection and for listen to me. My recognition to D. Fátima Faustino through her help with bureaucratic questions.
To all my friends, thank you for your support and advice. A special thanks to Sara Ascenção and Sílvia Coelho for the fundamental support in my life.
I want to thank my family, my parents Alcindo e Teresa for all the love, support, advices and for always being there for me, a special word to my brother Daniel for being an inspiration for me, a special thanks to my sister-in-law Sandra and finally a
feel alone.
My last gratitude goes to António for the patience, comprehension and love. Thank you for all your love and for making me truly happy.
Preface
The present work was developed in a cooperation protocol between FEUP (Faculty of Engineering of University of Porto) and Kinematix (former Tomorrow Options-Microelectronics S.A.) and the PhD grant (Ref. SFRH/BDE/33880/2009) in industrial environment supported by the Portuguese Foundation for Science and Technology (FCT) and Kinematix.
Kinematix is a start-up specialised in designing innovative electronic devices with a main focus on medical applications. The company’s first product was Walkinsense, a medical device designed to monitor and assess lower human limb movement. Nowadays, this company designs, develops and markets electronics portable systems to monitor the movements of people or their body parts during activities in all environments. There are different types of commercial pressure sensors, but from all off-the-shelf models tested by Kinematix, only one brand has demonstrated adequate strength, with the remaining showing significant degradation of their parameters over use. The dependence of this situation led Kinematix to promote the development of pressure sensors for medical applications, mainly in order to produce a simple, robust and low cost solution. Therefore, the objective of the present work is the development and manufacture of a new pressure sensor (lightweight, highly flexible, cheap, robust and elastic) based on electrically conductive polymer composites (ECPCs).
This thesis comprises different papers, which were submitted for publication during the development of the PhD research work.
i
Abstract
The present work targets the development of a simple, robust and low cost piezoresistive pressure sensor, with minimum hysteresis and drift, to respond between 0 to 50 N·cm-2; the electrodes should preferentially be made of the same material of the sensor and have an electrical conductivity 100 to 1000 times higher than the sensor (negligible electrical resistance).
Electrically Conductive Polymer Composites (ECPCs) assembled with polymeric electrodes to form a pressure sensor were developed and studied. The ECPCs prepared were based on dense and on porous polymer matrices of polydimethylsiloxane (PDMS) and polyetherblockamide (PEBA) incorporating conductive particles. The influence of the way the electrodes were bonded to the ECPC, casted or glued at the edges, on the electrical resistance measurements was addressed. The author concluded that the type of electrodes used to measure the piezoresistive response largely influences the electrical response of the ECPCs. Different types of electrodes originated different electrical responses to the pressure. The electrical resistance of the ECPCs changes with the type of the electrodes mainly due to the roughness present on the ECPC surface where among the materials tested only polymeric electrodes casted on the ECPC provide an effective electrical contact.
Pressure sensors based on dense polymer matrices incorporating carbon black assembled with polymeric electrodes casted on the ECPC presented no piezoresistive response despite their good adhesion and strength.
Porous ECPCs were also developed once the porosity of the ECPC is directly related to the performance of the pressure sensor. Porous PDMS matrices were prepared by the foaming and emulsion methods while porous PEBA matrices were prepared by the phase inversion method. The phase inversion method allowed the
ii
symmetric morphology that showed to be very promising for preparing porous ECPCs. Different conductive particles were incorporated on the porous polymeric matrix. When using carbon black, the matrix obtained was dense due to the addition of hydrophobic particles. Silver, spherical and lamellar zinc presenting hydrophilic characteristics were also incorporated and in this case the PEBA polymer matrix remained porous. A piezoresistive response was observed for the porous PEBA ECPCs assembled with casted polymeric electrodes incorporating silver and lamellar zinc although with poor mechanical properties due to the high concentration of metals incorporated (approximately 50 vol.%).
Graphene platelets were also incorporated on porous PEBA matrix due to the similar morphology with the lamellar zinc but with a significantly smaller density. PEBA 4033 polymer was mixed with five different graphene platelets: grade H5, grade MX (M5, M15 and M25) and grade C–750. A porous morphology was obtained for the ECPCs prepared with the graphene platelets grade MX and H5 while for the grade C– 750 only a dense ECPC was obtained. The ECPC incorporating 15 vol.% of graphene M5 assembled with casted polymeric electrodes exhibited a piezoresistive response more linear in a log-log plot than the other grades of graphene platelets. The results confirmed the potential of a porous PEBA 4033 matrix with the incorporation of graphene as pressure sensor but some limitations were detected as hysteresis and drift response after compression. Crosslinked PEBA 4033 and the incorporation of carbon black were considered to improve the mechanical properties but significantly worse piezoresistive responses were observed.
The influence of the polymeric electrodes on the piezoresistive response was tested after being casted or glued to different ECPCs. The ECPCs pressure sensors assembled with glued polymeric electrodes exhibited a linear piezoresistive response in a log-log plot while the others prepared with casted polymeric electrodes exhibited a nearly flat profile. Results indicated that the glued polymeric electrodes influence
iii
ECPC while the casted polymeric electrodes induced a negligible pieozoresistive effect due to the formation of a very good electrical contact with the ECPC. Moreover, the dense ECPCs assembled with polymeric electrodes glued at the edges to the ECPC exhibited both low hysteresis and drift.
iv
Resumo
O presente trabalho visa o desenvolvimento de um sensor de pressão piezoresistivo simples, robusto e de baixo custo, com o mínimo de histerese e de acondicionamento, com uma resposta de 0 a 50 N·cm-2; os elétrodos devem ser feitos preferencialmente do mesmo material do sensor e devem ter uma condutividade elétrica de 100 a 1000 vezes mais elevada do que o sensor (resistência elétrica desprezável).
Sensores de pressão baseados em compósitos poliméricos eletricamente condutores (ECPCs) ligados com elétrodos poliméricos foram desenvolvidos e estudados. Os ECPCs baseiam-se em matrizes poliméricas densas ou porosas de polidimetilsiloxano (PDMS) e poliéter-bloco-amida (PEBA) com a incorporação de partículas condutoras. A influência da forma como os elétrodos foram ligados ao ECPC, fundido ou colado nas bordas, nas medições de resistência elétrica foi abordada. Concluiu-se que o tipo de elétrodos utilizados para medir a resposta piezoresistiva influencia em grande parte a resposta elétrica dos ECPCs. Diferentes tipos de elétrodos originaram respostas elétricas à pressão diferentes. A resistência elétrica dos ECPCs alterou com o tipo de elétrodos, principalmente devido à rugosidade presente na superfície do ECPC onde entre os materiais testados apenas os elétrodos poliméricos fundidos no ECPC proporcionam um contato elétrico eficaz.
Os sensores de pressão baseados em matrizes poliméricas densas incorporando negro de fumo com elétrodos poliméricos fundidos no ECPC não apresentaram resposta piezoresistiva apesar de sua boa aderência e robustez.
ECPCs porosos também foram desenvolvidos uma vez que a porosidade do ECPC está diretamente relacionada com o desempenho do sensor de pressão. Foram preparadas matrizes porosas de PDMS utilizando o método de formação de espuma e
v
utilizando o método de inversão de fase. Este método permitiu a preparação de filmes porosos de PEBA com uma estrutura nodular, altamente porosa e com uma morfologia simétrica que se mostrou muito promissora para a preparação de ECPCs porosos. Várias partículas condutoras foram incorporadas na matriz polimérica porosa. No entanto, utilizando o negro de fumo, a matriz obtida não é porosa devido à adição das partículas hidrofóbicas. Por sua vez, prata, zinco esférico e zinco lamelar que apresentam características hidrófilas permitiram a obtenção da matriz de polímero PEBA porosa. Uma resposta piezoresistiva foi observada para os ECPCs baseados na matriz polimérica porosa PEBA com os elétrodos poliméricos fundidos incorporando prata e zinco lamelar embora com propriedades mecânicas fracas devido à elevada concentração de metais incorporados (cerca de 50 % vol.).
Plaquetas de grafeno foram também incorporadas na matriz polimérica porosa de PEBA devido à morfologia semelhante com o zinco lamelar mas que apresenta uma densidade bastante inferior à do zinco. PEBA 4033 foi misturada com cinco plaquetas de grafeno diferentes: H5, MX (M5, M15 e M25) e C - 750. Uma morfologia porosa foi obtida para os ECPCs preparados com as plaquetas de grafeno MX e H5 enquanto para a classe C - 750 apenas ECPCs densos foram obtidos. O ECPC incorporando 15 vol.% de grafeno M5 com elétrodos poliméricos fundidos exibiram uma resposta piezoresistiva mais linear (escala log – log) do que os outros tipos de plaquetas de grafeno. Os resultados confirmam o potencial de uma matriz porosa de PEBA 4033 com a incorporação de grafeno como sensor de pressão, mas foram detetadas algumas limitações como histerese e acondicionamento na resposta do sensor após a compressão. A reticulação da matriz PEBA 4033 e a incorporação de negro de fumo foram consideradas para melhorar as propriedades mecânicas mas foram observadas respostas piezoresistivas significativamente piores.
A influência dos elétrodos poliméricos na resposta piezoresistiva foi testada depois destes serem fundidos ou colados aos diferentes ECPCs. Os sensores de
vi
linear (escala log - log) enquanto que os ECPCs preparados com elétrodos poliméricos fundidos exibiram um perfil quase plano. Os resultados indicaram que os elétrodos poliméricos colados influenciam a resposta de resistência elétrica devido a uma alteração no contacto com a interface do ECPC enquanto os elétrodos poliméricos fundidos apresentam uma resposta pieozoresistiva insignificante devido à formação de um bom contacto elétrico com o ECPC. Além disso, os ECPCs densos com elétrodos poliméricos colados nas bordas do ECPC exibiram uma baixa histerese e boa repetibilidade.
vii
Contents
Abstract ... i
Resumo ... iv
Contents ... vii
Figure Captions... xiv
Table Captions ... xx
C
HAPTERI
1
Introduction ... 2
1.1 Pressure Sensors ... 5 1.2 Sensors Types ... 6 1.3 Polymer Matrix ... 81.3.1 Dense Polymer Matrix ... 9
1.3.2 Porous Polymer Matrix ... 9
1.4 Electrically Conductive Polymer Composites Sensors ...18
1.4.1 Percolation Theory ... 18
1.4.2 Piezoresistive Effect ... 19
1.5 Motivation and thesis outline ...21
1.6 References ...23
C
HAPTERII
2
Electrically Conductive Polymer Composites - Experimental ... 30
viii
2.2 Experimental ...31
2.2.1 Materials and Methods ... 31
2.3 Characterization ...37
2.3.1 Electrical Resistance ... 37
2.3.2 Mechanical Resistance ... 38
2.3.3 Dynamic Mechanical Analysis (DMA) ... 40
2.4 Conclusions ...41
2.5 References ...42
C
HAPTERIII
3
Development of pressure sensors based on dense electrically
conductive polymer composites ... 46
3.1 Introduction ...47
3.2 Materials ...48
3.3 Preparation of Electrically Conductive Polymer Composites ...48
3.3.1 Dispersion of the conductive fillers ... 49
3.3.2 Preparation of PDMS films ... 50
3.3.3 Preparation of PEBA films ... 50
3.4 Characterization ...50
3.4.1 Measurement of Electrical Resistance ... 50
3.4.2 Measurement of Mechanical Resistance ... 51
ix
3.5.1 Effect of conductive particles on mechanical resistance ... 52
3.5.2 Electrical Resistance ... 55
3.6 Conclusions ...66
3.7 References ...67
C
HAPTERIV
4
Development of dense and porous matrices for polymer-based
pressure sensors ... 72
4.1 Introduction ...73
4.2 Experimental ...76
4.2.1 Materials ... 76
4.2.2 Preparation of dense PDMS based ECPCs incorporating non-conductive particles ... 76
4.2.3 Preparation of porous PDMS films ... 77
4.2.4 Preparation of porous PDMS films (Foaming method “b”) ... 77
4.2.5 Preparation of porous PDMS films using porogene agent ammonium carbonate (Foaming method “c”) ... 78
4.2.6 Preparation of porous PDMS films by the emulsion methods ... 79
4.2.7 Preparation of dense PEBA films ... 81
4.2.8 Preparation of dense PEBA ECPCs incorporating non-conductive particles .. 81
4.2.9 Preparation of porous PEBA films by the immersion precipitation method .. 81
4.3 Characterization of PDMS and PEBA films ...83
x
4.3.3 Measurement of Electrical Resistance ... 83
4.4 Results and discussion ...84
4.4.1 Incorporation of non-conductive particles in the dense polymer matrices ... 84
4.4.2 Porous PDMS films ... 87
4.4.3 Porous PEBA films ... 91
4.5 Conclusions ...95
4.6 References ...95
C
HAPTERV
5
Development of porous polymers-based pressure sensors ... 102
5.1 Introduction ...103
5.2 Experimental ...104
5.2.1 Materials ... 104
5.2.2 Preparation of porous PDMS ECPCs by the emulsion method ... 105
5.2.3 Preparation of porous PEBA 4033 ECPCs by the immersion precipitation method ... 106
5.2.4 Preparation of crosslinking of porous PEBA 4033 ECPCs ... 108
5.3 Characterization of PDMS and PEBA based ECPCs ...108
5.3.1 Scanning Electron Microscopy (SEM) ... 108
5.3.2 Measurement of Electrical Resistance ... 108
5.4 Results and discussion ...108
5.4.1 Incorporation of carbon black in PDMS ECPCs ... 108
xi
5.4.4 Incorporation of metallic particles in PEBA 4033 ECPCs ... 114
5.4.5 Piezoresistive response on porous PEBA 4033 ECPCs ... 116
5.4.6 Crosslinking of porous PEBA 4033 incorporating 44 vol.% of lamellar zinc . 118 5.5 Conclusions ...119
5.6 References ...120
C
HAPTERVI
6
Development of porous polymer pressure sensors incorporating
graphene platelets ... 124
6.1 Introduction ...125
6.2 Experimental ...126
6.2.1 Materials ... 126
6.2.2 Preparation of porous PEBA 4033 ECPCs by immersion precipitation method ... 127
6.2.3 Crosslinking of porous PEBA 4033 ECPCs ... 129
6.3 Characterization of PEBA 4033 ECPCs ...130
6.3.1 Scanning Electron Microscopy (SEM) ... 130
6.3.2 Measurement of Electrical Resistance ... 130
6.3.3 Dynamic Mechanical Analysis (DMA) ... 130
6.4 Results and discussion ...131
6.4.1 Incorporation of graphene platelets in PEBA 4033 ECPCs with different combinations of non-solvent/solvent pair ... 131
xii
with graphene platelets ... 135
6.4.4 Hysteresis and drift of M5-ECPC ... 137
6.4.5 Dynamic Mechanical Properties ... 138
6.4.6 Crosslinking of the porous M5-ECPC ... 141
6.4.7 Introduction of carbon black in porous M5-ECPCs ... 142
6.5 Conclusions ...144
6.6 References ...144
C
HAPTERVII
7
Interface contact pressure sensors based on ECPCs ... 148
7.1 Introduction ...149
7.2 Experimental ...152
7.2.1 Materials ... 152
7.2.2 Preparation of ECPCs based on polymer PEBA 4033 ... 152
7.2.3 Preparation of the dense polymeric electrodes ... 153
7.3 Characterization of ECPCs ...153
7.3.1 Measurement of Electrical Resistance ... 153
7.4 Results and discussion ...154
7.4.1 Piezoresistive response of the ECPCs assembled with the polymeric electrodes glued at the edges ... 154
7.4.2 Reproducibility of ECPCs assembled with the polymeric electrodes glued at the edges ... 155
xiii
7.5 Conclusions ...162 7.6 References ...163
C
HAPTERVIII
xiv
Figure Captions
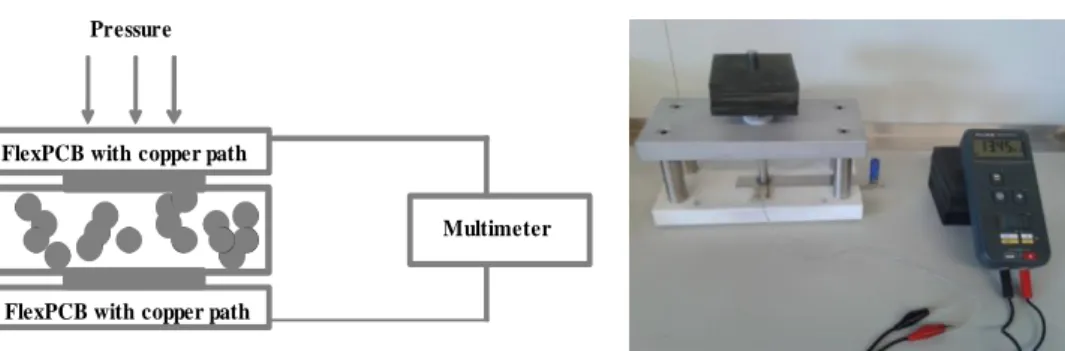
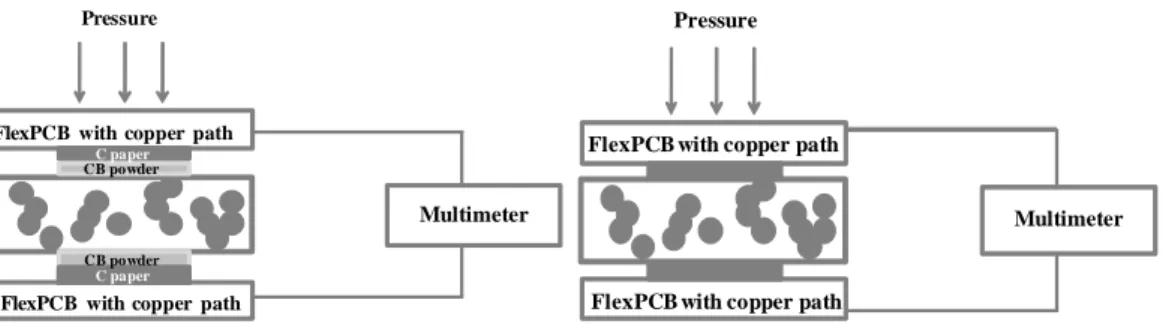
Figure 1.1 - WALKiNSENSE device [6]. ... 4 Figure 1.2 - Formation of conductive paths in polymer by applying pressure (adapted from [9])... 5 Figure 1.3 – FlexiForce® Sensor construction (adapted from [5]). ... 7 Figure 1.4 - Peratech® pressure sensor (adapted from [12]). ... 8 Figure 1.5 – Water in oil emulsion...12 Figure 1.6 – Structural representation of P-123. ...13 Figure 1.7 – Structural representation of SDS. ...13 Figure 1.8 - Schematic of the immersion precipitation process (P: polymer, S: Solvent, NS: non-solvent), (adapted from[20] [38]). ...15 Figure 1.9 – Schematic representation of a ternary phase diagram ( I- homogeneous solution, II- liquid-liquid demixing, III-gelation, 1 and 2 are possible coagulation phases)(adapted from [20]). ...16 Figure 2.1 - Structural representation of PEBAX (adapted from [6]). ...31 Figure 2.2 – Chemical structure of polydimethylsiloxane (PDMS). ...33 Figure 2.3 - Experimental set-up for measurement of electrical resistance of the ECPCs. ...38 Figure 2.4 - Experimental set-up for measurement of mechanical resistance. ...40 Figure 2.5 - Experimental set-up for measurement of dynamic mechanical properties – DMA. ...41
xv
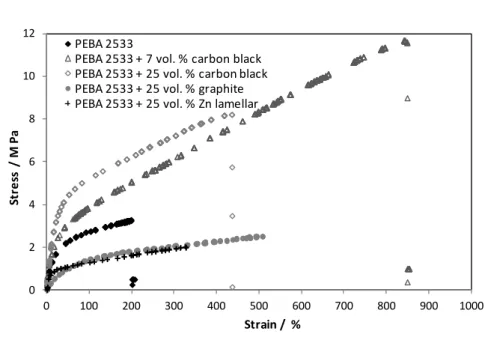
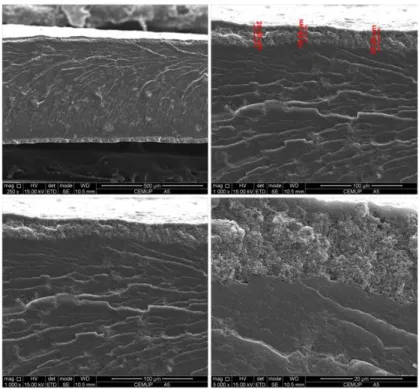
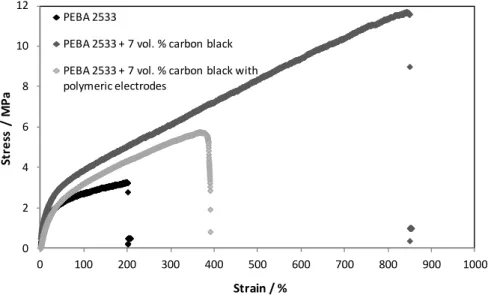
(left – type a electrodes, right – type b electrodes). ...51 Figure 3.2 - Stress-strain curve of pristine PEBA 2533 film and loaded with different electroconductive particles. ...54 Figure 3.3 - Stress-strain curve of pristine PDMS film and loaded with carbon black. .54 Figure 3.4 – Electrical resistivity (log value) of PEBA 2533/CB ECPCs for different carbon black concentrations assembled with type a electrodes. ...57 Figure 3.5 - Electrical resistance as a function of the applied pressure of dense ECPC film based on PEBA 2533 incorporating 7 vol.% of carbon black, thickness 150 μm, assembled with type a electrodes. ...58 Figure 3.6 - Electrical resistance as a function of the sensor element thickness type b electrodes; element sensor of PEBA 2533 containing 10 vol.% of carbon black and 1.5 N·cm-2 of applied pressure. ...60 Figure 3.7 - Electrical resistance (log value) of sensor PEBA 2533/CB ECPCs as a function of applied pressure assembled with different electrode configurations: (type 0, type a, type b, type c, type d, type e and type f). ...62 Figure 3.8 - SEM images of the cross-section of PEBA 2533 film (Z1) containing 7 vol.%
of carbon black assembled with type b electrodes (PEBA 2533 incorporating 25 vol.% of carbon black(Z2)). ...63
Figure 3.9 – SEM images of the cross-section of PEBA 2533 film incorporating carbon black assembled with type b electrodes. ...63 Figure 3.10 - Electrical resistivity (log value) of PEBA 2533/CB ECPCs for different carbon black concentrations assembled with different electrodes: (a: type a and b: type b). ...64
xvi
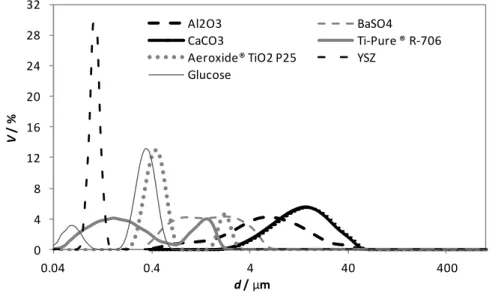
film based on PEBA 2533 incorporating 7 vol.% of carbon black, thickness 150 μm, assembled with different types of electrodes. ...65 Figure 3.12 – Stress-strain curve of PEBA 2533 films without and with the type b electrodes. ...66 Figure 4.1 - Particle size distributions measured for different non-conductive particles. ...84 Figure 4.2 - Electrical resistance of PMDS film incorporating carbon black and TiO2
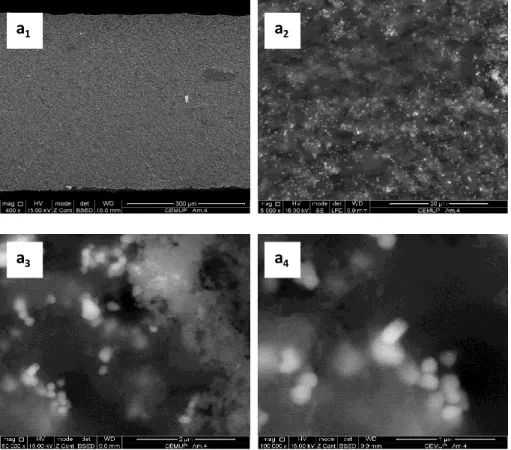
assembled with polymeric electrodes. ...85 Figure 4.3 - Cross-section SEM images of PDMS films incorporating carbon black and TiO2: a1 - magnification 400x, a2 – magnification 5000x, a3 – magnification50 000x and
a4 - magnification 100 000x. ...86
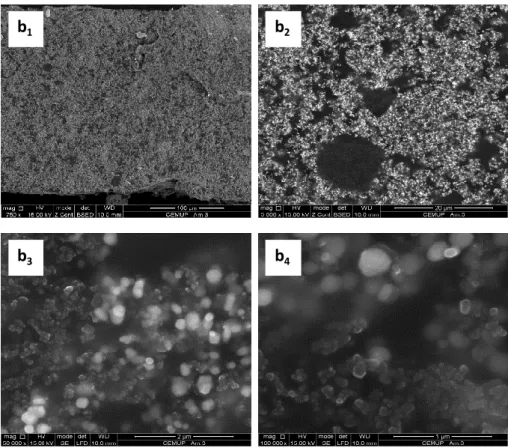
Figure 4.4 - Cross-section SEM images of PEBA 2533 films incorporating carbon black and TiO2: b1 - magnification 750x, b2 – magnification 5000x, b3 – magnification50 000x
and b4 - magnification 100 000x. ...87
Figure 4.5 - SEM images of cross-section of the films: (a) Pristine PDMS, (b) PDMS + 10 wt.% Pluronic P123 , (c) PDMS + 5 wt.% (NH4)2CO3 ( 25 °C ), (d) PDMS + 5 wt.% H2O (4
wt. % P123) , (e) PDMS + 5 wt.% H2O ( 4 wt.% SDS), (f) PDMS + 5 wt.% H2O + 4 wt.%
butanol. ...90 Figure 4.6 - SEM images of top surface and cross-section of the films: f1 - PDMS/H2O+
butanol cross-section in high magnification (1000x), f2 - PDMS/H2O+butanol
cross-section in high magnification (5000x) and f3 - PDMS/H2O + butanol top surface. ...91
Figure 4.7 - Cross-section SEM images of different PEBA 2533 films (see Table 4.5). ..93 Figure 4.8 - Cross-section SEM images of different PEBA 4033 films (see Table 4.5). ..94
xvii
vol.% of carbon black, (b) PDMS with 6 vol.% of carbon black and (c) PDMS with 8 vol.% of carbon black. ...109 Figure 5.2 - Cross-section SEM images of PEBA films: (a) PEBA 2533 with 5.5 vol.% of carbon black (10 wt.% of polymer concentration), (b) PEBA 4033 with 5.5 vol.% of carbon black (10 wt.% of polymer concentration), (c) PEBA 4033 with 5.5 vol.% of carbon black (7 wt.% of polymer concentration) and (d) PEBA 4033 with 5.5 vol.% of carbon black (5 wt.% of polymer concentration). ...111 Figure 5.3 - Cross-section SEM images of PEBA 4033 films: (a) PEBA 4033 with 5.5 vol.% of carbon black (non-solvent: ethanol) (b) PEBA 4033 with 5.5 vol.% of carbon black (non-solvent: hexane/acetone) and (c) PEBA 4033 with 7.5 vol.% of carbon black (non-solvent: hexane/acetone). ...113 Figure 5.4 - Cross-section SEM images of PEBA 4033 films: (a) PEBA 4033 with 40 vol.% of silver particles, (b) PEBA 4033 with 50 vol.% of spherical zinc and (c) PEBA 4033 with 44 vol.% of lamellar zinc. ...115 Figure 5.5 - Electrical resistance as a function of the applied pressure of PEBA 4033 film incorporating 40 vol.% of silver nanoparticles assembled with polymeric electrodes. ...117 Figure 5.6 – Electrical resistance as a function of the applied pressure of PEBA 4033 film incorporating 44 vol.% of lamellar zinc assembled with polymeric electrodes. ..118 Figure 5.7 – Electrical resistance as a function of the applied pressure of unmodified and crosslinked PEBA 4033 loaded 44 vol.% of lamellar zinc films assembled with polymeric electrodes. ...119 Figure 6.1 - PEBA 4033 films obtained after the immersion precipitation method (left image: porous plain PEBA 4033 film, right image: porous PEBA 4033 film incorporating graphene platelets). ...128
xviii
with 5.5 vol.% M5 at different magnifications and different non-solvents: film (a) - non-solvent: water, film (b) - non-solvent: water, film (c) - non-solvent: ethanol and film (d) - non-solvent: hexane/acetone. ...132 Figure 6.3 - Cross-section SEM images of the ECPCs (films d and e) incorporating 15 vol.% of graphene with different types: film (d) – C–750 and film (e) - H5. ...133 Figure 6.4 - Cross-section SEM images of the ECPCs (films f-h) incorporating 15 vol.% of graphene MX: film (f) – M5,film (g) –M15 and film (h) - M25. ...134 Figure 6.5 – Cross-section in high magnification of ECPCs (film e and f) incorporating 15 vol.% graphene with different types: (left) –M5 and (right) –H5. ...135 Figure 6.6 - Electrical resistance (log-log plot) as a function of the applied pressure of ECPCs based on PEBA 4033 loaded with 15 vol.% of graphene (type M5, M15, M25 and H5) assembled with polymeric electrodes. ...136 Figure 6.7 - Electrical resistance as a function of the applied pressure (load and unload steps) of ECPC based on PEBA 4033 loaded with 15 vol.% of graphene M5 assembled with polymeric electrodes. ...138 Figure 6.8 - E’ (log scale) as a function of temperature for: i) pure dense PEBA 4033 film, ii) pure porous PEBA 4033 film, iii) porous M5-ECPC, iv) porous M15-ECPC, v) crosslinked porous M5-ECPC and vi) porous M5/carbon black-ECPC. ...139 Figure 6.9 - Tan δ as a function of temperature for: i) pure dense PEBA 4033 film, ii) pure porous PEBA 4033 film, iii) porous M5-ECPC, iv) porous M15-ECPC, v) crosslinked porous M5-ECPC and vi) porous M5/carbon black ECPC. ...141 Figure 6.10 - Electrical resistance (log-log plot) as a function of the applied pressure of unmodified and crosslinked M5-ECPC assembled with polymeric electrodes. ...142
xix
M5/carbon black-ECPCs assembled with polymeric electrodes. ...143 Figure 6.12 - Cross-section SEM images of M5/carbon black-ECPC. ...143 Figure 7.1 - Experimental set-up for measuring of the electrical resistance of the ECPCs (left –electrodes casted, right – electrodes glued at the edges). ...154 Figure 7.2 – Electrical resistance as a function of the applied pressure of ECPCs assembled with polymeric electrodes: a) castes on both surfaces: PorousG15 and b) glued at the edges on the both surfaces: PorousG8CB2, PorousG10CB5 and DenseCB6.5. ...155 Figure 7.3 - Electrical resistance as a function of the applied pressure of PorousG8CB2 assembled with glued polymeric electrodes for two samples. ...156 Figure 7.4 - Electrical resistance as a function of the applied pressure (load and unload steps) of PorousG10CB5 assembled with glued polymeric electrodes. ...157 Figure 7.5 - Electrical resistance as a function of the applied pressure (load and unload steps) of PorousG8CB2 with glued polymeric electrodes. ...158 Figure 7.6 - Electrical resistance as a function of the applied pressure (load and unload steps) of DenseCB6.5 assembled with glued polymeric electrodes. ...159 Figure 7.7 - Electrical resistance as a function of the applied pressure (load and unload steps) of CPS sensor and DenseCB6.5 sensor assembled with glued polymeric electrodes before and after 3 days under pressure. ...161 Figure 7.8 - Electrical resistance as a function of the applied pressure (load and unload steps) of DenseCB6.5 sensor assembled with glued polymeric electrodes before (a)) and after (b)) 3 days under pressure. ...162
xx
Table Captions
Table 1.1 – Some techniques for synthesis of porous polymer films (adapted from [22]). ...10 Table 1.2 – Surfactants classification (adapted from [33]). ...12 Table 1.3 – Combination of solvent/non-solvent pairs (adapted from [20]). ...17 Table 2.1 – The most important properties of PEBA (adapted from [6]). ...32 Table 2.2 – Properties of PDMS Dehesive ° 920 (adapted from [18]). ...34 Table 2.3 – Properties of Sylgard 184 (adapted from [19]). ...35 Table 3.1 – Different prepared dense ECPCs. ...49 Table 3.2 - Young’s modulus, ultimate tensile strength and ultimate strain for carbon black filled ECPCs and pristine elastomers. ...53 Table 3.3 - Electrical resistivity (ρ) of different films prepared with 7 vol.% filler content assembled with type b electrodes (Solvent used for PDMS films: THF, solvent used for PEBA films: NMP or butanol)...56 Table 3.4 - Electrical resistivity (ρ) of a film PEBA 2533 containing 7 vol.% concentration of the carbon black for an applied pressure of 1.5 N·cm-2 assembled with different electrodes configurations. ...62 Table 4.1 – Different methods used to prepare PDMS films. ...77 Table 4.2 – Composition of the PDMS films prepared by the foaming method “b” (P-123). ...78 Table 4.3 – Composition and pre-polymer cure temperature of the PDMS films prepared by the foaming method “c”. ...79
xxi
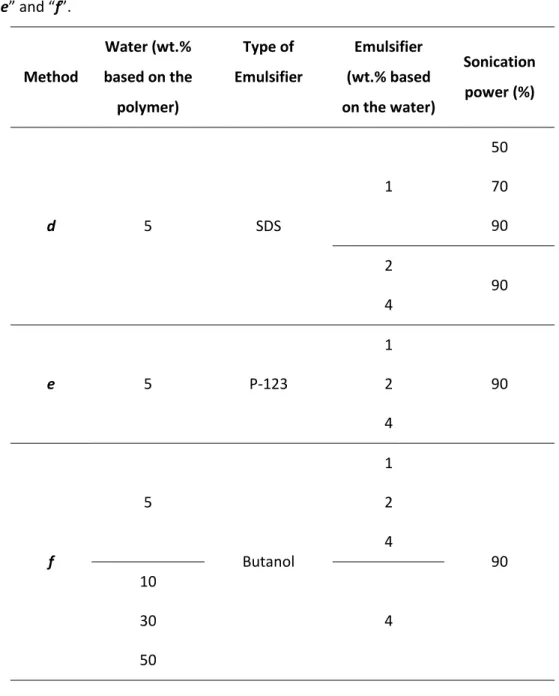
“e” and “f”. ...80 Table 4.5 – Compositions of the PEBA films by immersion precipitation method. ...82 Table 5.1 – Composition of PDMS films incorporating carbon black particles. ...105 Table 5.2 – Porous PEBA based ECPCs tested. ...107 Table 6.1 – Porous PEBA 4033 ECPCs incorporating graphene platelets. ...129 Table 6.2 – Mechanical properties of the prepared polymer films. ...140
2 Chapter I
1 Introduction
The diabetic foot is a disease that affects the hind limbs of patients suffering from diabetes mellitus (DM). These patients often suffer biomechanical changes that lead to overpressure areas of the lower limbs and due to the also typical loss of sensation (the pain is an alarm) tend to develop pressure ulcers. The treatment of these ulcers is long lasting due to circulatory problems and frequently lead to the need of limbs amputation [1-3]. More than 371 million of people have diabetes. International Diabetes Federation indicates that half of people who die from diabetes are under the age of 60. In 2012, 471 000 million USD were spent due to this type of pathology [4].
The clinical treatment of the pressure ulcers is done by the use of footwear adapted to the conditions of each patient. For this it is important to measure the plantar pressure distribution and even to develop tools of feedback to alert the patient to dangerous levels of pressure. There are some technologies that allow measuring the plantar pressure distribution such as: force/ pressure plates and in-shoe systems [5]. Force plates measure the patient barefoot and therefore only have relevance for morphological analysis, not taking into account the effect of the interaction between the foot and shoe, which is the source of development of ulcers. On the other hand, in-shoe systems measure the pressure inside the shoe, but most systems are mainly targeted for use in laboratory or research and not adequate for the current demands of clinical work: simplicity and speed of use, providing enough relevant information dynamically as it is during the walk that the effects of pressure causing damage.
The WALKiNSENSE developed by Kinematix, former Tomorrow Options (Figure 1.1) is a device, targeted specifically for the use of clinicians that deal with lower limbs
Chapter I 3
biomechanical or postural disorders, composed by a unit that monitors simultaneously the human lower limb movement together with the plantar pressure in 8 spots of the foot insole. The device measures the walking speed and the consequent effect from it is variation on the plantar pressure measurements, which is essential to evaluate, for example, the effect of customised footwear or orthotics on the patients’ plantar pressure distribution, allowing a reliable and fast analysis of patients without a serious conditioning of his walking patterns. To analyse and compare the plantar pressure effects of footwear through in-shoe and dynamic assessment, it is necessary to use a similar walking speed, eliminating it is effect [6].
WALKiNSENSE allows gathering the clinical site information necessary to design, for example, customised footwear (shoe, insole, or both) to minimise the conditions that lead to the onset of ulcers, in foot of diabetic patients. On the other hand, it allows the immediate evaluation of the effects of the developed footwear, assessing if the mechanical behaviour is or is not the pretended. Often clinicians don’t count with results that dynamics provoke on forces intensity and directions, neither with the reactions of patients’ bodies when their plantar pressure is changed. So, eventually some corrections or adjustments are needed to get an optimal result, and if not done immediately it can lead to harmful effects [6].
Besides, WALKiNSENSE can be used for orthopaedics, neurology, cardiology and podiatry activities, when assessing or changing patients biomechanics is relevant [6].
4 Chapter I
Figure 1.1 - WALKiNSENSE device [6].
There are different types of commercial pressure sensors and 3 main manufacturers worldwide that produce them (IEE (Luxembourg), Interlink (USA) and Tekscan (USA)), but from all models tested by Kinematix, only one brand has demonstrated adequate strength, with the remaining showing significant degradation of their parameters over use. The dependence of Kinematix on a single producer led this company to search for support at FEUP for developing their own pressure sensor solution.
The aim of the present work is then the development and characterization of a new pressure sensitive device based on a non-conductive polymer matrix containing conductive particles or a conductive polymer. The sensor should be lightweight, highly flexible, cheap and elastic and should be very resistant to compression (low hysteresis and drift effect) but mainly to the shear forces observed in the insole of shoes. The electrodes (electrical contacts) should be made with the same material to avoid stress and delamination of the contact area (mechanically robust). The electrodes should have an electrical conductivity 100 to 1000 times higher than the sensor (negligible electrical resistance) and should exhibit a very good adhesion to the sensor. On the
Chapter I 5
other hand, this sensor can not be influenced by temperature and humidity due to the ambient conditions in shoe.
1.1 Pressure Sensors
Polymer films play an essential and growing role in sensors. Recent advances in polymer science and film preparation have made polymer films useful, practical and economical in a wide range of sensor designs and applications. Further, the continuing miniaturization of microelectronics favors the use of thin polymeric films in sensors [7]. Pressure sensors are devices that show a variation in electrical conductivity when a force is applied. Polymer-based pressure sensors can be made of a non-conductive polymer matrix containing conductive particles or one blend of a conductive polymer [7-8].
When pressure is applied to the polymer-based sensor, the conducting particles or conductive polymer come in contact with each other and a conducting path is formed. Figure 1.2 sketches the formation of conductive paths in a composite polymer film when applying pressure.
Figure 1.2 - Formation of conductive paths in polymer by applying pressure (adapted from [9]). conductivepath pressure sensor element electrode sensor device
6 Chapter I
1.2 Sensors Types
Nowadays, sensors are also involved in a myriad of applications fostered by developments in digital electronics and involving the measurement of several physical and chemical quantities in automobiles, medical products, personal computers and pollution control [10].
Pressure sensors are widely used in automotive, sport, and physiological monitoring applications. In recent years, the global market for electronic products has grown rapidly with products such as phones and automotive electronics. The common requirements for these electronics are ultra-low cost, lightweight, portability, small size, multi-functionality, and high performance. In sports, pressure sensors are also useful for example to assisting in teaching how to play golf, namely in what concerns the correct feet placement. Covering different foot regions with pressure sensors provides a simple way to monitor and assess weight transfer during the golf swing, which is an important factor influencing the quality of the swing [5]. For health applications, as mentioned previously, pressure sensors are used for measuring the plantar pressure distribution during walking. These sensors allow the evaluation of the foot disorders caused by e.g. diabetes [5].
The best-known brand of pressure and force measurement system is TEKSCAN® (Tekscan Inc, USA), which comprehends simple sensors up to a highly complex array of 100,000 sensors. Tekscan sensors are made of a conductive ink deposited on a flexible polyester substrate [5, 11]. The F-Scan® sensor consists of insoles for the evaluation of pressure during walk over the entire area of the foot [5]. FlexiForce® sensors, produced by Tekscan, are made of two layers of flexible polyester substrate. A silver layer is applied to the substrates, followed by a layer of pressure sensitive ink – see Figure 1.3. An adhesive is then used to laminate the two layers of substrate
Chapter I 7
together to form the force sensor. The electric contact is defined by the silver track on top of the pressure sensitive ink [5].
Figure 1.3 – FlexiForce® Sensor construction (adapted from [5]).
Peratech® sensors are ultra-thin pressure sensing technology. The sensor, Figure 1.4, is made of two layers of carbon ink electrodes (top and bottom substrate) with a silver track print. In the middle there is an adhesive layer to form the pressure sensor [12].
8 Chapter I
Figure 1.4 - Peratech® pressure sensor (adapted from [12]).
FlexiForce® and Peratech® pressure sensors are interface sensors because the electric resistance changes with the contact area within the sensor element.
1.3 Polymer Matrix
As mentioned before, polymer-based pressure sensors can be made of a non-conductive polymer matrix containing non-conductive particles or one blend of a conductive polymer. Different preparation processes and materials preparations have been studied. The polymer matrix should resist to the shear and compression forces as those observed in the insole of shoes.
Polymer matrix films can be classified, according to their morphology, as porous or dense. Dense polymer sensors are based on an interface sensor (electrical resistance dependent on the contact area), as the majority of commercial sensors [11, 13-15]. Recently, few studies report the development of porous polymer-based pressure sensors prepared by different methods without the influence of the contact area [16-19]. The effect of porosity on the sensor is directly related to the sensor’s response.
Adhesive layer
Carbon ink, silver track print
Chapter I 9
1.3.1 Dense Polymer Matrix
Dense films can be prepared by solution deposition (casting method) and extrusion. In the casting method, a polymer is dissolved in a solvent and the solution deposited on a support; the solvent evaporating leads to the formation of a dense film. In the case of the extrusion method, the thermoplastic polymers are melted and extruded, solidifying and forming dense films when cooled [20-21].
1.3.2 Porous Polymer Matrix
Porous films comprise a polymer matrix with pores. Hentze and Antonietti [22] review the most used methods for the synthesis of porous films. This review presents some examples of polymers matrices to obtain different pores sizes accordingly to the porogene used. Table 1.1 shows different techniques that have been studied for synthesis of porous polymer films.
10 Chapter I
Table 1.1 – Some techniques for synthesis of porous polymer films (adapted from [22]). Method Porogene Foaming Gases Solids Solvents Supercritical CO2
High internal phase emulsion Emulsions Phase separation
Solvents Thermally induced phase separation
(TIPS)
Air casting of a polymer solution Precipitation from the vapour phase
Immersion precipitation Other techniques
Mechanical stretching Mechanical deformation
Interparticular crosslinking Solvent
Foaming methods
Porous polymer films obtained by foaming methods use gases, solvents, solids or supercritical CO2 (scCO2) as porogenes. The porous structure in the polymeric films
Chapter I 11
increase. Gases, volatile liquids and scCO2 can be removed from the matrix after
obtaining the desired matrix morphology. ScCO2 can be used as a foaming agent to
generate pores in polymeric matrices [23-24].
Some solids are used as porogenes to create pores in the polymer matrix: sugar particles, ammonium hydrogen carbonate, sodium bicarbonate, among others. Sugar particles are incorporated into a polymeric matrix and after polymer curing can be dissolved and removed to induce the formation of pores in the polymer matrix [25]. Ammonium hydrogen carbonate is used as a gas foaming agent; the polymer matrix loaded with ammonium hydrogen carbonate is heated to induce matrix solidification and the formation of ammonia and carbon dioxide that originates the formation of pores [26-27]. On the other hand, the chemical reaction between sodium bicarbonate and citric acid, results in the generation of carbon dioxide that induces porosity formation in the polymer matrix. At 120 °C, sodium bicarbonate starts to decompose and more CO2 is produced due to the chemical reaction between the citric acid and
the sodium bicarbonate [28].
Emulsions methods
Emulsions methods (high internal phase emulsions) are dispersions of water in oil phase (Figure 1.5). The water is added very slowly with the help of a solution of a surfactant in the oil phase [29]. These surfactants are adsorbed on the surface of water droplets and create a physical barrier (interfacial film with viscoelastic properties), which prevents the coalescence of emulsion droplets. The emulsifier molecules are oriented in the interface of the active surface such that the polar hydrophilic groups are directed to the water while the hydrophobic non polar hydrocarbon chains are directed to the continuous phase (oil) [30-32].
12 Chapter I
The properties of the surfactant (e.g., fluidity, cohesiveness, etc.) often affect the overall characteristics of the emulsion (e.g., stability, droplet size, etc.). Surfactants are classified as anionic, cationic, non-ionic and amphoteric according to the ionic characteristics of the head, see Table 1.2.
Figure 1.5 – Water in oil emulsion.
Table 1.2 – Surfactants classification (adapted from [33]).
Ionic surfactants interact more strongly than non-ionic surfactants with non- ionic polymers. In fact, anionic surfactants have a higher affinity for non-ionic polymers than cationic surfactants. The interaction between non-ionic polymers and all types of surfactants is usually controlled by hydrophobic interactions [33].
Oil
Water
Surfactant
Hydrophilic Hydrophobic Classification
Non ionic Anionic Cationic Amphoteric _ + + _
Chapter I 13
One of the most important non-ionic surfactant used are Pluronic triblock copolymers (BASF) based on poly (ethylene oxide) (PEO) and poly (propylene oxide) (PPO). Due to the amphiphilic character (hydrophilic character of PEO and hydrophobic character of PPO), Pluronics show good behaviour as surfactant because they have compatibility and stability in the polymer matrix [34-35]. One of the most used is Pluronic P-123 (molecular weight of around 5800 au) that has the following general chemical formula, Figure 1.6:
Figure 1.6 – Structural representation of P-123.
In the case of anionic surfactant [29], one of the most usual for water in oil dispersion is sodium dodecyl sulphate (SDS) with the following general chemical formula, Figure 1.7: C H3 O S O O O -Na+
Figure 1.7 – Structural representation of SDS.
Anionic surfactants (SDS, for example) have good solubility in water and in organic solvents. The non-ionic surfactants (P-123, for example) have surface activity due to their polar structure. The hydrophilic properties are the result of the hydrogen bond between the oxygen atoms of the alcohol chain and the hydrogen atoms in the water molecules.
O
H CH2CH2O CH2CH(CH3)O CH2CH2O H
14 Chapter I
The ionic surfactants present at the interface of the droplets induce the appearance of electrical charges in the region and near the interface accumulate opposite charges. This mechanism is responsible for the electrostatic repulsion [33].
The most important factor to take into account to achieve good emulsion stability is the particle size obtained during the process of emulsion. The most important factors for process control are: emulsion method, amount of energy used to form droplets and surfactant efficiency. The surfactant has the function of reducing the interfacial tension between water and oil. The emulsion stability is also dependent on the physical characteristics of the interfacial film formed [30, 32-33].
As described above, water is used to create porosity in the polymer matrix. During the polymer cure, the porosity is obtained heating the sample loaded with water above the water boiling temperature; pores are formed due to water evaporation [29, 36-37].
Phase inversion method
On the other hand, porous films can be prepared by phase inversion method. Porous films obtained by phase inversion may be prepared by essentially four techniques: thermally induced phase separation (TIPS), air casting of a polymer solution, precipitation from the vapour phase and immersion precipitation [20, 38-40]. TIPS is a method where the polymer matrix is dissolved in a solvent and where the solvent is vacuum evaporated at low temperature. At the end, the solvent is removed by extraction, freeze drying or evaporation. In the air casting of a polymer solution, the polymer matrix is dissolved in a mixture of a volatile solvent and a less volatile non-solvent (typically water or alcohol). When the solvent evaporates, the solubility of the polymer decreases and phase separation begins. The non-solvent
Chapter I 15
must be completely incompatible with the polymer matrix because if compatible non-solvents are used, the precipitating polymer phase will contain residual solvent to allow polymer to flow and collapse as solvent and non-solvent evaporate. Precipitation from the vapor phase refers to the phase separation induced by the penetration of non-solvent vapour in the solution. Immersion precipitation method considers the induction of phase separation in a homogeneous polymer solution by immersing the solution in a non-solvent bath or exposing it to a non-solvent atmosphere (Figure 1.8). The polymer solution is immersed in a non-solvent bath and a solvent/non-solvent exchange leads to phase separation [20, 38, 40-41].
Figure 1.8 - Schematic of the immersion precipitation process (P: polymer, S: Solvent, NS: non-solvent), (adapted from[20] [38]).
In the immersion precipitation, the polymeric solution is precipitated into two phases: a liquid phase (low concentrated polymer) that forms the film pores and a solid phase (polymer rich) that forms the matrix film. The parameters that allow controlling the porosity of the films are: polymer concentration, nature of the solvent, casting temperature and time, coagulation time and temperature and time between casting and coagulation bath [38, 42]. It is very important that non-solvent be completely incompatible with the polymer matrix. The concentration of the polymer solution changes by solvent/non-solvent exchange, the mobility of the system decreases because the solvent concentration decreases. If the system gels and solidifies demixing the phase separation step a porous structure will be obtained. A
NS
glass plate NS
P + S S
16 Chapter I
phase diagram for mixtures of a polymer, a solvent and a non- solvent system is shown in Figure 1.9. The ternary phase diagram is divided into a homogeneous region, liquid-liquid demixing and gelation. The location of the demixing gap is determined by the interaction between polymer, solvent and non-solvent [20, 38, 41].
Figure 1.9 – Schematic representation of a ternary phase diagram ( I- homogeneous solution, II- liquid-liquid demixing, III-gelation, 1 and 2 are possible coagulation
phases)(adapted from [20]).
Lines 1 and 2 represent the change in composition for the skin layer (direct contact with non-solvent) and sub-layer if a film with composition A is immersed in a non-solvent bath. Liquid-liquid demixing can be divided into: i) nucleation and growth of a rich in polymer phase, ii) nucleation and iii) spinodal composition [20, 38].
The choice of polymer is important due to the influence of the range of the solvents and non-solvents that can be used. Another parameter that should be controlled is the choice of pair solvent/non-solvent. The solvent must be completely miscible in the solvent. Water can often be used as solvent but other non-solvent can be used as well. A very large number of combinations of non-solvents and non-solvents are possible; Table 1.3 shows several possible pairs of solvent/non-solvent. P S NS I III II A 1 2
Chapter I 17
Table 1.3 – Combination of solvent/non-solvent pairs (adapted from [20]).
Type of film Solvent Non-solvent
Porous N-Methyl-2-Pyrrolidone (NMP) Water
Porous Dimethylacetamide (DMAc) Water
Porous Dimethyl sulfoxide (DMSO) Water
Porous Dimethylformamide (DMF) Water
The concentration of the polymer defines the final porosity obtained. When the volume fraction of solvent increases, the porosity of the film increases. On the other hand, if solvent is added to the coagulation bath, the morphology of the film can change to dense. Different morphological structures can be obtained by immersion methods: macrovoids, cellular structures, nodules and bi-continuous structures [38]. Macrovoids are big porous and result of the rapid penetration of non-solvent (instantaneous precipitation) in the film. For the cellular structures, the delay time for demixing is important for the morphology definition. Nodules are spherical beads with diameter of 25-200 nm. Bi-continuous structures contain a layer with interconnected pore.
A large number of studies can be found in the literature regarding the development of porous films by phase inversion with control of different parameters such as: solvent/non-solvent combinations, polymer concentration, casting and coagulation temperature and evaporation time. These parameters influence the morphology of the film [43-46]. The authors reported that higher polymer concentrations and a longer time between casting and coagulation tends to reduce the porosity and induce the formation of a denser film [47].
18 Chapter I
Some studies use polyethylene glycol (PEG) as additive and study the effect of the molecular weight of PEG on the porosity (size, distribution). They concluded that the porosity increases in films with PEG with higher molecular weight due to the decrease in miscibility of the casting solution with water [45-46, 48-49]. Idris et al. [49], for example, found that the addition of PEG 200 in the casting solution decreases the size of macrovoids while PEG 400 and PEG 600 increases the number and size of macrovoids. With the increase of PEG concentration, the viscosity of casting solution increases because the concentration of solvent decreases and the performance of the film changes.
Zhao et al. [50] studied the blend of different amphiphilic polymers with the polymer matrix to prepare porous films via the immersion precipitation method. The effects of structural variation of the amphiphilic polymers on the morphology of the films were investigated.
1.4 Electrically Conductive Polymer Composites Sensors
Sensors based on Electrically Conductive Polymer Composites (ECPCs) are composed by an insulating polymer matrix loaded with conductive particles or conducting polymers [8]. The most often used particles materials are metals, carbon black and semiconducting metal-oxides. Composite sensors made from conductive carbon black dispersed in various polymers have been developed and studied extensively by Lewis and co-workers [51-53]. With increasing concentration of the conductive particles, the polymer matrix becomes conductive. This process can be described by percolation theory [8].
1.4.1 Percolation Theory
Percolation models are used to describe the relationship between electrical resistance and the concentration of conductive particles in a matrix. When the
Chapter I 19
concentration of conductive particles is very low, there is no extensive connected pathways for electrical conduction that penetrate or percolate through the composite, and the resistivity of the composites remains very high. When the concentration of conductive particles is very high, the conductive particles pack very close in the composite and form conductive pathways, which impart a low resistance response of the sensor. The relationships among composite resistance, conductive particles concentration, resistivity and polymer swelling are not well known [54-56]. Most studies on ECPCs have sought to lower the percolation threshold because a high filler concentration raises the product cost and changes the mechanical properties of the polymer matrix; for example the viscosity increases with the increase of filler concentration. The volume fraction of fillers is an important parameter to study the electrical properties of these composites at the percolation threshold [8-9, 54-55]. Particle size and morphology, polymer matrix viscosity, particle - matrix interaction influences the percolation threshold of ECPCs. For instance, a poor dispersion of the conductive particles in the polymer matrix increases the percolation threshold [57].
1.4.2 Piezoresistive Effect
The sensitivity to pressure of ECPCs is known as piezoresistive effect [57-58]. This effect is the change in electrical resistance of the polymer matrix when a stress is applied. The maximum sensitivity of ECPCs sensors may be expected at the percolation threshold [59]. When pressure is applied to compress the polymer matrix, the overall volume reduces and increases the contact area between the conductive particles [60]. Sensitivity of the piezoresistive materials can be characterized by gauge factor (GF). The GF is the change in electrical resistance per unit of deformation. This parameter can be calculated as follows:
20 Chapter I 0 0 L L R R GF (1.1)
where is the electrical resistance of the material before deformation, is the variation of electrical resistance caused by the deformation, is the dimension of the sensor, is the deformation applied.
The piezoresistivity of ECPCs, as well as their mechanical flexibility and ease of processing, make these composites promising candidates for use in cheap, flexible and large area pressure sensors.
A large number of studies can be found in the literature regarding the development of dense polymer-based pressure sensors. The most common are the polymer films containing carbon black particles [8-9, 16-17, 54-55, 59, 61-62]. The sensor’s response depends on a number of different parameters, including: geometry and concentration of the conductive component dispersed in the polymer matrix, conductive particle (size and morphology), solvent nature and thickness of the film [54-55].
On the other hand, few studies report the development of porous polymer-based pressure sensors prepared by different methods [17-19, 56, 62]. King et al. [17] studied a porous polymer matrix containing carbon black particles. To introduce porosity into the polymer matrix they used sugar particles. The sensor obtained showed an electrical resistance change from 20 kΩ to 100 Ω for an applied 95 % compressive strain. Li et al. [62] described a conductive porous nanocomposite based on polypropylene (PP) and polystyrene (PS) and carbon black as conductive particles; these authors concluded that when increasing the porosity, the percolation threshold
Chapter I 21
decreases. Ravati et al. [18] studied a porous polymeric pressure sensor by the deposition of polyaniline (Pani) on a matrix blend composed by (poly(methyl methacrylate) (PMMA), high-density Polyethylene (HDPE) and polystyrene (PS)). The conductive polymer is sensitive to pressure providing that the void volume percentage and the applied load is sufficiently high. Danesh et al. [16] developed a porous conductive composite by phase separation. The matrix used by these authors was poly (methyl methacrylate) (PMMA), the solvent was ethyl acetate (EA), the non-solvent (less volatile) was 2-methyl-2, 4 -pentanediol (MPD) and conductive particles were of carbon black. After complete evaporation of the solvent, the film was immersed in aqueous methanol solution to remove the non-solvent. The maximum sensitivity to pressure was obtained by introducing porosity in the film. Brady et al. [19] reported smart textiles based on conducting polymers deposited on a foam (polyurethane). However, this pressure sensor presents some limitations, such as: drift in conductivity of the conducting foam and hysteresis after compression.
According to Danesh et al. [16], King et al. [17] and Ravati et al. [18] the effect of porosity on the sensor is directly related to the sensor’s response. In other words, when the porosity increases, the sensitivity to pressure of the ECPCs increases; when the sensor is compressed, the conductive particles come into contact and the sensor becomes conductive. The pores are the limiting links in the percolation threshold [17].
1.5 Motivation and thesis outline
The present work was developed under the framework of the cooperation protocol between FEUP (Faculty of Engineering of University of Porto) and Kinematix (former Tomorrow Options-Microelectronics S.A.). Kinematix targets the development of a simple, robust and low cost piezoresistive sensor, with minimum hysteresis and drift, to respond between 0 to 50 N·cm-2. Moreover, the production
22 Chapter I
process should be reproducible. Therefore, the aim of the present work is the development of a robust and low cost pressure sensitive device based in conducting polymer films. The sensor should be lightweight, highly flexible, cheap and elastic and should be very resistant to compression but mainly to the shear forces observed in the insole of shoes. For that, the electrodes should preferentially be made with the same material to avoid stress and delamination of the contact area. The electrodes should have an electrical conductivity 100 to 1000 times higher than the sensor (negligible electrical resistance) and should exhibit a very good adhesion to the sensor. So, this pressure sensitive device (sensor element) was envisioned as a pressure sensitive layer sandwiched between two electrical conductive layers.
This work is divided in seven Chapters. Chapter I is a literature survey over the main topics related to this thesis. This Chapter presents an overview concerning pressure sensors. Chapter II presents the experimental methods and some materials used to prepare and characterize polymer films based on ECPCs. Chapter III describes the development of sensor elements based on dense ECPCs, the development of electrodes based on the similar composite material and the influence of electrode type, conductive component type, mechanical properties and film morphology. In Chapter IV a study of different methods to create porosity in the polymer matrix, PDMS and PEBA, was evaluated. This Chapter addresses the effect of film morphology of the polymeric matrix on the response of the sensor towards pressure. In Chapter V of this Chapter, a study of the development of porous PDMS and PEBA based ECPCs was addressed. The influence of the type of conductive particles and the combination of solvent/ non-solvent on the porous morphology was studied; the effect of the conductive particles on the piezoresistive effect was also evaluated. Chapter VI describes the preparation of PEBA 4033 based on ECPCs by the immersion precipitation method and graphene nanoplatelets used as conductive particles. The influence of the type of graphene nanoplatelets and the combination of
solvent/non-Chapter I 23
solvent on the porous morphology was studied. The piezoresistive response and mechanical properties were also evaluated. In Chapter VII a study of the way the electrodes are bonded to the ECPC, casted or glued by the edges, on the electrical resistance measurements (piezoresistive response) is addressed and hysteresis and drift response are evaluated. A commercial pressure sensor was compared to the ECPCs prepared. The last Chapter, Chapter VIII, presents the main conclusions of this work and gives suggestions for future work.
1.6 References
1.
http://www.min-saude.pt/portal/conteudos/a+saude+em+portugal/noticias/arquivo/2010/3/pe +diabetico.htm. [cited 2013 april].
2. http://www.mdsaude.com/2012/08/pe-diabetico.html. [cited 2013 april]. 3. http://diabeticfootonline.blogspot.pt/. [cited 2013 april].
4. http://www.idf.org/. [cited 2013 may].
5. http://www.tekscan.com/. [cited 2013 january]. 6. www.tomorrow-options.com. [cited 2013 january].
7. Harsányi, G., Polymeric sensing films: new horizons in sensorics? Materials Chemistry and Physics, 1996. 43(3): p. 199-203.
8. Knite, M., Teteris, V., Polyakov, B., Erts, D., Electric and elastic properties of
conductive polymeric nanocomposites on macro- and nanoscales. Materials
Science and Engineering: C, 2002. 19(1-2): p. 15-19.
9. Hussain, M., Choa, Y.-H., Niihara, K., Fabrication process and electrical behavior
of novel pressure-sensitive composites. Composites Part A: Applied Science and
Manufacturing, 2001. 32(12): p. 1689-1696.
10. Pallàs-Areny, R., Webster, J.G., Sensors and Signal Conditioning, I. John Wiley & Sons, Editor. 2000, Wiley-Interscience.
11. Podoloff, R., Benjamin, M., Flexible, tactile sensor for measuring pressure
24 Chapter I
12. http://www.peratech.com/qtc-material-inspirations.html. [cited 2013 january].
13. Lussey, D., Jones, D., Leftly, S., Flexible Switching Devices., WO 01/88935 A1, November 22, 2011.
14. Lussey, D., Laughlin, P., Bloor, D., Hilsum, C., Polymer composition with
electrically-conductive filler, U.K. Patent GB 2465077 A, May 12, 2010.
15. Lussey, D., Conductive Strutures, WO 00/79546 A1, December 28, 2000.
16. Danesh, E., Ghaffarian, S.R., Molla-Abbasi, P., Non-solvent induced phase
separation as a method for making high-performance chemiresistors based on conductive polymer nanocomposites. Sensors and Actuators B: Chemical, 2011.
155(2): p. 562-567.
17. King, M.G., Baragwanath, A.J., Rosamond, M.C., Wood, D., Gallant, A.J., Porous
PDMS force sensitive resistors. Procedia Chemistry, 2009. 1(1): p. 568-571.
18. Ravati, S., Favis, B.D., 3D porous polymeric conductive material prepared using
LbL deposition. Polymer, 2011. 52(3): p. 718-731.
19. Brady, S., Diamond, D., Lau, K.-T., Inherently conducting polymer modified
polyurethane smart foam for pressure sensing. Sensors and Actuators A:
Physical, 2005. 119(2): p. 398-404.
20. Mulder, M., Basic Principles of Membrane Technology. 2 nd ed. 2000: Klumer Academic Publishers.
21. Kesting, R.E., Fritzsche, A.K., Polymeric Gas Separation Membranes. 1993: John Wiley & Sons, Inc.
22. Hentze, H.P., Antonietti, M., Porous polymers and resins for biotechnological
and biomedical applications. Reviews in Molecular Biotechnology, 2002. 90(1):
p. 27-53.
23. Huang, S., Wu, G., Chen, S., Preparation of open cellular PMMA microspheres by
supercritical carbon dioxide foaming. The Journal of Supercritical Fluids, 2007.
40(2): p. 323-329.
24. Siripurapu, S., Gay, Y.J., Royer, J.R., DeSimone, J.M., Spontak, R.J., Khan, S.A.,
Generation of microcellular foams of PVDF and its blends using supercritical carbon dioxide in a continuous process. Polymer, 2002. 43(20): p. 5511-5520.
25. Yuen, P.K., Su, H., Goral, V.N., Fink, K.A. (2011) Three-dimensional
interconnected microporous poly(dimethylsiloxane) microfluidic devices. 11,