Empirical Determinants of Government Efficiency: A Study Based on Objective Indicators
17
0
0
Texto
(2) bpsr. Empirical Determinants of Government Efficiency: A Study Based on Objective Indicators. protects property rights, intervenes little and taxes lightly; it has a small dimension and a well-functioning bureaucracy free of corruption; it is politically free and sustained by a democracy; it provides public goods of high quality and, finally, it is efficient. Some of these aspects generate controversy as they clearly have an ideological content, as for instance, low taxes and little intervention. As for corruption and limitations to political freedom, it can be argued that more than being proxies of good governing, they determine the existence of good or bad public institutions, which in turn may be able to provide better or worse services. The same reasoning can be applied to bureaucratic systems: a well-functioning bureaucracy can be seen as a proxy or as a cause of good government. Like Brixiová and Bulir (2001), we will consider bureaucracy as a possible determinant of government quality: “Bureaucratically organized systems tend to be less efficient...”. Contrary to other measures of government quality, the provision of public goods of superior quality is quite consensual. However, assessing public goods quality can be as challenging as measuring government quality itself. We are seeking to improve on the existing measures of government efficiency, which can be of a qualitative nature or supported by subjective responses to survey questions, such as those carried out by the International Country Risk Guide (2003). In this paper, we will use the term good government to signify a government that provides services in essential sectors like health and education in an efficient way, i.e., where the relation between output indicators and the amount of resources necessary to achieve them is high. Our measures compare government output in a given sector with the amount of resources/money necessary to provide that output.1 Health and education are two of the most important sectors of government provision (St. Aubyn and Afonso 2004). According to the World Development Indicators, average health expenditure (public and private) in the 1990s was around 5.5% of GDP in the United States and United Kingdom, almost 7% in Belgium, Canada, Denmark, Norway and Switzerland, and above 7% in Germany, France and Sweden. The data on education is as striking. In the USA and the UK more than 5% of GDP was spent in education; in Canada and Finland this number was almost 7%, and in Denmark, Norway and Sweden it was well above 7%. In addition, in these two sectors there are ample quantifiable measures of output as well as information on sectorial public spending.2 So as measures of government efficiency, we used the ratios of infant mortality rate to health expenditures as a percentage of GDP, and the ratios of drop out and illiteracy rates to education expenditures as a percentage of GDP. We believe that one of our contributions to the literature has been to provide new quantifiable measures of government efficiency; different but related to the qualitative measures used thus far.. 54. (2012) 6 (1). 53 - 69.
(3) bpsr. Francisca Guedes de Oliveira. As for the determinants of government efficiency, we believe there are structural factors that affect beliefs and behaviour and that lend inertia to any institutional change. At the same time, institutions tend to be created or transformed when the benefits of innovation are patently greater than the costs of inertia. Whereas determinants such as major religion and the origins of the legal system may mostly relate to very long-term determinants of government efficiency, variables such as wealth and openness alter the trade-off between the benefits and costs of institutional change and test the policy and structural variables that affect government efficiency. Here, we will test the importance of the determinants of government grouped as economic, political and cultural factors. Regarding economic factors, like La Porta et al. (1999), we can claim that institutions are created whenever the benefits of their existence are greater than the costs of their creation. Wealth and development would make this trade-off in favor of good governance, not only because development would make good institutions affordable but also because it would make them more reliable. St. Aubyn and Afonso (2004) suggest that different levels of GDP per capita or educational attainment by the adult population (which could serve as a proxy for the level of development) could be decisive in explaining differences in government efficiency across countries.3 We will consider a set of indicators that represent characteristics that differentiate the way in which societies are shaped in their level of development, in particular, concentration of urban population and population age composition. The former can be related to proximity to the decision makers. If the population, in general, is located in or around cities, where the number (and sometimes the quality) of hospitals and schools is higher, will this interfere with the efficiency with which the government is able to render its services? Gaviria and Stein (2000) establish a link between the growth rate of urban concentration and the ability of central authorities to provide adequate public services, although Ades and Glaeser (1995) defend a clear link between political factors and urban concentration. The second indicator tells us that the age structure of the population is often seen as a sign of development. Fougére and Mérette (1999) establish an empirical relation between ageing population and growth. There is also literature that addresses the effects of the inverted demographic pyramid and public spending in education or health (see Cattaneo and Wolter (2009) and Getzen (1991)). In terms of political factors, the theory of political determinants of institutions states that those in power will shape policies and institutions so as to allow them to remain in power and transfer resources toward themselves (La Porta et al (1999)). Some groups and societies allow rent-seeking behaviour in a more generalized way than others. When this kind of behaviour becomes pervasive and/or the groups in power care more about their own interests than common interest, worse governance is the most likely outcome. In La Porta et al. (1997), ethnic heterogeneity is used as a proxy for these political factors: if there. 55. (2012) 6 (1). 53 - 69.
(4) bpsr. Empirical Determinants of Government Efficiency: A Study Based on Objective Indicators. are several groups with different interests, the eagerness to stay in power will be greater. Governments become more interventionist and less efficient and the quality of public goods drops.4 A member of a certain group will use its power to generate benefits for the members of the group. Bush and Muthoo (2003) refer to the fact that reluctance in changing inefficient institutions into more efficient ones has also to do with the existence of different groups with different bargaining powers. Alesina and La Ferrara (2004) refer to links between inefficient policies and ethnic diversity. They claim: “Conflicts of preferences, racism, prejudices often lead to policies which are suboptimal from the point of view of a society as a whole”. Social polarization is also related to the existence of groups with different and often opposing interests. Once again, when polarization is significant, there tends to be worse governments. Keefer and Knack (2002) state that this factor alone can diminish the ability of a government to respond to a crisis, as well as the stability of its decisions. Inequality in income distribution is one of the main causes of social polarization. The rent-seeking behaviour described above distorts the way in which institutions work, making them more prone to corruption, excessive bureaucracy, etc. Mauro (2002) argues that corruption lowers investment (public or private) distorting it (in a worse way than taxes (Sheleifer and Vishny (1993)) in such a way that will surely affect efficiency. Aziz and Ul Haque (1998) consider that weak and inefficient governments are typically built around rent- seeking elites. Gupta et al. (2000) provide evidence that reducing corruption increases efficiency, or at least improves the quality of the outputs measured by infant mortality and primary school dropout rates. Tanzi and Davoodi (2000) state that corruption may have negative impacts in terms of public spending on education and health. If we assume that the amount spent by a given government is the “correct” one, if corrupt agents reduce it, this will necessarily generate inefficiencies. Also regarding corruption and efficiency, Tanzi and Davoodi (1997) show evidence that corruption may increase public investment, but it also diminishes productivity. In a related issue, there is also literature that deals with excessive bureaucracy and inefficiencies of the public sector. Rauch (1995) makes reference to the public provision of inputs that are complementary to the private sector. This provision tends to decrease in countries with a non-professional state bureaucracy. Also referring to bureaucracy, Brixiová and Bulir (2001) state that systems with excessive bureaucracy tend to generate less efficient institutions.5 We will use some variables related to diversity and others to distortions in the normal functioning of institutions as proxies of political theories of institutional performance. Finally, regarding cultural factors, theories supporting cultural determinants of institutions rely on the fact that societies have beliefs that induce collective actions and make certain kinds of behaviour more probable. When these beliefs are strongly persistent they. 56. (2012) 6 (1). 53 - 69.
(5) bpsr. Francisca Guedes de Oliveira. tend to be related to culture (La Porta et al. (1999)). Excessive intolerance or lack of selfconfidence can make it impossible for a society to have good institutions and consequently good governments. La Porta et. al (1997) state that “trust determines the performance of a society’s institutions”. Knack and Zac (2001) show that trust varies substantially among countries. Barro and McClay (2002) discuss the role of religion in a country’s institutional development. Religion can be seen as a proxy of cultural characteristics since it strongly influences individual and social actions. The authors establish a link between religion and corruption, showing some evidence that Protestant countries are less corrupt than Catholic ones. In La Porta et al (1997), it is found that there is a negative association between trust and the dominance of the main religion. It could be argued that if different groups with different power hinder government quality, then the existence of several religious groups would have a negative impact on government quality. We believe that both arguments put forward concerning religious diversity may be true. However, in agreement with the related literature, we believe that the positive effect of religious diversity (which will lead to greater trust and tolerance) may surpass the negative impact (presence of different social groups with different and colliding interests). Nevertheless, the effect of religious fractionalization on government efficiency remains to be seen. We will also test if the dominance of one particular religion is relevant to government performance. Another possibility to account for cultural diversity among countries is their legal system. The legal system adopted by a country can be very closely related to the habits and practices of its inhabitants (La Porta et al 1997). As per the literature, we will consider five possible legal origins: Socialist, Scandinavian, English civil law, French civil law and German legal tradition. This paper is structured as follows: in section 2 we will present the data and indicators that assess government quality, as well as the variables representative of each group of determinants described above. In section 3 we present and discuss the regression results, exploring the data in order to find a meaningful relationship between efficiency and its determinants. Finally, in section 4, we draw our conclusions.. Data Definitions and sources The analysis presented in this paper uses a set of variables covering up to 208 countries. The definition and sources of all the variables are summarized in Table 4, appendix A. For all variables, we used five year averages (1970 to 1974; 1975 to 1980 etc.).. Dependent variables In this paper, we are aiming to build quantifiable and objective measures of government. 57. (2012) 6 (1). 53 - 69.
(6) bpsr. Empirical Determinants of Government Efficiency: A Study Based on Objective Indicators. performance. We selected Education, one of the fundamental sectors in almost any country around the world, and use two measures of output (dropout rate and illiteracy rate). We confirm our results by also testing a health sector indicator (infant mortality).6 Our main focus is efficiency in the use of government resources, which means that more than being concerned with output, we are interested in its relation with the amount of resources spent to deliver it. For that purpose we do not use output per se, but ratios of each of the output variables to public spending in the corresponding sector. We selected the following measures of government performance infant mortality rate Public health expenditures as a percentage of GDP. dropout rate Public education expenditures as a percentage of GDP. iliteracy rate Public education expenditures as a percentage of GDP. Note that, for all measures, if we increase the numerator for the same denominator we have a worse situation, which means that a higher value means worse performance. However, if we increase the denominator while maintaining the numerator (for example, if we increase health expenditures and infant mortality rate remains the same), the ratio decreases and we are also worse off. Because we cannot have different readings for the same variation of the measure, we decided to redefine our ratios in the following way: 100 - infant mortality rate Public health expenditures as a percentage of GDP. 100 - dropout rate Public education expenditures as a percentage of GDP. 100 - iliteracy rate Public education expenditures as a percentage of GDP. The three indicators of government efficiency divide a positive output measure by the expenditure incurred. Thus, an increase in the value of any of the indicators can be interpreted as an increase in government efficiency. It means that governments are able to deliver more for a lower cost.. 58. (2012) 6 (1). 53 - 69.
(7) bpsr. Francisca Guedes de Oliveira. Although there is no doubt that the input measures in the denominator are measures of public sector inputs, it could be argued that the output measures in the numerator depend at least as much on private investment. Thus, these output measures would only partly be the consequence of governmental activities. To overcome this doubt we correlated each of our indicators with public and private spending in both the health and education sectors. We found that, while having positive correlations with both variables, the correlation with public spending was at least five times higher than with private spending. This leads us to conclude that those are much more dependent on public rather than private investment. We analysed the relation between the subjective measures of efficiency used in the literature such as the political rights index, corruption index or bureaucracy index (La Porta et al 1997) and found that there were positive correlations, but far from 1. We believe that although we might be talking about similar realities our variables are, in fact, capturing new information.7. Regressors As independent economic variables we have used per capita GDP, the percentage of urban population, the age structure of the population, the sector structure of employment, openness to trade and to foreign direct investment, and the share of government expenditure in GDP. As for political determinants, we used an ethnic fractionalization index and a Gini index to account for the number of different groups. To assess the degree of distortion induced in the normal functioning of institutions we used the following tow indexes: political freedom and law and order tradition. It is more likely that law and order distortions associated to high corruption and excessive bureaucracy will lead to less investment (public or private) and to the channelling of investment towards the interests of certain groups, as in Sheleifer and Vishny (1993). The relationship between public and private sectors will also be damaged by the prevalence of distortions in the political process, as shown in Rauch (1995). The absence of political or civil liberties themselves can also damage government efficiency. As noted by Tavares and Wacziarg (2001), “Democracy may also influence the “quality of governance”: rulers with discretionary power tend to set up distortionary policies that benefit a small set of insiders at the expense of the general population (...). The exercise of power is potentially more arbitrary in autocratic regimes that lack the public scrutiny of policy makers”. As for cultural determinants, we have used religious fractionalization, the main religion in the country and the origins of a country’s legal system. Tables 1.1 to 1.6 present the main regression results. We start by verifying our intuition that income is positively related to government efficiency, patent in the positive and significant coefficient for income per capita. A second issue was the relation between. 59. (2012) 6 (1). 53 - 69.
(8) bpsr. Empirical Determinants of Government Efficiency: A Study Based on Objective Indicators. government size and government efficiency: is there a trade-off between the two or, on the contrary, do countries that can “afford” larger governments also tend to have more efficient governments? We found that general expenditures are positively and significantly associated with government performance, independent of the relation of either one to income per capita. Though the literature is ambiguous about the relationship between size and government efficiency, our data using objective indicators of efficiency delivered a strong result. We then added political and cultural indicators to determine their relevance in explaining differing government performance. We were also able to verify that urban population is statistically relevant and positively associated with government efficiency. This means that rather than being a proxy for the level of underdevelopment, urban concentration makes it easier to provide good quality services. The age structure of the population does not have a consistent effect on government efficiency. As for employment structure, an interesting result emerged: the more agriculturally oriented a society is, the less efficient its government will be, but the percentage of employment in services is also detrimental to government efficiency. While gross foreign direct investment has no relevance in explaining government efficiency, openness to trade does matter and has a positive effect on all indices considered. In the literature, there is evidence of a link between these indicators and efficiency using the subjective indicators of government performance. The authors in Larrain and Tavares (2007) conclude that both foreign direct investment and openness have a positive effect on corruption (meaning less corruption). As per the literature, we expected that larger differences between groups within a society – be them income inequality or ethnic differences – would lead to social polarization and government inefficiency. While the introduction of the Gini income inequality and the ethnic fractionalization indices did not alter results on income per capita and government size, the results for the former are not consistent, although ethnic fractionalization had a statistically significant negative impact on infant mortality. In the second set of political variables we observed that increases in the law and order index and in political rights are associated with increases in government performance. However, the latter is only statistically relevant in the first regression. Cultural traditions that favour trust and confidence, that protect the individual against the State and that limit the power of politicians should improve government efficiency. According to La Porta (1997), there is a negative association between trust and the dominance of a strong religion. Hence, religious fractionalization may lead to higher government efficiency if societies are able to overcome differences. A related issue has to do with the influence of the country’s main religious confession in government efficiency. In accordance with La Porta (1999) and Barro and McClay (2002), we expect Protestant countries to have more efficient governments than Catholic or Muslim ones. Our results. 60. (2012) 6 (1). 53 - 69.
(9) bpsr. Francisca Guedes de Oliveira. allow us to conclude that religious fractionalization has, in fact, a positive effect on government efficiency, the case being stronger in the education sector. Religious dummies for the main religious denomination in the country do not have relevance in determining government performance, and the same is true for the country’s legal system. Table 1.1. Regression results for Irpse Irpse Const. GDPpc Gge Gini EF PRI LOI R2. (1) -0.559 11.486***. (2) 52.5 4.446* 0.178*. (3) 39.39 5.298* 0.240* 0.152***. (4) 54.63 4.333* 0.174*. (5) 58.35 4.031* 0.179*. (6) 62.14 2.813* 0.119*. 11.1. 28.2. 42.2. 28.6. 30.3. 1.674* 36.3. n. obs.. 560. 418. 217. 413. 405. 262. -2.497 -0.868*. Table 1.2. Regression results for Irpse Irpse Const. GDPpc Gge RF UP (0,15) (65,…) EA ES T GDFI R2. (7) 49.8 4.592* 0.166* 5.044**. (8) 59.6 2.783* 0.177*. (9) 53.6 4.028* 0.163*. (10) 85.9 1.602** 0.134*. (11) 53.3 4.494* 0.122*. 29.1. 29.6. 28.9. 40.2. 0.009 0.166*** 36.4. n. obs.. 415. 418. 418. 221. 360. 0.111** 0.013 0.407 -2.054* -0.069. Table 1.3. Regression results for dorpse. 61. dorpse Const. GDPpc Gge Gini EF PRI LOI R2. (1) 63.49 3.619*. (2) 62.34 3.016* 0.212*. (3) 46.74 3.979* 0.269* 0.131. (4) 60.59 3.146* 0.213*. (5) 64.87 2.785* 0.214*. (6) 59.55 3.079* 0.179*. 22.1. 28.6. 33.5. 28.7. 28.4. 0.634 33.7. n. obs.. 459. 380. 220. 380. 374. 215. 1.724 -0.221. (2012) 6 (1). 53 - 69.
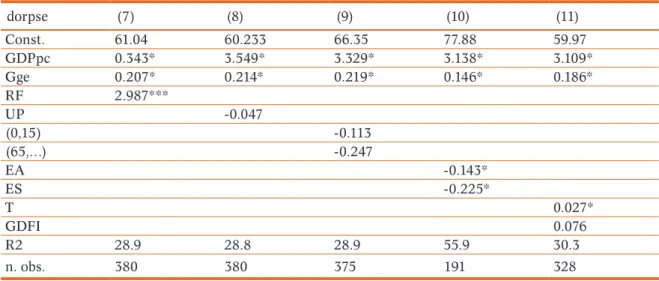
(10) Empirical Determinants of Government Efficiency: A Study Based on Objective Indicators. bpsr. Table 1.4. Regression results for dorpse dorpse. (7). (8). (9). (10). (11). Const. GDPpc Gge RF UP (0,15) (65,…) EA ES T GDFI R2. 61.04 0.343* 0.207* 2.987***. 60.233 3.549* 0.214*. 66.35 3.329* 0.219*. 77.88 3.138* 0.146*. 59.97 3.109* 0.186*. 28.9. 28.8. 28.9. 55.9. 0.027* 0.076 30.3. n. obs.. 380. 380. 375. 191. 328. -0.047 -0.113 -0.247 -0.143* -0.225*. Table 1.5. Regression results for mrihepu mrihepu. (1). (2). (3). (4). (5). (6). Const. GDPpc Gge Gini EF PRI LOI R2 n. obs.. -41.66 15.232*. -31.58 12.463* 0.407*. 44.88 5.951* 0.259** -0.355**. -4.773 10.841* 0.297**. -16.52 11.201* 0.417*. -28.63 11.855* 0.362**. -26.390 -1.486 42.5 328. 47.0 231. 43.8 149. 49.8 227. 47.3 222. 0.470 48.3 190. Table 1.6. Regression results for mrihepu Irpse mrihepu. (7). (8). (9). (10). (11). Const. GDPpc Gge RF UP (0,15) (65,…) EA ES T GDFI R2 n. obs.. -32.09 12.525* 0.395* 0.688. -21.42 9.207* 0.451*. 81.56 8.416* 0.677*. 89.82 6.212* 0.199***. -44.13 13.265* 0.244**. 0.255* -2.059* -3.272* -1.039* -0.770*. 47.7 229. 48.4 231. 52.3 223. *Significant at 1%; **significant at 5%; ***significant at 10%. 62. (2012) 6 (1). 53 - 69. 55.9 194. 0.138* -0.073 29.6 215.
(11) bpsr. Francisca Guedes de Oliveira. Endogeneity issues The main question of this paper is whether a country’s economic, political or cultural conditions explain differences in government performance. We are aware that this is a difficult task because most of the variables considered may, in turn, be influenced by government quality (this being particularly true in the case of economic factors). There is some literature on the tight link between institutions and development or wealth, and most of them address endogeneity issues. In particular, the seminal article of Acemoglu et al. (2001) tries to establish that income today is determined by a proxy for institutional quality and other non-economic variables. The authors address the problem of the possible endogeneity of institutional quality: good institutions can foster wealth but richer countries can afford institutions of higher quality. The problem is apparently solved by using settler mortality as an instrumental variable. There were some criticisms of the work of Acemoglu et al. (2001), namely a paper by Albouy (2004). This issue is complex and probably the biggest weakness of research concerning institutional quality and GDP (or other measures of wealth). In order to be able to trust our results, we wanted to confirm if we had major endogeneity issues with our variables. We used the Hausman test for endogeneity that can briefly be explained as follows: Suppose that we are running the regression:. y1i = β1 + β 2 X 2i + ... + β k X ki + δy2i + µi (1) We suspect that y2 may be endogenous (we assume that all Xi are exogenous). To perform the test, we first regressed y2 against all the variables X in the previous model and a set of instrumental variables Z. y 2i = β 1 + β 2 X 2i + ... + β k X ki + α 1 Z 1i + ... + α j Z ji + ν i. (2) If y2 is exogenous, then E (µ i ,ν i ) = 0 . This would mean that E ( y1i ,ν i ) = 0 . We can run the regression: y1i = β 1 + β 2 X 2i + ... + β k X ki + δy 2i + ρνˆi + ε i. (3) And test the hypothesis: .H0:ρ =0. Under H0 y2 is exogenous. So, the first thing we have to do is to find instrumental variables for all the variables we want to test. Previously, we concluded that loggdppc was one of the main determinants of government efficiency variability around the world. As per the literature, we were particularly concerned with the possible endogeneity of this variable. We chose latitude as an instrumental for loggdppc8 and ran the Hausman test.9 In Table 2 v1 are the estimation residuals of (1).. 63. (2012) 6 (1). 53 - 69.
(12) Empirical Determinants of Government Efficiency: A Study Based on Objective Indicators. bpsr. Table 2 Irpse. Dorpse. Mrihepu. v1 (coefficient). 1.859. 3.118. 26.158. t-stat. 0.31. 0.50. 3.56. P > |t|. 0.756. 0.618. 0.000. We can see from the results that loggdppc seems to be exogenous to the model (at least when we are talking about education). Because of the nature of the variable we were also interested in testing the endogeneity of general expenditures. We used as instruments for government expenditures both the electoral rule (Majorit) and the political regime (Pres). The link between electoral institutions and the size and composition of public expenditures can be seen in Milesi-Ferrati et al. (2002). Persson (2002) concludes that political institutions (such as electoral rules and political regimes) do shape economic policy and are consequently linked to the size of public expenditures.10 In Table 3 u1 are the estimation residuals of <ref>hausman1</ref>. The conclusions are not as reassuring as the one we drew from loggpdpc, although at 5% we can say that the variable is exogenous in terms of the education regressions. Table 3 Irpse. dorpse. Mrihepu. u1 (coefficient). 0.322. 0.218. 0.827. t-stat. 1.98. 1.57. 2.58. P > |t|. 0.057. 0.12. 0.011. Conclusion We examined the relationship between indicators of government efficiency in the health and education sector and several of its aggregate determinants. We have confirmed our initial intuition that income is positively related to government efficiency, made clear by the positive and significant coefficient of income per capita in all regressions. We also verified that general expenditures are positively and significantly related to government performance. We can therefore conclude that the most consistent and robust determinants of government efficiency are the level of income per capita, with richer countries displaying higher government efficiency, and government size, with increases in the amount spent by general government as a share of GDP positively related to efficiency. Urban population is statistically relevant and positively associated with government efficiency. This means that a higher share of the population in urban areas makes it easier to provide good public services.. 64. (2012) 6 (1). 53 - 69.
(13) bpsr. Francisca Guedes de Oliveira. The age structure of the population does not have a consistent effect on government efficiency. On the other hand, agriculturally oriented societies lead to less efficient governments. The data also indicates that a high percentage of employment in services does not foster government quality. In terms of openness, we conclude that while direct foreign investment has no relevance in explaining government efficiency, openness to trade does matter and is good for efficiency. We also found evidence that the existence of different groups in society has some bearing in government performance, while political rights and law and order affect government performance in a positive manner. As for cultural factors, only religious fractionalization seems to matter, with the main religious denomination irrelevant for government efficiency. We can conclude that there is a wide range of factors contributing to differences in government efficiency across the world. We have economic, political and cultural variables that are all relevant to government efficiency. However, the data points to income per capita and government size being particularly important. Revised by Priscila Moura Submited in March 2010 Accepted in May 2012. Notes. 65. 1. Virtually any specific service can be provided and financed by the state and/or the private sector so government efficiency needs to take into account the source of the financing.. 2. St. Aubyn and Afonso (2004) use essentially the same measures but their concern is to evaluate the performance of those sectors. As the authors point out, “We intend to measure inefficiency and not so much explain it”. In this paper we are attempting not so much to explain inefficiencies in the health or education systems per se, but inefficiencies in the government provision of public services (using education and health as examples).. 3. There are other variables that could indicate the level of development. In Evans et al (2001), references are made to geographical location as an important factor in explaining the poor performance of some governments.. 4. This fact is also referred to in Barro and McClay (2002), in Mauro (1995) and Alesina et al. (1999).. (2012) 6 (1). 53 - 69.
(14) bpsr. Empirical Determinants of Government Efficiency: A Study Based on Objective Indicators. 5. In Aziz and Ul Haque (1998) the authors sustain this idea when they say that: “Africa has stagnated because its governments are weak and inefficient and oftentimes made up of narrow rent-seeking elites”.. 6. As we mentioned previously, these are the two sectors that consistently consume a bigger cut of the government budget.. 7. It could be argued that a government might be extremely efficient but because previous governments were very inefficient, it would be difficult to increase our output indicators. One way to overcome this issue is to consider variation of output measures. We believe that by considering averages we tackle this issue, if not completely, at least to a considerable extent. If a country has a very bad government followed by a very efficient one, it will come out as having a moderate quality government.. 8. In Hall et al. (1999) the authors conclude that there is a strong link between output per worker and social infrastructure using latitude as an instrument.. 9. To run the Hausman test we chose the variables that were more consistently significant in the previous analysis.. 10 For more on the relationship between political institutions and public spending see also Persson and Tabellini (1999).. Bibliographical References Acemoglu, Daron, Simon Johnson, and James A. Robinson. 2001. The colonial origins of comparative development: An empirical investigation. The American Economic Review 91 (5): 1369-1401. Ades, A., and E. Glaeser. 1995. Trade and circuses: Explaining urban giants. Quarterly Journals of Economics 110 (1): 195-228. Albouy, David. 2004. The colonial origins of comparative development: A reinvestigation of the data. Berkeley: University of California.. Alesina, Alberto, and Eliana La Ferrara. 2004. Ethnic diversity and economic performance. NBER Working Paper 10313. Alesina, Alberto, Reza Baqir, and William Easterly. 1999. Public goods and ethnic divisions. The Quarterly Journal of Economics 114 (4): 1243-1248. Alesina, Alberto, Arnaud Devleeschauwer, William Easterly, Sergio Kurlat, and Romain Wacziarg. 2003. Fractionalization. Journal of Economic Growth 8 (2): 155-194. Aziz, Jahangir, and Nadeem Ul Haque. 1998. Second generation civil service reform in Africa. IMF Working Paper 98/164, Nov. Barro-Lee Data Set. http://www.worldbank.org/research/growth/ddbarle2.htm Barro, Robert J., and Rachel M. McClay 2002. Religion and political economy in an international panel. NBER Working Paper, no. 8931.Brixiová, Zusana, and Ales Bulir. 2001. Growth. 66. (2012) 6 (1). 53 - 69.
(15) bpsr. Francisca Guedes de Oliveira. slowdown in bureaucratic economic systems: An issue revisited. IMF Working Paper 01/6 Jan. 2001. Bush, Lutz-Alexandre, and Abhinay Muthoo. 2003. Power and inefficient institution. http://www.essex.ac.uk/economics/discussion-papers/papers-text/dp561.pdf Cattaneo, Alejandra M. and Stefan C. Wolter. 2009. Are the elderly a threat to educational expenditures? European Journal of Political Economy 25 (2). Evans, David B, Ajay Tandon, Christopher J. L. Murray, and Jeremy A. Lauer. 2001. The comparative efficiency of national health systems in producing health: An analysis of 191 Countries. GPE Discussion Paper Series, no. 29, World Health Organization. Fougére, Masime, and Marcel Mérette. 1999. Population ageing and economic growth in 7 OECD countries. Economic Modelling 16 (3): 411-27. Freedom House. 2003. Freedom House country ratings. New York: Freedom House. http://www.freedomhouse.org Gaviria, Alejandro, and Ernesto Stein. 2000. The evolution of urban concentration around the world: A panel approach. Banco Interamericano de Desarollo, Departamento de Investigación, Working Paper no. 4. Getzen, Thomas E. 1991. Population ageing and the growth of health expenditures. The Journal of Gerontology 47 (3): S98-S104. Gupta, Sanjeev, Davoodi Hamid, and Erwin Tiongmon. 2000. Competition and the provision of health care and education services. IMF Working Papers /00/116, June. Hall, Robert E., and Charles I. Jones. 1999. Why do some countries produce so much more output per worker than others? Quarterly Journal of Economics 114: 83-116. International Country Risk Guide. 2003. Financial, political and economic risk ratings for 140 countries. Political Risk Services (PRS) Group. http://www.prsgroup.com/icrg/icrg.html Keefer, Philip, and Stephen Knack. 2002. Polarization, politics and propertu rights: Links between inequality and growth. Public Choice 111 (1-2). Knack, Stephen, and Paul J. Zac. 2001. Trust and growth. The Economic Journal 111 (470). La Porta, Rafael, Florencio Lopez-de-Silanes, Andre Shleifer, and Robert Vishny. 1997. Trust in large organizations. America Economic Review Papers and Proceedings 87 (2): 333-338. _______. 1999. The quality of government. The Journal of Law Economics and Organization 15 (1): 222-79. Larrain, Felipe, and José Tavares. 2007. Can openness deter corruption? The role of foreign direct investment. CEPR Discussion Paper no. DP6488. http://ssrn.com/abstract=1138952 Mauro, Paolo. 1995. Corruption and growth. Quarterly Journal of Economics 110: 681-712. _______. 2002. The persistence of corruption and slow economic growth. IMF Working Paper 02/213. Milesi-Ferrati, Gian Maria, Roberto Perotti, and Massimo Rostagno. 2002. Electoral systems and public spending. The Quarterly Journal of Economics 117 (2): 609-57.. 67. (2012) 6 (1). 53 - 69.
(16) bpsr. Empirical Determinants of Government Efficiency: A Study Based on Objective Indicators. Torsten, Persson and Guido Tabellini. 1999. The size and scope of government: Comparative politics with rational politicians. European Economic Review 43: 699-735. Torsten, Persson. 2002. Do political institutions shape economic policy? Econometrica 70 (2): 883-905. Rauch, James E. 1995. Bureaucracy, infrastructure and economic growth: Evidence from U.S. cities during the progressive era. The American Economic Review 108: 968-79. Sheleifer, Andrei, and Vishny, Robert W. 1993. Corruption. Quarterly Journal of Economics 108: 599-617. St. Aubyn, Miguel, and António Afonso. 2004. Non parametric approaches to education and health expenditures efficiency in OECD countries. ISEG-UTL Economics Working Papers no. 1. Tanzi, Vito, and Hamid R. Davoodi . 1997. Corruption, public investment and growth. IMF Working Paper /97/139, Oct. ___. 2000. Corruption, growth and public finance. IMF Working Paper 00/182, Nov. Tavares, José, and Romain Wacziarg. 2001. How democracy affects growth. European Economic Review 45: 1341-78.. 68. (2012) 6 (1). 53 - 69.
(17) bpsr. Annex. Appendix A Table 4. Name. Description. Source. Dor. Dropout rate. Barro-Lee Data Set. pse dorpse. Public education expenditures, % gdp. Dor/pse. WDI 2000. EA. Employment agriculture, % total employment. WDI 2000. ES. Employment services, % total employment. WDI 2000. EF. Index ethnic fractionalization. Alesina et al. (2003). Gge. Central government expenditures, % GDP. WDI 2000. Gini. Gini index. WDI 2000. GFDI. Gross foreign direct investment, % GDP WDI 2000. hepu. Public Health expenditures, % GDP. WDI 2000. ir irpse. Illiteracy rate, adult (above 15). Ir/pse. WDI 2000. GDPpc. GDP constant prices 1995 US$, per capita. WDI 2000. LOI. Law and order index. Freedom House (2003). mri. 69. mrihepu. Infant mortality rate. Mri/hepu. WDI 2000. (0,15). Population [0, 15[ % total population. WDI 2000. (65,…). Population 65, % total population. WDI 2000. PRI. Political rights index. Freedom House (2003). Religious fractionalization RF. Religious fractionalization index. La Porta et al. (1999). T. Exports + Imports, % gdp. WDI 2000. UP. Urban Population, % total population. WDI 2000. (2012) 6 (1).
(18)
Imagem

Documentos relacionados
Gonçalves (2010), serão con- frontados os resultados da aplicação de testes de elicitação com dados de corpora, no sentido de avaliar o efeito de fatores linguísticos, como
Os locais escolhidos foram: cabeço onde está edificado o moinho da povoação de Dagorda (Triásico Superior (Noriano/Retiano) a Jurássico Inferior (Hetangiano/Sinemuriano));
ainda, exige que sejam eliminadas as desigualdades fácticas geradores de desigualdade de qualificação jurídica de modo que se concretize uma igualdade de fato ou
For B0 the error bars represent experimental error from several measurements of the ancestral strain, while for B48 and B144 they represent the variance between all 12
Não está prevista. Apenas o nº 2 do já citado artigo 4º do Protocolo refere a indicação dos recursos disponíveis em cada estado Membro passiveis de serem empregues em
This measurement issue is here considered in terms of efficiency measures comparing public resources - total expenditure and number of teachers per student - used by
This measurement issue is here considered in terms of efficiency measures comparing public resources – total expenditure, dimension of staff – used by Portuguese public
This measurement issue is here considered in terms of efficiency measures comparing public resources – total expenditures, dimension of staff – used by Portuguese public
