Incidence of Type 2 Diabetes in Pre-Diabetic
Japanese Individuals Categorized by HbA
1c
Levels: A Historical Cohort Study
Tetsuya Kawahara1*, Ryuichiro Imawatari1,2,3, Chie Kawahara4, Tetsuya Inazu5, Gen Suzuki6
1Kokura Medical Association Health Testing Center, Kitakyushu, Fukuoka, Japan,2Kitakyushu Medical Association Committee on Health Promotion, Kitakyushu, Fukuoka, Japan,3Kokura Medical Association, Kitakyushu, Fukuoka, Japan,4First Department of Internal Medicine, School of Medicine, University of Occupational and Environmental Health, Kitakyushu, Fukuoka, Japan,5Department of Pharmacy, Ritsumeikan University, Kusatsu, Shiga, Japan,6Department of Internal Medicine, International University of Health and Welfare Clinic, Otawara, Tochigi, Japan
*k-tetsuy@med.uoeh-u.ac.jp
Abstract
Objective
Reported incidence of type 2 diabetes estimated at the pre-diabetic stage differs widely (2.3–18.1% per year). Because clinicians need to know the risk of incident diabetes after a diagnosis of pre-diabetes, our objective was to estimate precise incidence of diabetes using baseline HbA1clevels.
Methods
A historical cohort study using electronic medical record data obtained between January 2008 and December 2013. A total of 52,781 individuals with HbA1c<6.5% were assigned to one of six groups categorized by baseline HbA1clevel:5.5% (n=34,616), 5.6–5.7% (n=9,388), 5.8–5.9% (n=4,664), 6.0–6.1% (n= 2,338), 6.2–6.3% (n=1,257), and 6.4% (n=518). Participants were tracked until a subsequent diagnosis of diabetes or end of follow-up during a period of 5 years.
Results
During the follow-up period (mean 3.7 years), 4,369 participants developed diabetes. The in-cidence of diabetes in the first year was 0.7, 1.5, 2.9, 9.2, 30.4, and 44.0% in the six HbA1c groups, respectively. At five years the incidence was 3.6, 8.9, 13.8, 27.5, 51.6, and 67.8%, re-spectively (p<0.0001 comparing the HbA1c5.5% group to the other groups). After adjust-ment for confounding factors, the hazard ratios compared with the HbA1c5.5% group were significantly elevated: 2.3 (95%CI 2.0–2.5), 3.4 (95%CI 2.9–3.7), 8.8 (95%CI 8.0–10.1), 26.3 (95%CI 23.3–30.1), and 48.7 (95%CI 40.8–58.1) in the five HbA1cgroups (p<0.0001).
OPEN ACCESS
Citation:Kawahara T, Imawatari R, Kawahara C, Inazu T, Suzuki G (2015) Incidence of Type 2 Diabetes in Pre-Diabetic Japanese Individuals Categorized by HbA1cLevels: A Historical Cohort
Study. PLoS ONE 10(4): e0122698. doi:10.1371/ journal.pone.0122698
Academic Editor:An Pan, National University of Singapore, SINGAPORE
Received:August 26, 2014
Accepted:February 12, 2015
Published:April 8, 2015
Copyright:© 2015 Kawahara et al. This is an open access article distributed under the terms of the Creative Commons Attribution License, which permits unrestricted use, distribution, and reproduction in any medium, provided the original author and source are credited.
Data Availability Statement:Ethical considerations prevent public sharing of data. Data are available from the Kokura Medical Association Health Testing Center's Ethics Committee. Requests may be sent to Tetsuya Kawahara / k-tetsuy@med.uoeh-u.ac.jp.
Funding:The authors received no specific funding for this work.
Conclusion
By fractionating baseline HbA1clevels into narrower HbA1crange groups, accuracy of estimating the incidence of type 2 diabetes in subsequent years was increased. The risk of developing diabetes increased with increasing HbA1clevels, especially with the HbA1c level6.2% in the first follow-up year.
Introduction
Diabetes mellitus is a major burden to healthcare systems and societies worldwide [1–6]. The increasing economic burden of diabetes results in large part from the increase in the number of people with diagnosed diabetes. Five hundred and ninety two million people worldwide will have type 2 diabetes by the year 2030 [7]. From the perspectives of public health, medical care, and economics, it is preferable to detect individuals at high risk for diabetes (i.e., pre-diabetes: impaired fasting glucose and/or impaired glucose tolerance) early, and initiate interventions such as lifestyle modification.
The incidence of type 2 diabetes among pre-diabetic individuals has been reported and inci-dent rates differ greatly from 2.3% to 18.1% per year [8–14]. Although there are many previous studies that estimated the incidence of diabetes based on baseline HbA1clevels, those levels were roughly categorized by increments of 0.5% or more [8,10–12,14], resulting in widely differing and less accurate estimated incidences. If properly educated, diabetic individuals may pre-vent the occurrence of type 2 diabetes by implementing lifestyle changes. Therefore, it is impor-tant for both clinicians and pre-diabetic individuals to be empowered by knowing the precise risk of diabetic incidence based on measured HbA1c. Hence we conducted a historical cohort study to investigate the incident risk of diabetes during 5 years of follow-up by dividing baseline HbA1clevels into 6 narrower intervals—5.5%, 5.6–5.7%, 5.8–5.9%, 6.0–6.1%, 6.2–6.3%, and 6.4%—using electronic medical record data obtained from annual medical examinations.
Somewhat unique to Japan, most adults undergo an annual medical examination either in their work place or in the community. During the examination, fasting plasma glucose and/or HbA1clevels are measured to evaluate the status of glucose metabolism. Using those data, our study could provide more precise information about the magnitude of diabetes risk in pre-diabetic subjects.
Methods
Study design
This historical cohort study was community based, including 60,975 participants at one health-care center and 27 clinics. All participants had an HbA1ctest during at least one annual medical examination in the baseline period, January 1, 2008 to December 31, 2008. They were inter-viewed by trained nurses at the time of each annual examination using standard questionnaires to gather information about demographic characteristics, medical history, and health-related habits. Height, weight, and blood pressure measurements as well as laboratory tests were con-ducted at the same time.
Every blood specimen was assayed for HbA1clevels in the same laboratory (Kitakyushu Central Laboratory Testing Center, Kitakyushu, Japan). High-performance liquid chromatog-raphy using an ADAMS A1c automatic glycohemoglobin analyzer (ARKRAY, Kyoto, Japan) was performed to analyze samples from January 1, 2008 to April 11, 2010. Latex agglutination Promotion, a unit of Kitakyushu Medical Association.
immunoassay using a DM-JACK Ex. analyzer (KYOWA MEDEX, Tokyo, Japan) was per-formed from April 12, 2010 to December 31, 2013. Therefore, all the HbA1cmeasurements at baseline were performed by High-performance liquid chromatography, while measurements during the follow-up period were done by two methods. The accuracy of the equipment used to measure HbA1cwas also validated. At an HbA1cof 6.4%, the standard error (SE) was 0.015, and the 95% confidence interval (CI) was 6.371–6.429%. The SEs were from 0.0131 to 0.0162 for the other HbA1clevels. The 95% CIs for HbA1clevels were within ± 0.0318%. Therefore, the probability that participants were assigned to the wrong baseline HbA1cgroup was<0.05. The study endpoint was whether a diagnosis of diabetes occurred during the 5-year follow-up period.
The values for HbA1c(%) in Japan were estimated using the Japan Diabetes Society (JDS) defi-nition until April 1, 2012. We used the following formula to convert from the JDS value to the Na-tional Glycohemoglobin Standardization Program (NGSP) equivalent: NGSP (%) = JDS (%) + 0.4 [15] and evaluated all HbA1cdata using NGSP values.
Ethics statement
This study was approved by the Review Boards of the Kokura Medical Association Health Test-ing Center and the Kitakyushu Medical Association Committee on Health Promotion. The study was conducted according to the principles expressed in the Declaration of Helsinki. Par-ticipants did not provide verbal or written informed consent at the time of examination, but were allowed to refuse participation. This procedure conforms to the Japanese Ethical Guide-lines for Epidemiological Research; informed consent is not strictly required for observational studies using existing data, but researchers should disclose information on the objective and conduct of the study and provide prospective subjects an opportunity to refuse inclusion of their data in the research [16]. Participant’s records/information was anonymized and de-identified prior to analysis.
Subjects
Participants comprised mainly Japanese residents and workers in Kitakyushu city who under-went annual examinations for health screening. Inclusion criteria were that they were appar-ently healthy and had attended at least one out-patient visit at any time during the follow-up period(i.e., between the date of baseline HbA1ctesting and December 31, 2013) or before a di-agnosis of diabetes. Participants' records were evaluated to assure that they had at least one outpatient visit, no HbA1c6.5%, no diagnosis of diabetes, and no medication for diabetes.
Using these inclusion criteria, 2,705 subjects were excluded from 60,975 potential partici-pants for having HbA1c6.5% or having been diagnosed with diabetes, and 5,489 subjects were excluded who failed to revisit during the follow-up period (S1 Table). Subjects who had missing values for participants’records or who were lost to follow-up after one or more revisit (s) during the follow-up period were eligible and included in the analysis (S2 Table). Thus, a total of 52,781 subjects had usable data for this study. During the follow-up period, diabetes onset was identified using an accepted method to ascertain diabetic status [17,18],i.e., HbA1c
6.5%, fasting plasma glucose126 mg/dl, casual plasma glucose200 mg/dl, or initiation of any medication for diabetes treatment.
Statistical analysis
calculation. Descriptive statistics were used to describe the study population at baseline. The me-dian and range were calculated for continuous variables. Frequencies and proportions were cal-culated for categorical variables. The baseline characteristics of subjects who developed diabetes in the follow-up period were compared with those who did not develop diabetes. The nonpara-metric Wilcoxon rank-sum test was used to compare medians for continuous variables. The Chi-square test was used to compare proportions for categorical variables. The Kaplan—Meier procedure was used to estimate the diabetes-free probability, and the log-rank statistic was used to test for overall differences in cumulative incidence of diabetes among the baseline HbA1c lev-els. A Cox proportional hazards model, adjusted for age, sex, body mass index (BMI), hyperten-sion, family history of diabetes, exercise habit, smoking habit, and elevated alcohol consumption was used to compare the risk of developing diabetes for each baseline HbA1clevel (using HbA1c
5.5% as the reference group). Unadjusted and multivariate adjusted hazard ratios were calcu-lated. Cox proportional hazards models were also stratified by age, sex, BMI, hypertension, or smoking habit, respectively. The Cox model was also used to test the multiplicative effect of other risk factors on HbA1c: age, sex, BMI, hypertension, and smoking habit. All tests were two-tailed. The Bonferroni correction was used to correct significance levels for multiple compari-sons: because there were six groups and 15 comparisons,Pvalues<0.0033 (= 0.05/15) were
considered to indicate statistical significance. Statistical analysis was performed using GraphPad Prism ver.5 (GraphPad software, La Jolla, CA, USA) for the Kaplan-Meier analysis and SPSS ver.15 (SPSS Inc., Chicago, IL, USA) for other analyses.
Results
The median age was 67 years (range: 20–89 years), and 41.6% were males. Mean follow-up period was 3.7 years. During follow-up, 4,369 (8.3%) participants developed diabetes. Higher incidence of diabetes was significantly associated with male sex, BMI, blood pressure, hyper-tension, family history of diabetes, absence of exercise habit, smoking habit, and heavy drink-ing habit (p<0.0001) (Table 1).
Fig 1presents Kaplan—Meier curves of diabetes-free probability based on the baseline HbA1ccategories. Compared with the reference group (HbA1c5.5%), the other groups had significantly lower diabetes-free probability (log-rankPvalues<0.0001). Each group was also
significantly different from the other groups (log-rankPvalues<0.0001). Diabetes incidence
during the first follow-up year was 0.7, 1.5, 2.9, 9.2, 30.4, and 44.0% for the baseline HbA1c 5.5, 5.6–5.7, 5.8–5.9, 6.0–6.1, 6.2–6.3, and 6.4% groups, respectively. Incidence over the entire follow-up period was 3.6, 8.9, 13.8, 27.5, 51.6, and 67.8% for the same groups. The increment of incidence was steeper in the two groups with HbA1c6.2% (6.2–6.3 and 6.4% groups), es-pecially in the first follow-up year (p0.0093,S1 Text). Since the rate of revisit in each subse-quent year was greater than 99% in every HbA1cgroup (data not shown), and because rate of loss to follow-up over 5 years did not differ significantly among HbA1cgroups (S2 Table), inci-dence rates would not be biased by participation rate.
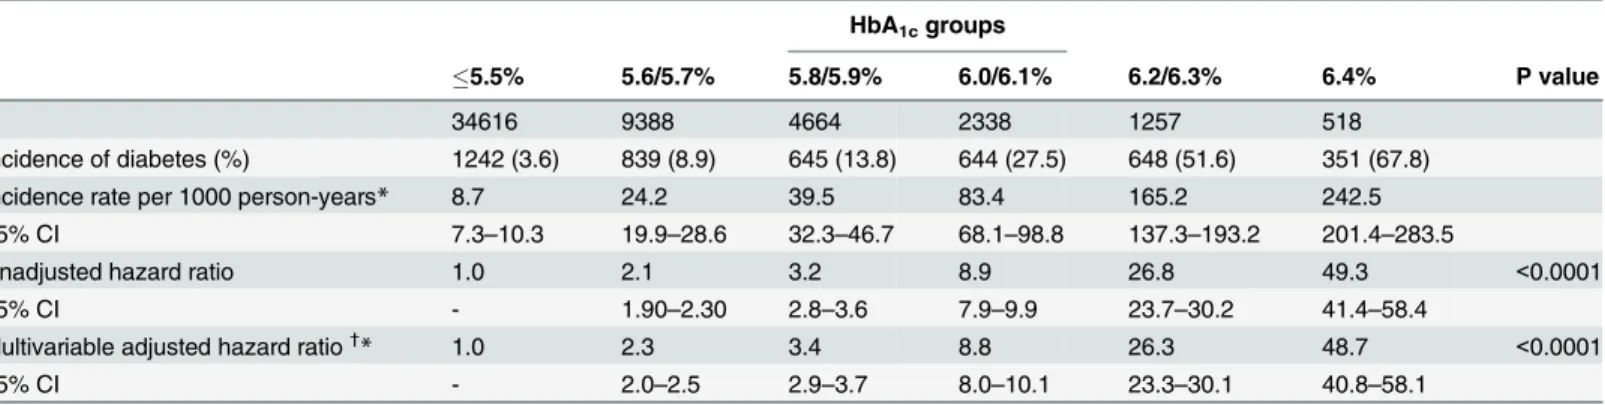
A Cox proportional hazards model was used to evaluate risk of developing diabetes during the follow-up period (Table 2). After adjusting for age, sex, BMI, hypertension, family history of diabetes, exercise habit, smoking habit, and heavy alcohol consumption, the hazard ratio in-creased with increasing HbA1c: 2.3 (95%CI 2.0–2.5), 3.4 (95%CI 2.9–3.7), 8.8 (95%CI 8.0–10.1), 26.3 (95%CI 23.3–30.1), and 48.7 (95%CI 40.8–58.1) for the five ordered groups (compared to the reference group), respectively.
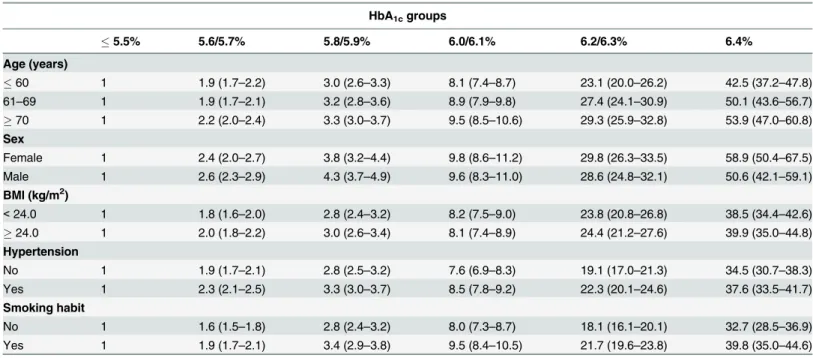
after stratification by each risk factor, age (60, 61–69,70), sex (male or female), BMI (<24,
24 kg/m2), hypertension (presence or absence), or smoking habit (presence or absence), one by one in the Cox model (Table 3). Compared with the reference group (HbA1c5.5%), the risk for incident diabetes increased steadily with increasing baseline HbA1cbut the risk did not differ between stratified subgroups.
Discussion
In this large-scale cohort study, we found that baseline HbA1clevels were highly informative in predicting subsequent development of type 2 diabetes. Baseline HbA1clevel was an indepen-dent risk factor for developing diabetes, and the risk increased with increasing baseline HbA1c
Table 1. Baseline characteristics of the study population.
All subjects Diabetes Non-diabetes P value Odds ratio (95% CI)¶
n 52781 4369 (8.3%) 48412 (91.7%)
Age (years) 67 (20–89) 67 (37–74) 67 (20–89) 0.6712
Sex
Female 30824 (58.4) 1874 (42.9) 28950 (59.8) - 1.00
Male 21957 (41.6) 2495 (57.1) 19462 (40.2) <0.0001 1.97 (1.85–2.11)
Body mass index (kg/m2) 23.0 (9.0–41.0) 24.0 (11.0–41.0) 23.0 (9.0–35.0) <0.0001 1.18 (1.09–1.27)
Blood pressure (mmHg)
Systolic 133 (82–231) 139 (88–231) 132 (82–225) <0.0001
Diastolic 75 (50–118) 77 (50–114) 74 (50–118) <0.0001
Hypertension*
No 28100 (53.2) 1909 (43.7) 26191 (54.1) - 1.00
Yes 24681 (46.8) 2460 (56.3) 22221 (45.9) <0.0001 1.49 (1.39–1.58)
Family history of diabetes†
No 31285 (59.3) 1560 (35.7) 29725 (61.4) - 1.00
Yes 21496 (40.7) 2809 (64.3) 18687 (38.6) <0.0001 2.84 (2.67–3.04)
Exercise habit‡
No 35748 (67.7) 3264 (74.7) 34484 (67.1) - 1.00
Yes 17033 (32.3) 1105 (25.3) 15928 (32.9) <0.0001 0.69 (0.63–0.74)
Smoking habit§
No 42523 (80.6) 3019 (69.1) 39504 (81.6) - 1.00
Yes 10258 (19.4) 1350 (30.9) 8908 (18.4) <0.0001 1.96 (1.83–2.10)
Drinking habit||
No 42314 (80.2) 3342 (76.5) 38972 (80.5) - 1.00
Yes (moderate) 2670 (5.0) 201 (4.6) 2469 (5.1) 0.446 0.95 (0.82–1.09)
Yes (heavy) 7797 (14.8) 826 (18.9) 6971 (14.4) <0.0001 1.37 (1.29–1.53)
Values are expressed as medians (range or percentage).
*Hypertension: Yes = systolic blood pressure140 mmHg, diastolic blood pressure90 mmHg, or treated with anti-hypertension drugs.
†Family history of diabetes: Yes = third-degree relatives with diabetes. ‡
Exercise habit: Yes = exercised for30 min each time and two or more times per week.
§Smoking habit: No = never smoked or quit smoking>6 months ago.
||Drinking habit (alcohol consumption habit): Yes (moderate) = consumed alcohol3 per week and180 mL sake (same as 110 mL distilled spirits
(shochu), 60 mL whisky, 200 mL wine, or 500 mL beer) at a time. Yes (heavy) = consumed alcohol3 times per week and180 mL sake (same as 110 mL distilled spirits (shochu), 60 mL whisky, 200 mL wine, or 500 mL beer) at a time.
¶Odds ratios were adjusted by age, sex, and body mass index.
95% CI: 95% confidence interval
levels. The hazard ratios exceeded 26 and 48 in the HbA1c6.2–6.3% and 6.4% groups, respec-tively, compared with the normal glucose group (HbA1c5.5%). To our knowledge, this is the first study to analyze incidence of diabetes for baseline HbA1cintervals as narrow as 0.2%.
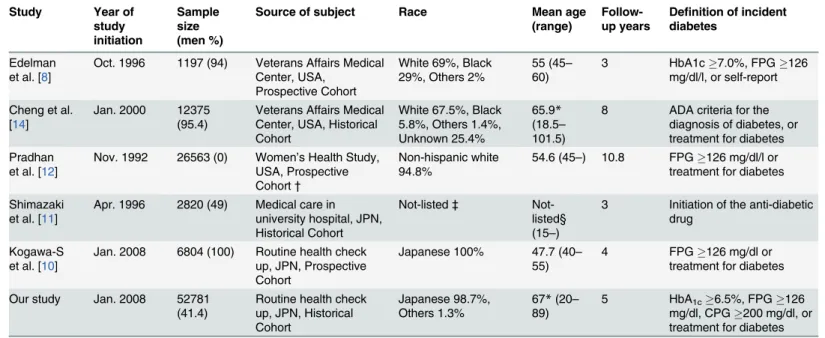
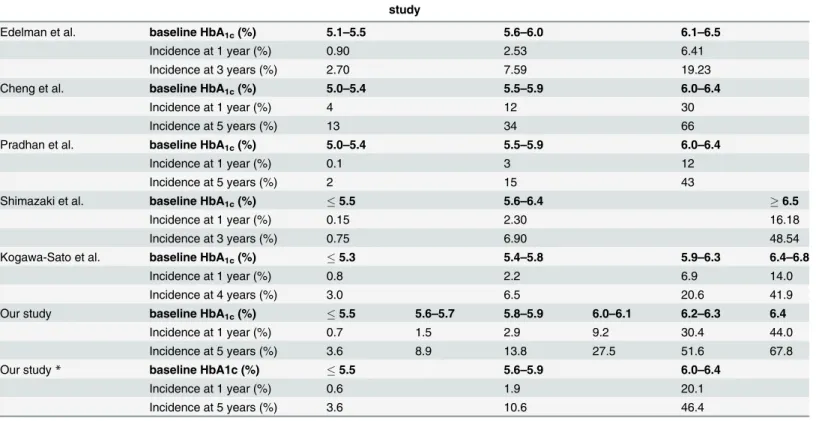
InTable 4andTable 5, we compared our results with those of five previous studies that demonstrated the value of HbA1cfor predicting onset of diabetes [8,10–12,14]. Among these, our study had the largest sample size (n = 52,781) for both genders. Two other large studies with more than 10,000 subjects had a predominance of either males or females [12,14]. Al-though all studies consistently showed that risk increases with increasing baseline HbA1clevel, the magnitude of incidence in the first year differed from study to study. Individuals with a baseline HbA1cof 6.0–6.4% had an incident rate of diabetes of 12–30% in the first year and of 43–66% in 5 years [12,14]. Since case detection criteria were similar in the latter three studies,
Fig 1. Kaplan—Meier survival curves for incident diabetes during the 5-year study period,
differentiated by baseline HbA1clevels.Each curve had a significantly higher risk compared with the
reference group, the curve for HbA1c5.5% (log-rank P value<0.0001).
doi:10.1371/journal.pone.0122698.g001
Table 2. The risk of diabetes incidence based on the baseline HbA1c levels in the Cox proportional-hazard model.
HbA1cgroups
5.5% 5.6/5.7% 5.8/5.9% 6.0/6.1% 6.2/6.3% 6.4% P value
n 34616 9388 4664 2338 1257 518
Incidence of diabetes (%) 1242 (3.6) 839 (8.9) 645 (13.8) 644 (27.5) 648 (51.6) 351 (67.8)
Incidence rate per 1000 person-years* 8.7 24.2 39.5 83.4 165.2 242.5
95% CI 7.3–10.3 19.9–28.6 32.3–46.7 68.1–98.8 137.3–193.2 201.4–283.5
Unadjusted hazard ratio 1.0 2.1 3.2 8.9 26.8 49.3 <0.0001
95% CI - 1.90–2.30 2.8–3.6 7.9–9.9 23.7–30.2 41.4–58.4
Multivariable adjusted hazard ratio†
* 1.0 2.3 3.4 8.8 26.3 48.7 <0.0001
95% CI - 2.0–2.5 2.9–3.7 8.0–10.1 23.3–30.1 40.8–58.1
*Actual person-years in each HbA1c group were 142,029, 34,614, 16,277, 7,718, 3,923, and 1,447.
†
Adjusted for age (60,60–69,70), sex, body mass index (BMI), hypertension, family history of diabetes, exercise habit, smoking habit, heavy alcohol consumption. Thepvalues of interaction terms were 0.07, 0.37, 0.49, 0.62 and 0.14 for (HbA1c x age), (HbA1c× sex), (HbA1c× BMI), (HbA1c× hypertension),
and (HbA1c× smoking habit), respectively.
95% CI: 95% confidence interval; HbA1c: hemoglobin A1c
differences in ethnicity, gender, mean age, and risk factors could influence the magnitude of the incidence rates.
Previous studies evaluated the incidence of diabetes based on intervals of HbA1cof width 0.5% or greater [8,10–12,14]. The cumulative incidence of diabetes from pre-diabetic stage dif-fered greatly from 2.3% to 18.1% per year [8–14]. Our study clearly demonstrated that the inci-dence of diabetes elevates significantly with increasing baseline HbA1ceven between intervals as narrow as 0.2%. Even if an individual is diagnosed as pre-diabetes based on the levels of HbA1cranging from 5.6 to 6.4%, the subsequent incidence of diabetes differs widely depending on the level of HbA1cwithin that range. Therefore, it is important and beneficial for clinicians to fractionate baseline HbA1cinto narrower groups in the 5.6–6.4% range so as to estimate more accurate incidence of diabetes in each group.
As for other risk factors, we obtained results similar to those reported by others. Conven-tional risk factors such as male sex [14,19], increasing BMI [20,21], hypertension [14,19,20], family history of diabetes [20,22], non-exercise habit [23–25], smoking habit [20,26–28], and heavy alcohol consumption [20,22,29] were confirmed to be significant risk factors for inci-dence of diabetes.
It is obvious that participants with higher levels of HbA1cwill sooner pass the threshold of diabetes (HbA1c6.5%, fasting plasma glucose126 mg/dl, or casual glucose200 mg/dl). In this context, individuals with HbA1c6.2% showed a higher incidence of diabetes in the first follow-up year compared with those in later follow-up periods (P0.0093). Our results therefore suggest that lifestyle changes should be implemented immediately after observing a result of HbA1c6.2%.
Table 3. The risk of diabetes incidence based on the baseline HbA1c levels after the stratification of major risk factor in the Cox proportional-haz-ard model.
HbA1cgroups
5.5% 5.6/5.7% 5.8/5.9% 6.0/6.1% 6.2/6.3% 6.4%
Age (years)
60 1 1.9 (1.7–2.2) 3.0 (2.6–3.3) 8.1 (7.4–8.7) 23.1 (20.0–26.2) 42.5 (37.2–47.8) 61–69 1 1.9 (1.7–2.1) 3.2 (2.8–3.6) 8.9 (7.9–9.8) 27.4 (24.1–30.9) 50.1 (43.6–56.7)
70 1 2.2 (2.0–2.4) 3.3 (3.0–3.7) 9.5 (8.5–10.6) 29.3 (25.9–32.8) 53.9 (47.0–60.8) Sex
Female 1 2.4 (2.0–2.7) 3.8 (3.2–4.4) 9.8 (8.6–11.2) 29.8 (26.3–33.5) 58.9 (50.4–67.5) Male 1 2.6 (2.3–2.9) 4.3 (3.7–4.9) 9.6 (8.3–11.0) 28.6 (24.8–32.1) 50.6 (42.1–59.1) BMI (kg/m2)
<24.0 1 1.8 (1.6–2.0) 2.8 (2.4–3.2) 8.2 (7.5–9.0) 23.8 (20.8–26.8) 38.5 (34.4–42.6)
24.0 1 2.0 (1.8–2.2) 3.0 (2.6–3.4) 8.1 (7.4–8.9) 24.4 (21.2–27.6) 39.9 (35.0–44.8) Hypertension
No 1 1.9 (1.7–2.1) 2.8 (2.5–3.2) 7.6 (6.9–8.3) 19.1 (17.0–21.3) 34.5 (30.7–38.3) Yes 1 2.3 (2.1–2.5) 3.3 (3.0–3.7) 8.5 (7.8–9.2) 22.3 (20.1–24.6) 37.6 (33.5–41.7) Smoking habit
No 1 1.6 (1.5–1.8) 2.8 (2.4–3.2) 8.0 (7.3–8.7) 18.1 (16.1–20.1) 32.7 (28.5–36.9) Yes 1 1.9 (1.7–2.1) 3.4 (2.9–3.8) 9.5 (8.4–10.5) 21.7 (19.6–23.8) 39.8 (35.0–44.6)
Values are expressed as adjusted hazard ratios (95% confidence intervals) calculated by Cox proportional-hazard models.
The analyses were adjusted by age, sex, BMI, hypertension, family history of diabetes, exercise habit, smoking habit, and heavy alcohol consumption except each factor of stratification.
We adopted the Japanese guideline that HbA1clevels between 5.6 and 6.4% correspond to a pre-diabetic stage [17,30]. A fasting plasma glucose of 110 mg/dl and a 2-h postprandial plasma glucose of 140 mg/dl correspond to an HbA1cof 5.6% and a fasting plasma glucose of 126 mg/ dl and a 2-h postprandial plasma glucose of 200 mg/dl correspond to an HbA1cof 6.5% [30,31]. We also defined diabetes onset as a single result of an HbA1c6.5%, fasting plasma glucose126 mg/dl, casual plasma glucose200 mg/dl, or prescription of any medication for treatment of diabetes. The ADA and JDS guidelines recommend that a repeated examination [18,31] and an HbA1ctest plus plasma glucose check (fasting, 2-h of oral glucose tolerance test and/or casual) [17] to be conducted for diagnosis of diabetes. However, the JDS has also ex-pressed that for the purpose of estimating frequency of diabetes in an epidemiological survey,
“diabetes mellitus”can be substituted for the determination of“diabetic type”from a single ex-amination [17]. The possibility that an individual with either HbA1c6.5%, fasting plasma glucose126 mg/dl, or casual plasma glucose200 mg/dl is actually non-diabetic, if any, is slight. We propose that treating them as diabetic patients after a single result of examination is beneficial to them and to society.
There are several limitations to this study. Firstly, the participants were generally old (medi-an age 67 years old) (medi-and were Jap(medi-anese. Thus, generalization to a younger population or to other ethnic groups should be made with caution. Secondly, there was a considerable propor-tion of individuals who did not revisit (n = 5,489 or 9.0%). However, there were no significant differences in baseline HbA1clevels between the follow-up and the non-revisit groups (S1 Table). Therefore, we believe that non-revisit was random and the current results should not be biased. Thirdly, there were 935 participants who were enrolled into the study but had miss-ing values for participants’records, or who were lost to follow-up before diagnosis of diabetes
Table 4. Characteristics of the studies which evaluated the incidence of type 2 diabetes using baseline HbA1clevels.
Study Year of study initiation
Sample size (men %)
Source of subject Race Mean age
(range)
Follow-up years
Definition of incident diabetes
Edelman et al. [8]
Oct. 1996 1197 (94) Veterans Affairs Medical Center, USA,
Prospective Cohort
White 69%, Black 29%, Others 2%
55 (45–
60)
3 HbA1c7.0%, FPG126 mg/dl/l, or self-report
Cheng et al. [14]
Jan. 2000 12375 (95.4)
Veterans Affairs Medical Center, USA, Historical Cohort
White 67.5%, Black 5.8%, Others 1.4%, Unknown 25.4%
65.9* (18.5–
101.5)
8 ADA criteria for the diagnosis of diabetes, or treatment for diabetes Pradhan
et al. [12]
Nov. 1992 26563 (0) Women’s Health Study, USA, Prospective Cohort†
Non-hispanic white 94.8%
54.6 (45–) 10.8 FPG126 mg/dl/l or treatment for diabetes
Shimazaki et al. [11]
Apr. 1996 2820 (49) Medical care in university hospital, JPN, Historical Cohort
Not-listed‡ Not-listed§ (15–)
3 Initiation of the anti-diabetic drug
Kogawa-S et al. [10]
Jan. 2008 6804 (100) Routine health check up, JPN, Prospective Cohort
Japanese 100% 47.7 (40–
55)
4 FPG126 mg/dl or treatment for diabetes
Our study Jan. 2008 52781 (41.4)
Routine health check up, JPN, Historical Cohort
Japanese 98.7%, Others 1.3%
67*(20–
89)
5 HbA1c6.5%, FPG126
mg/dl, CPG200 mg/dl, or treatment for diabetes
*Median age
†
This study advocated that it was a prospective cohort, but it was a part of a randomized clinical trial.
‡
Race was not listed, but almost 100% of participants might be Japanese.
§Mean age was not listed, but 15–39yr., 40–59yr., and59yr. were 24, 32, 44%, respectively.
FPG: fasting plasma glucose; CPG: casual plasma glucose
after at least one revisit during the follow-up period. They were assigned to the non-diabetes group and included in the analysis. Demographic and clinical characteristics of these individu-als were quite similar to the remaining cohort members (S2 Table). Although their absence from the cohort can introduce bias in the ascertainment of both exposure and outcome, we be-lieve that both the small number of these individuals and their demographic characteristics make it unlikely that this substantially affected the reported incidence of diabetes. Lastly, sam-ple-size in the higher HbA1ccategories was not adequately large.
In conclusion, the present study indicates that the use of 0.2% intervals of baseline HbA1c increases the accuracy of estimates of incidence of type 2 diabetes. Risk of developing diabetes increased with increasing HbA1clevel, especially with HbA1c6.2% in the first follow-up year. Compared with previous studies, this study provides more accurate estimates of the changes in the incidence of diabetes as baseline HbA1clevels change. We hope that clinicians can obtain precise risk of diabetes development for pre-diabetic patients by referring to the results of this study, and that they can use these results to lower the risk of diabetes.
Supporting Information
S1 Table. The distribution of baseline HbA1clevels in the follow-up and non-revisit
indi-viduals. (DOCX)
Table 5. Characteristics of the studies which evaluated the incidence of type 2 diabetes using baseline HbA1clevels.
study
Edelman et al. baseline HbA1c(%) 5.1–5.5 5.6–6.0 6.1–6.5
Incidence at 1 year (%) 0.90 2.53 6.41
Incidence at 3 years (%) 2.70 7.59 19.23
Cheng et al. baseline HbA1c(%) 5.0–5.4 5.5–5.9 6.0–6.4
Incidence at 1 year (%) 4 12 30
Incidence at 5 years (%) 13 34 66
Pradhan et al. baseline HbA1c(%) 5.0–5.4 5.5–5.9 6.0–6.4
Incidence at 1 year (%) 0.1 3 12
Incidence at 5 years (%) 2 15 43
Shimazaki et al. baseline HbA1c(%) 5.5 5.6–6.4 6.5
Incidence at 1 year (%) 0.15 2.30 16.18
Incidence at 3 years (%) 0.75 6.90 48.54
Kogawa-Sato et al. baseline HbA1c(%) 5.3 5.4–5.8 5.9–6.3 6.4–6.8
Incidence at 1 year (%) 0.8 2.2 6.9 14.0
Incidence at 4 years (%) 3.0 6.5 20.6 41.9
Our study baseline HbA1c(%) 5.5 5.6–5.7 5.8–5.9 6.0–6.1 6.2–6.3 6.4
Incidence at 1 year (%) 0.7 1.5 2.9 9.2 30.4 44.0
Incidence at 5 years (%) 3.6 8.9 13.8 27.5 51.6 67.8
Our study* baseline HbA1c (%) 5.5 5.6–5.9 6.0–6.4
Incidence at 1 year (%) 0.6 1.9 20.1
Incidence at 5 years (%) 3.6 10.6 46.4
*We fractionated baseline HbA1clevels into5.5%, 5.6–5.9% and 6.0–6.4%, and evaluated the incidence of diabetes in the same study.
FPG: fasting plasma glucose; CPG: casual plasma glucose
S2 Table. The distribution of baseline HbA1clevels in the follow-up and lost to follow-up
participants (DOCX)
S1 Text. Test of the risk difference among first follow-up years. (DOCX)
Acknowledgments
We thank Ms. Akemi Sato for her technical assistance in the study.
Author Contributions
Conceived and designed the experiments: TK. Performed the experiments: TK RI CK. Ana-lyzed the data: TK GS. Contributed reagents/materials/analysis tools: TK CK GS. Wrote the paper: TK RI CK TI GS.
References
1. Herman WH The economics of diabetes prevention. The Medical clinics of North America. 2011; 95: 373–384, viii. doi:10.1016/j.mcna.2010.11.010PMID:21281839
2. American Diabetes A Economic costs of diabetes in the U.S. In 2007. Diabetes Care. 2008; 31: 596–615. doi:10.2337/dc08-9017PMID:18308683
3. Divajeva D, Marsh T, Logstrup S, Kestens M, Vemer P, Kriaucioniene V, et al. Economics of chronic diseases protocol: cost-effectiveness modelling and the future burden of non-communicable disease in Europe. BMC public health. 2014; 14: 456. doi:10.1186/1471-2458-14-456PMID:24886110 4. Kankeu HT, Saksena P, Xu K, Evans DB The financial burden from non-communicable diseases in
low- and middle-income countries: a literature review. Health research policy and systems / BioMed Central. 2013; 11: 31. doi:10.1186/1478-4505-11-31PMID:23947294
5. Liu X, Li C, Gong H, Cui Z, Fan L, Yu W, et al. An economic evaluation for prevention of diabetes melli-tus in a developing country: a modelling study. BMC public health. 2013; 13: 729. doi: 10.1186/1471-2458-13-729PMID:23919839
6. Upadhyay RP, Misra P, Chellaiyan VG, Das TK, Adhikary M, Chinnakali P, et al. Burden of diabetes mellitus and prediabetes in tribal population of India: a systematic review. Diabetes research and clini-cal practice. 2013; 102: 1–7. doi:10.1016/j.diabres.2013.06.011PMID:23876547
7. InternationalDiabetesFederation (2013) Diabetes Atlas sixth edition. pp. 155.
8. Edelman D, Olsen MK, Dudley TK, Harris AC, Oddone EZ Utility of hemoglobin A1c in predicting diabe-tes risk. Journal of general internal medicine. 2004; 19: 1175–1180. PMID:15610327
9. Toshihiro M, Saito K, Takikawa S, Takebe N, Onoda T, Satoh J Psychosocial factors are independent risk factors for the development of Type 2 diabetes in Japanese workers with impaired fasting glucose and/or impaired glucose tolerance. Diabetic medicine: a journal of the British Diabetic Association. 2008; 25: 1211–1217. doi:10.1111/j.1464-5491.2008.02566.xPMID:19046200
10. Sato KK, Hayashi T, Harita N, Yoneda T, Nakamura Y, Endo G, et al. Combined measurement of fast-ing plasma glucose and A1C is effective for the prediction of type 2 diabetes: the Kansai Healthcare Study. Diabetes Care. 2009; 32: 644–646. doi:10.2337/dc08-1631PMID:19131461
11. Shimazaki T, Kadowaki T, Ohyama Y, Ohe K, Kubota K Hemoglobin A1c (HbA1c) predicts future drug treatment for diabetes mellitus: a follow-up study using routine clinical data in a Japanese university hospital. Translational research: the journal of laboratory and clinical medicine. 2007; 149: 196–204. PMID:17383593
12. Pradhan AD, Rifai N, Buring JE, Ridker PM Hemoglobin A1c predicts diabetes but not cardiovascular disease in nondiabetic women. The American journal of medicine. 2007; 120: 720–727. PMID: 17679132
13. Goto A, Goto M, Noda M, Tsugane S Incidence of type 2 diabetes in Japan: a systematic review and meta-analysis. PloS one. 2013; 8: e74699. doi:10.1371/journal.pone.0074699PMID:24040326 14. Cheng P, Neugaard B, Foulis P, Conlin PR Hemoglobin A1c as a predictor of incident diabetes.
15. Kashiwagi A, Kasuga M, Araki E, Oka Y, Hanafusa T, Ito H, et al. International clinical haemonization of glycated hemoglobin in Japan: From Japan Diabetes Society to National Glycohemoglobin Standardi-zation Program values. Journal of diabetes investigation. 2012; 3: 39–40. doi:10.1111/j.2040-1124. 2012.00207.xPMID:24843544
16. Ministry of Education C, Sports, Science and Technology, Ministry of Health Labour and Welfare (2002) Ethical Guidelines for Epidemiological Research.
17. Seino Y, Nanjo K, Tajima N, Kadowaki T, Kashiwagi A, Araki E, et al. Report of the Committee on the classification and diagnostic criteiria of diabetes mellitus. Journal of diabetes investigation. 2010; 1: 212–228. doi:10.1111/j.2040-1124.2010.00074.xPMID:24843435
18. American Diabetes A Standards of medical care in diabetes—2014. Diabetes Care. 2014; 37 Suppl 1: S14–80. doi:10.2337/dc14-S014PMID:24357209
19. Droumaguet C, Balkau B, Simon D, Caces E, Tichet J, Charles MA, et al. Use of HbA1c in predicting progression to diabetes in French men and women: data from an Epidemiological Study on the Insulin Resistance Syndrome (DESIR). Diabetes Care. 2006; 29: 1619–1625. PMID:16801588
20. Waki K, Noda M, Sasaki S, Matsumura Y, Takahashi Y, Isogawa A, et al. Alcohol consumption and other risk factors for self-reported diabetes among middle-aged Japanese: a population-based pro-spective study in the JPHC study cohort I. Diabetic medicine: a journal of the British Diabetic Associa-tion. 2005; 22: 323–331. PMID:15717882
21. Narayan KM, Boyle JP, Thompson TJ, Gregg EW, Williamson DF Effect of BMI on lifetime risk for dia-betes in the U.S. Diadia-betes Care. 2007; 30: 1562–1566. PMID:17372155
22. van 't Riet E, Dekker JM, Sun Q, Nijpels G, Hu FB, van Dam RM Role of adiposity and lifestyle in the re-lationship between family history of diabetes and 20-year incidence of type 2 diabetes in U.S. women. Diabetes Care. 2010; 33: 763–767. doi:10.2337/dc09-1586PMID:20067970
23. Helmrich SP, Ragland DR, Leung RW, Paffenbarger RS Jr. Physical activity and reduced occurrence of non-insulin-dependent diabetes mellitus. N Engl J Med. 1991; 325: 147–152. PMID:2052059 24. Rana JS, Li TY, Manson JE, Hu FB Adiposity compared with physical inactivity and risk of type 2
diabe-tes in women. Diabediabe-tes Care. 2007; 30: 53–58. PMID:17192333
25. Nakanishi N, Takatorige T, Suzuki K Daily life activity and risk of developing impaired fasting glucose or type 2 diabetes in middle-aged Japanese men. Diabetologia. 2004; 47: 1768–1775. PMID:15502924 26. Willi C, Bodenmann P, Ghali WA, Faris PD, Cornuz J Active smoking and the risk of type 2 diabetes: a
systematic review and meta-analysis. JAMA. 2007; 298: 2654–2664. PMID:18073361
27. Shi L, Shu XO, Li H, Cai H, Liu Q, Zheng W, et al. Physical activity, smoking, and alcohol consumption in association with incidence of type 2 diabetes among middle-aged and elderly Chinese men. PloS one. 2013; 8: e77919. doi:10.1371/journal.pone.0077919PMID:24223743
28. Bi Y, Wang T, Xu M, Xu Y, Li M, Lu J, et al. Advanced research on risk factors of type 2 diabetes. Diabe-tes/metabolism research and reviews. 2012; 28 Suppl 2: 32–39. doi:10.1002/dmrr.2352PMID: 23280864
29. Baliunas DO, Taylor BJ, Irving H, Roerecke M, Patra J, Mohapatra S, et al. Alcohol as a risk factor for type 2 diabetes: A systematic review and meta-analysis. Diabetes Care. 2009; 32: 2123–2132. doi:10. 2337/dc09-0227PMID:19875607
30. Ito C Classification of fasting plasma glucose levels and HbA1c. Health Screen (Ningen Dock). 2008; 22: 874–877.