Long-Term Risk of Incident Type 2 Diabetes and
Measures of Overall and Regional Obesity: The
EPIC-InterAct Case-Cohort Study
The InterAct Consortium"*
Abstract
Background:Waist circumference (WC) is a simple and reliable measure of fat distribution that may add to the prediction of type 2 diabetes (T2D), but previous studies have been too small to reliably quantify the relative and absolute risk of future diabetes by WC at different levels of body mass index (BMI).
Methods and Findings: The prospective InterAct case-cohort study was conducted in 26 centres in eight European countries and consists of 12,403 incident T2D cases and a stratified subcohort of 16,154 individuals from a total cohort of 340,234 participants with 3.99 million person-years of follow-up. We used Prentice-weighted Cox regression and random effects meta-analysis methods to estimate hazard ratios for T2D. Kaplan-Meier estimates of the cumulative incidence of T2D were calculated. BMI and WC were each independently associated with T2D, with WC being a stronger risk factor in women than in men. Risk increased across groups defined by BMI and WC; compared to low normal weight individuals (BMI 18.5– 22.4 kg/m2) with a low WC (,94/80 cm in men/women), the hazard ratio of T2D was 22.0 (95% confidence interval 14.3; 33.8) in men and 31.8 (25.2; 40.2) in women with grade 2 obesity (BMI$35 kg/m2) and a high WC (.102/88 cm). Among the large group of overweight individuals, WC measurement was highly informative and facilitated the identification of a subgroup of overweight people with high WC whose 10-y T2D cumulative incidence (men, 70 per 1,000 person-years; women, 44 per 1,000 person-years) was comparable to that of the obese group (50–103 per 1,000 person-years in men and 28–74 per 1,000 person-years in women).
Conclusions:WC is independently and strongly associated with T2D, particularly in women, and should be more widely measured for risk stratification. If targeted measurement is necessary for reasons of resource scarcity, measuring WC in overweight individuals may be an effective strategy, since it identifies a high-risk subgroup of individuals who could benefit from individualised preventive action.
Please see later in the article for the Editors’ Summary.
Citation:The InterAct Consortium (2012) Long-Term Risk of Incident Type 2 Diabetes and Measures of Overall and Regional Obesity: The EPIC-InterAct Case-Cohort Study. PLoS Med 9(6): e1001230. doi:10.1371/journal.pmed.1001230
Academic Editor:Anushka Patel, The George Institute for International Health, Australia ReceivedOctober 23, 2011;AcceptedApril 24, 2012;PublishedJune 5, 2012
Copyright:ß2012 Langenberg et al. This is an open-access article distributed under the terms of the Creative Commons Attribution License, which permits unrestricted use, distribution, and reproduction in any medium, provided the original author and source are credited.
Funding:EU Integrated Project LSHM-CT-2006-037197. The funders had no role in study design, data collection and analysis, decision to publish, or preparation of the manuscript. InterAct investigators acknowledge funding from the following agencies: KO: Danish Cancer Society; JS: ‘Heisenberg-Professorship (SP716/2-1), clinical research group (KFO218/1), and a research group (Molecular Nutrition to JS) support of the Bundesministerium fu¨r Bildung und Forschung (BMBF); MJT: Health Research Fund (FIS) of the Spanish Ministry of Health; the CIBER en Epidemiologı´a y Salud Pu´blica (CIBERESP), Spain, Murcia Regional Government (Nu 6236); JWJB, HBBdM, IS, AMWS, DLvdA, YTvdS: Dutch Ministry of Public Health, Welfare and Sports (VWS), Netherlands Cancer Registry (NKR), LK Research Funds, Dutch Prevention Funds, Dutch ZON (Zorg Onderzoek Nederland), World Cancer Research Fund (WCRF), Statistics Netherlands; verification of diabetes cases was additionally funded by NL Agency grant IGE05012 and an Incentive Grant from the Board of the UMC Utrecht; FLC: Cancer Research UK; PWF: Swedish Research Council, Novo Nordisk, Swedish Diabetes Association, Swedish Heart-Lung Foundation; GH: The county of Va¨sterbotten; RK: German Cancer Aid, Federal Ministry of Education and Research; TJK: Cancer Research UK; KK: Medical Research Council UK, Cancer Research UK; PN: Swedish Research Council; JRQ: Asturias Regional Government; BT: German Cancer Aid; Federal Ministry of Education and Research; AT: Danish Cancer Society; RT: AIRE-ONLUS Ragusa, AVIS-Ragusa, Sicilian Regional Government.
Competing Interests:The authors have declared that no competing interests exist.
Abbreviations:BMI, body mass index; EPIC, European Prospective Investigation into Cancer and Nutrition; HR, hazard ratio; SD, standard deviation; T2D, type 2 diabetes; WC, waist circumference
* E-mail: claudia.langenberg@mrc-epid.cam.ac.uk
"All authors are listed at the end of the manuscript.
Introduction
A higher body mass index (BMI) is a strong predictor of type 2 diabetes (T2D), with a linear increase in diabetes risk across the whole spectrum of BMI [1]. Although diabetes risk is highest in obese people with BMI$30 kg/m2, a great proportion of future cases comes from the large population of overweight individuals with a BMI between 25 and 30 kg/m2[2]. Recent national figures from the US and UK suggest that at least a third of the population is now overweight and another third (24% UK) is obese [3,4], with severe implications for the future burden of diabetes.
The Diabetes Prevention Program has shown that individual-level lifestyle intervention can reduce the incidence of diabetes by over 50% in high-risk individuals [5], an effect that persists for at least 10 y [6]. Current clinical practice generally relies on measurement of BMI to identify individuals at increased risk of diabetes and other adiposity-related morbidity and mortality. However, due to their high prevalence, it is financially and logistically difficult to test and intervene on all overweight and obese individuals.
BMI provides no information about body fat distribution, which distinguishes the large amount of adipose tissue located subcuta-neously from the smaller amount of intra-abdominal visceral fat, known to predict the development of diabetes over and above BMI [2,7,8]. Waist circumference (WC) is a simple measure that can be used to diagnose abdominal obesity and identify individuals at increased risk of T2D [9]. Information about WC is therefore likely to be useful in distinguishing high- and low-risk individuals at different levels of BMI, which is important for targeting those at highest absolute risk for individually focused lifestyle intervention to prevent T2D.
However, WC is not routinely assessed in clinical practice for a range of reasons [10]. Although measurement is relatively simple and cheap, it does require some training and standardisation, and this has been cited as one reason for its limited use. Another explanation is that practitioners do not appreciate the relevance of the additional information that is derived from measuring WC over and above BMI [10]. This may be because earlier studies were generally too small to estimate T2D incidence rates at different levels of BMI and WC with the precision required to guide clinical decision making or inform policy recommendations. In addition, men and women differ in the distribution of their overall and abdominal body fat, but only large-scale studies including men and women are adequately powered to investigate sex differences in associations of BMI and WC with T2D with confidence.
We use data from the European InterAct study, a case-cohort study of 12,403 cases of incident T2D and a subcohort of 16,154 participants, conducted in 26 centres in eight European countries to estimate the relative and cumulative risk of diabetes at different levels of BMI and WC, separately in men and women.
Methods
Population
The design and methods of the InterAct case-cohort study have previously been described in detail [11]. InterAct Consortium partners identified individuals with T2D in European Prospective Investigation into Cancer and Nutrition (EPIC) cohorts between 1991 and 2007 from eight of the ten countries participating in EPIC (26 centres). Prevalent diabetes was identified on the basis of baseline self-report of a history of diabetes, doctor-diagnosed diabetes, diabetes drug use, or evidence of diabetes after baseline
with a date of diagnosis earlier than the baseline recruitment date. All ascertained cases with any evidence of diabetes at baseline were excluded. Ascertainment of incident T2D involved a review of the existing EPIC datasets at each centre using multiple sources of evidence including self-report, linkage to primary-care registers, secondary-care registers, medication use (drug registers), hospital admissions and mortality data. Informa-tion from any follow-up visit or external evidence with a date later than the baseline visit was used. To increase the specificity of the case definition, we sought further evidence for all cases with information on incident T2D from fewer than two independent sources at a minimum, which included individual medical records review in some centres. Cases in Denmark and Sweden were not ascertained by self-report, but identified via local and national diabetes and pharmaceutical registers, and hence all ascertained cases were considered to be verified. Follow-up was censored at the date of diagnosis, 31 December 2007, or the date of death, whichever occurred first. A total of 340,234 participants of European descent were followed up for 3.99 million person-years (mean [range] of follow-up 11.7 [0–17.5] y), during which 12,403 verified incident cases of T2D were identified [11]. Individuals without stored blood (n= 109,625) or without reported diabetes status (n= 5,821) were excluded. A centre-stratified, random subcohort of 16,835 individuals was selected; after exclusion of 548 individuals with prevalent diabetes and 133 with unknown diabetes status, the subcohort included 16,154 individuals for analysis. Due to the random selection, this subcohort also included a random set of 778 individuals who had developed incident T2D during follow-up. Participants in the random subcohort were similar to all EPIC participants eligible for inclusion in InterAct [11]. InterAct cases were followed-up for a mean (standard deviation [SD]) of 6.9 (3.3) y; 49.8% were men. The overall incidence in InterAct was 3.8 per 1,000 person-years of follow-up; country-specific rates are included in the InterAct cohort description [11].
Measurements
Weight and height were measured with participants not wearing shoes and in light clothing or underwear in the majority of centres, as described previously [12]. WC was measured either at the narrowest circumference of the torso or at the midpoint between the lower ribs and the iliac crest. Hip circumference was measured horizontally at the level of the largest lateral extension of the hips or over the buttocks. For a subset of the Oxford (UK) participants (n= 363), only self-reported waist and hip circumferences were available. Each participant’s body weight and waist and hip circumferences were corrected for the clothing worn during measurement in order to reduce heterogeneity due to protocol differences among centres [13]. Correction included adjustment for self-reporting in Oxford participants using a prediction equation based on a comparison of self-reported and measured data in a sample of 5,000 of the Oxford general population [12,14]. BMI was calculated as weight (in kilograms)/height (in metres) squared. Waist-hip ratio was calculated and expressed as a percentage. Measures of waist or hip circumference were not performed at the centre in Umea, Sweden (n= 1,845), and were missing in an additional 173 and 193 InterAct participants for waist and hip, respectively.
As part of EPIC, standardised information on education and smoking status was collected by questionnaire at baseline [15]. Physical activity was assessed using a brief questionnaire covering occupation and recreational activity [16,17].
Overall and Regional Obesity and Incident Diabetes
Statistical Analysis
Characteristics of the subcohort are described using summary statistics (means, SDs, frequencies, and percentages) separately for men and women. Associations between anthropometric variables and the hazard of diabetes were estimated using Prentice-weighted Cox regression models with age as the underlying time scale, separately within each centre and then combined across centres using random effects meta-analysis [11]. We calculated internally derived sex-specific standardised scores based on means and SDs within the subcohort for each anthropometric measure. We divided study participants into normal weight (BMI 18.5–24.9 kg/ m2), overweight (25.0–29.9 kg/m2), or obese ($30 kg/m2) based on current World Health Organization criteria [18], and used sex-specific cut-offs to define WC as normal (,94 cm [,34.6 inches] in men and ,80 cm [31.5 inches] in women), moderately increased (94–102 cm [34.6–40 inches] in men and 80–88 cm [31.5–35 inches] in women), or large ($102 cm [$40 inches] in men and$88 cm [$35 inches] in women) [18,19]. We excluded 189 participants (172 subcohort members and 17 cases from outside the subcohort) who were underweight (BMI,18.5 kg/m2) from all analyses. Using standardised, continuous measures and categorical BMI and WC variables, we compared the effect estimates for associations between each anthropometric measure and the risk of diabetes, separately for men and women, before and after adjustments. Adjustments included other anthropometric measures, smoking, education, and physical activity, as specified for all models in the corresponding tables.
Where heterogeneity was observed in the effect estimates between centres, meta-regression was used to explore the extent to which the average age, BMI, or WC in each centre explained the heterogeneity. To assess whether the effect estimate of WC differed between men and women, a sex by WC (continuous variable) interaction term was included in the centre-specific Prentice-weighted Cox regression models, and the estimated interaction coefficients were then combined across centres using random effects meta-analysis. A similar analysis was performed to assess the evidence for a BMI group by WC group interaction using standard, clinical cut-offs.
To investigate the hazard ratio (HR) of diabetes by BMI and WC levels in more detail, we further subdivided study participants who had measures of BMI and WC into six BMI groups (18.5– 22.4, 22.5–24.9, 25–27.4, 27.5–29.9, 30.0–34.9, and$35 kg/m2). Analyses were performed using Stata version 12 (StataCorp) Within Stata, the –st- suite of commands for performing survival analysis was used.
To estimate the cumulative incidence of diabetes we performed bootstrap sampling using the Stata bsample command to recreate the full cohort by resampling with replacement from the subcohort, according to the BMI and WC distributions within the subcohort. This made it possible to estimate absolute cumulative incidences (one minus the Kaplan-Meier estimate of the survivor function) for normal, increased, and large WC groups separately within the groups of normal, overweight, and obese men and women.
Results
Characteristics of men and women who were part of the subcohort are shown in Tables 1 and 2. A total of 50.0% of men and 33.8% of women were overweight, and 16.4% of men and 15.8% of women were obese. Overweight or obese men and women were shorter and had larger WCs and waist-hip ratios than participants with normal baseline BMI (all p,0.001). Overweight or obese men and women were more likely to be
physically inactive and to be educated at primary school level or less (allp,0.001). While obese men were less likely to be never smokers and more likely to be former smokers, the opposite was observed in obese women, who were more likely to be never smokers and less likely to be former or current smokers (all p,0.001).
Contributions of BMI and Waist Circumference to the Hazard of T2D
Significant, positive associations between both BMI and WC and the hazard of T2D were observed across all countries and centres in men and women (Figures 1–4). The pooled effect estimate (HR) for a 1 SD increase in BMI (SD 3.6 kg/m2in men, 4.4 kg/m2 in women) was 1.93 (95% confidence interval 1.81; 2.06) in men and 2.07 (1.94; 2.21) in women; corresponding estimates for WC (SD 10.0 cm in men, 11.2 cm in women) were 1.95 (1.83; 2.08) in men and 2.43 (2.23; 2.64) in women (Figures 1– 4; Table 3). There was heterogeneity between centres in the HRs for both BMI and WC (Figures 1–4), which was not explained by differences in the average age of participants in the different centres. A higher average WC was associated with a lower HR per 1 SD increase in BMI; inclusion of average WC in a meta-regression model reduced theI2values from 48% to 0% in men and from 59% to 52% in women. However, average BMI did not explain the heterogeneity in the WC to T2D associations in either men or women. There was no significant interaction between BMI and WC in either men (interaction parameter estimate 0.97 [0.85; 1.11],p= 0.66) or women (interaction parameter estimate 1.10 [0.99; 1.22],p= 0.073).
Differences in Associations between Men and Women
The stronger association between WC and incident T2D in women, compared to men, became more apparent in models mutually adjusting for WC and BMI (Table 3). While the independent contributions of a sex-specific SD increase in WC and BMI to the hazard of diabetes were of similar magnitude in men (1.39 [1.19; 1.63] for WC and 1.49 [1.27; 1.73] for BMI), the increased hazard of diabetes conveyed by a larger WC as opposed to higher BMI was much larger in women (2.14 [1.87; 2.45] for WC and 1.15 [1.02; 1.30] for BMI). A disproportionately increased HR of diabetes in women (HR 11.3 [9.15; 13.9]) compared to men (HR 5.36 [4.38; 6.54]; Table 3) was also seen using sex-specific cut-offs clinically used to identify individuals with central adiposity and excess visceral fat (.102 cm [40 inches] in men and .88 cm [35 inches] in women). Consistently greater HRs were observed in women across all study centres (Figure S1), with sex ratios (HRwomen/HRmen) ranging from 1.03 to 3.31 and a
pooled sex ratio of 1.69 (1.42; 2.02). The higher hazard associated with greater WC in women was not explained by confounding by BMI, since the BMI adjusted pooled sex ratio was 1.60 (1.34; 1.90).
Hazard Ratio of Diabetes at Different Levels of Waist Circumference and BMI
BMI and WC are highly positively correlated (r= 0.85 in men and 0.87 in women in the subcohort). Therefore, too few men and women with a BMI of 18.5–22.4 kg/m2had a WC greater than or equal to 94/80 cm (n= 130) and too few men with a BMI of 22.5– 24.9 kg/m2had a WC greater than or equal to 102 cm (n= 13) to contribute to stratified analyses (Tables 4 and 5). The same was true for participants with a BMI of 30–34.9 kg/m2 and a WC lower than 94/80 cm (n= 49), or those with a BMI greater or equal to 35 kg/m2and a WC lower than 102/88 cm (n= 14).
Overall and Regional Obesity and Incident Diabetes
Table 1.Characteristics of the subcohort by BMI group in men of the InterAct study.
Characteristic Missing (Percent)
Normal, 18.5–24.9 kg/m2 (n= 2,026)
Overweight, 25.0–29.9 kg/m2
(n= 3,028) Obese,$30.0 kg/m2(n= 996) Total (n= 6,050)
Age (years) 0 52.0 9.9 53.2 8.5 53.6 7.9 52.9 8.9
Weight (kilograms) 0.2 71.3 7.2 82.0 7.7 96.0 11.0 80.7 11.7
Height (centimetres) 0.2 175.8 7.2 173.5 7.1 171.9 7.7 174.0 7.4
WC (centimetres)a 3.4 86.2 6.3 96.3 6.3 108.5 7.6 95.1 10.1
Waist-hip ratio (percent)a 3.4 90.2 5.4 94.9 5.5 99.0 5.8 94.1 6.4
Weight at age 20 y (kilograms) 22.0 67.3 7.6 70.4 8.2 75.1 10.0 69.8 8.6
Change in weight (kilograms) 22.0 4.5 6.8 13.3 7.8 24.2 10.5 11.4 10.2
Duration of follow-up (years) 0.0
Non-case 12.1 2.3 12.2 2.2 12.1 2.5 12.2 2.3
Incident diabetes case 6.8 3.3 7.3 3.1 6.8 3.3 7.1 3.2
WC groupsa 3.4
,94 cm 77.7 1,574 30.6 927 1.1 11 41.7 2,529
$94–101.9 cm 9.8 198 45.2 1,369 15.0 149 28.3 1,716
$102 cm 0.4 8 16.7 507 79.5 792 21.5 1,307
Physical activity 0.6
Inactive 16.1 327 18.3 555 22.6 225 18.4 1,115
Moderately inactive 29.8 603 31.5 954 28.7 286 30.4 1,845
Moderately active 26.1 529 24.6 746 24.7 246 25.1 1,525
Active 26.0 526 24.1 731 22.9 228 24.5 1,490
Highest school level 0.7
None 1.9 38 5.7 174 11.8 118 5.4 330
Primary 26.1 529 35.8 1,083 42.2 420 33.6 2,037
Technical 24.2 490 22.7 686 18.9 188 22.6 1,370
Secondary 15.4 312 12.2 370 9.7 97 12.9 786
Further education 30.6 619 22.1 670 15.6 155 23.8 1,445
Smoking status 0.5
Never 34.3 694 31.0 938 26.4 263 31.3 1,900
Former 32.0 649 37.8 1,146 40.0 398 36.2 2,197
Current 32.3 655 30.1 911 32.5 324 31.3 1,901
Family history of diabetesb 8.9
Yes 11.3 142 16.4 260 17.3 69 14.5 471
No 88.7 1,117 83.6 1,327 82.7 329 85.5 2,773
Data are means and SDs for continuous and percentages and frequencies for categorical variables. Twenty men in the subcohort were underweight (BMI,18.5 kg/m2) and were excluded from this table; 41 men in the subcohort
had missing values for BMI and were excluded from this table.
aData on WC and waist-hip ratio were not collected at the centre in Umea, Sweden (excluded from these summaries).
bFamily history data were not collected at the centres in Italy, Spain, Oxford, or Heidelberg, so these countries have been excluded when calculating percentages of individuals with/without a family history of diabetes.
doi:10.1371/journal.pmed.1001230.t001
Overall
and
Regiona
l
Obesity
and
Incident
Diabetes
PLoS
Medicine
|
www.plosmedici
ne.org
4
June
2012
|
Volume
9
|
Issue
6
|
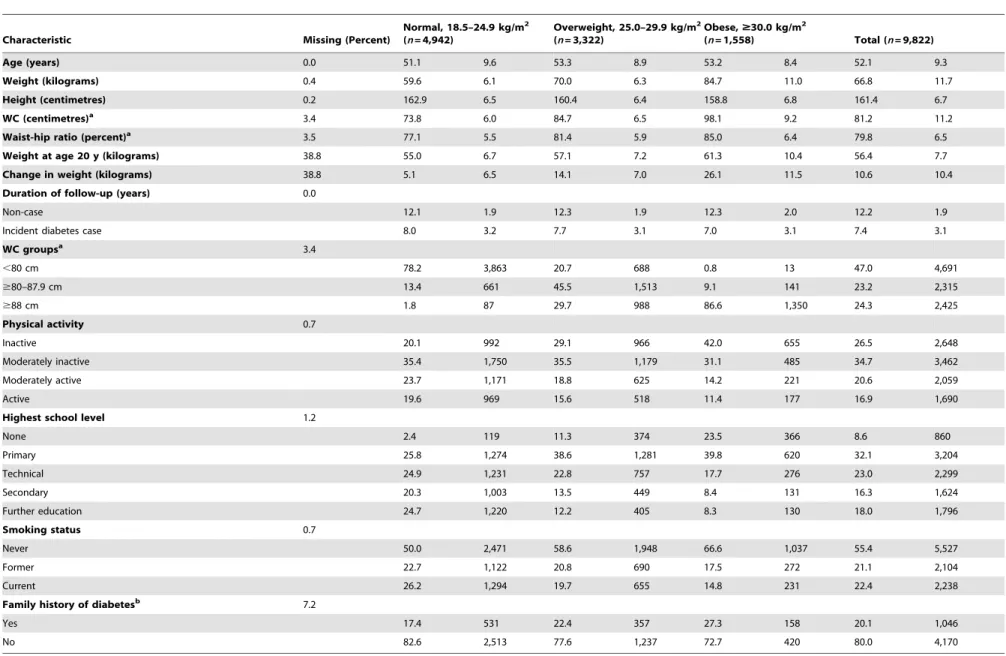
Table 2. Characteristics of the subcohort by BMI group in women of the InterAct study.
Characteristic Missing (Percent)
Normal, 18.5–24.9 kg/m2 (n= 4,942)
Overweight, 25.0–29.9 kg/m2 (n= 3,322)
Obese,$30.0 kg/m2
(n= 1,558) Total (n= 9,822)
Age (years) 0.0 51.1 9.6 53.3 8.9 53.2 8.4 52.1 9.3
Weight (kilograms) 0.4 59.6 6.1 70.0 6.3 84.7 11.0 66.8 11.7
Height (centimetres) 0.2 162.9 6.5 160.4 6.4 158.8 6.8 161.4 6.7
WC (centimetres)a 3.4 73.8 6.0 84.7 6.5 98.1 9.2 81.2 11.2
Waist-hip ratio (percent)a 3.5 77.1 5.5 81.4 5.9 85.0 6.4 79.8 6.5
Weight at age 20 y (kilograms) 38.8 55.0 6.7 57.1 7.2 61.3 10.4 56.4 7.7
Change in weight (kilograms) 38.8 5.1 6.5 14.1 7.0 26.1 11.5 10.6 10.4
Duration of follow-up (years) 0.0
Non-case 12.1 1.9 12.3 1.9 12.3 2.0 12.2 1.9
Incident diabetes case 8.0 3.2 7.7 3.1 7.0 3.1 7.4 3.1
WC groupsa 3.4
,80 cm 78.2 3,863 20.7 688 0.8 13 47.0 4,691
$80–87.9 cm 13.4 661 45.5 1,513 9.1 141 23.2 2,315
$88 cm 1.8 87 29.7 988 86.6 1,350 24.3 2,425
Physical activity 0.7
Inactive 20.1 992 29.1 966 42.0 655 26.5 2,648
Moderately inactive 35.4 1,750 35.5 1,179 31.1 485 34.7 3,462
Moderately active 23.7 1,171 18.8 625 14.2 221 20.6 2,059
Active 19.6 969 15.6 518 11.4 177 16.9 1,690
Highest school level 1.2
None 2.4 119 11.3 374 23.5 366 8.6 860
Primary 25.8 1,274 38.6 1,281 39.8 620 32.1 3,204
Technical 24.9 1,231 22.8 757 17.7 276 23.0 2,299
Secondary 20.3 1,003 13.5 449 8.4 131 16.3 1,624
Further education 24.7 1,220 12.2 405 8.3 130 18.0 1,796
Smoking status 0.7
Never 50.0 2,471 58.6 1,948 66.6 1,037 55.4 5,527
Former 22.7 1,122 20.8 690 17.5 272 21.1 2,104
Current 26.2 1,294 19.7 655 14.8 231 22.4 2,238
Family history of diabetesb 7.2
Yes 17.4 531 22.4 357 27.3 158 20.1 1,046
No 82.6 2,513 77.6 1,237 72.7 420 80.0 4,170
Data are means and SDs for continuous and percentages and frequencies for categorical variables. 152 women in the subcohort were underweight (BMI,18.5 kg/m2) and were excluded from this table; 69 women in the subcohort
had missing values for BMI and were excluded from this table.
aData on WC and waist-hip ratio were not collected at the centre in Umea, Sweden (excluded from these summaries).
bFamily history data were not collected at the centres in Italy, Spain, Oxford, or Heidelberg, so these countries have been excluded when calculating percentages of individuals with/without a family history of diabetes.
doi:10.1371/journal.pmed.1001230.t002
Overall
and
Regiona
l
Obesity
and
Incident
Diabetes
PLoS
Medicine
|
www.plosmedici
ne.org
5
June
2012
|
Volume
9
|
Issue
6
|
Figure 1. Hazard ratios for type 2 diabetes per 1 SD increase in BMI (SD = 3.6 kg/m2) in men.Heterogeneity between centres:I2= 48%
(p= 0.012). HRs estimated from modified Cox regression with age as the underlying time scale, using Prentice weights. Centre-specific estimates are combined using random effects meta-analysis.
doi:10.1371/journal.pmed.1001230.g001
Overall and Regional Obesity and Incident Diabetes
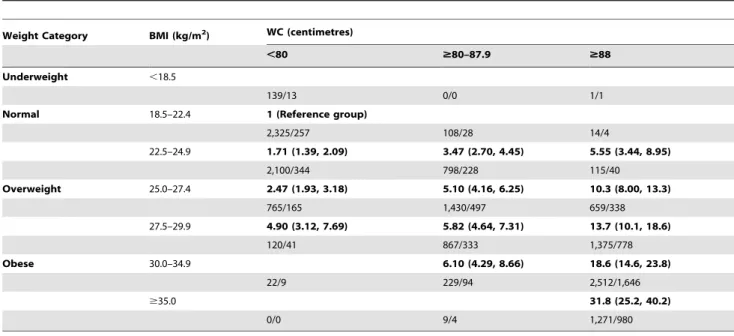
Compared to those with a BMI of 18.5–22.4 kg/m2and normal WC, the HR of diabetes was successively higher at greater levels of BMI and WC, ranging from 1.53 (1.20; 1.95) in men and 1.71 (1.39; 2.09) in women with normal weight at BMI 22.5–24.9 kg/ m2and a normal WC, to 22.0 (14.3; 33.8) in men and 31.8 (25.2; 40.2) in women with a BMI greater or equal to 35 kg/m2and a high WC. The HR of diabetes was generally higher (or similar) when comparing people in a lower BMI but higher WC group to those in the BMI group above with a smaller WC, an effect that was particularly pronounced in women. For example, in overweight women, the HR in those with a BMI of 25.0– 27.4 kg/m2and a large WC (
$88 cm) was 10.3 (8.00; 13.3), but was 5.82 (4.64; 7.31) in those with a BMI of 27.5–29.9 kg/m2and a moderately increased WC ($80–87.9 cm).
Cumulative 10-y Incidence of Developing Diabetes
Figures 5 and 6 show the cumulative incidence of T2D over 10 y of follow-up for different groups of BMI and WC, separately in men and women. Tables S1 and S2 additionally include cumulative incidences for three different follow-up times (5, 10, 15 y) together with 95% confidence intervals, numbers of events, and person-years of follow-up. The cumulative 10-y incidences estimated in normal weight participants (BMI 18.5–24.9 kg/m2) were 1.2%, 2.8%, and 2.2% in men with a normal (,94 cm), moderately increased ($94–101.9 cm), and large ($102 cm) WC; the corresponding figures for women with a normal (,80 cm), moderately increased ($80–87.9 cm), and large ($88 cm) WC were 0.59%, 1.5%, and 2.0%. In overweight individuals, WC distinguished those with incidence rates comparable to normal weight from those with rates equivalent to obese individuals. Cumulative 10–y incidences for men with normal, moderately increased, and large WC were 2.3%, 3.9%, and 7.0% in overweight men and 5.0%, 4.9%, and 10.3% in obese men. Corresponding figures were 1.1%, 2.0%, and 4.4% in overweight women and 2.8%, 2.7%, and 7.4% in obese women, respectively.
Discussion
Results based on 12,403 incident cases of T2D identified in 26 centres in eight European countries as part of the InterAct case-cohort study show independent, significant contributions of both BMI and WC to the risk of T2D. We found greater HRs for WC in women, compared to men, in analyses of standardised, continuous measures as well as using recommended clinical thresholds for abdominal obesity. In terms of absolute risk, 7% of men and 4.4% of women who were overweight and had a large WC at baseline developed diabetes over a 10-y period, placing them at an absolute risk equivalent to or higher than that of obese participants.
Clinical Implications
In addition to obese and severely obese individuals at high risk of diabetes, more than a third of the population in the US and UK is overweight [3,4]. These individuals’ risk of T2D is much less well defined, despite its potentially greater contribution to the absolute burden of diabetes and related complications. We show that assessment of WC identifies those at high risk of T2D among the large group of individuals who are overweight. Individual lifestyle interventions can reduce diabetes risk [5], but are not feasible in everyone who is overweight or obese. Current clinical practice relies on BMI to identify overweight and obese individuals at increased risk of diabetes and other adiposity-related morbidity and mortality. Although measurement of WC is often recom-mended in clinical guidelines, it is rarely actually performed. In a
survey of practice nurses in the UK, 96% reported measuring BMI in a typical week, but only 12% measured WC [20]. Recommen-dations to measure WC on everyone are unlikely to be successful since time pressures are cited as one of the explanations for the implementation gap between recommendations and actual clinical practice. Thus risk prediction models for T2D that assume universal measurement are unlikely to be helpful. As an alternative strategy, practice could focus measurement of WC on subgroups in whom the additional information is likely to make a difference to clinical decision making. Our results suggest that current clinical recommendations should consider the introduction of WC measurement amongst all overweight men and women to identify high-risk individuals for early lifestyle intervention. Normal weight men and women were at sufficiently low absolute risk that measurement of WC would not change their risk categorisation. People in the obese group should already be targeted for individualised lifestyle intervention programmes, and measure-ment of WC would not alter this recommendation. This observation, of course, does not imply that WC is an unimportant aetiological risk factor in normal weight and obese individuals, but rather that its measurement in these groups does not have an impact on clinical decision making.
Public Health Implications
The frequency of diabetes in combination with its severe long-term complications through organ damage and dysfunction, particularly of the cardiovascular system, create a major public health problem and serious burden on health care systems. Obesity is the strongest risk factor for T2D, and World Health Organization projections estimate that by 2015 approximately 2.3 billion adults will be overweight, more than 700 million will be obese, and diabetes deaths will increase by more than 50% worldwide during this time [21]. Prevention strategies for T2D require a balance of investment between population-level inter-ventions aimed at shifting the whole distribution of key risk factors and individually focused lifestyle interventions targeted at high-risk individuals. Our results clearly show the value that measurement of WC may have in identifying which people among the large population of overweight individuals are at highest risk of diabetes.
Comparison with Previous Studies
Previous literature-based reviews have investigated associations between BMI, WC, or other measures of abdominal obesity and incident diabetes [7,8,22] and reported similar associations, with risks being approximately twice as large per 1 SD difference in the different obesity measures. Results from the EPIC Potsdam cohort including 1,008 incident T2D cases suggested that the relative risk of T2D associated with WC is smaller in obese than in normal and overweight men and women [23]. We found no evidence for a significant interaction between BMI and WC in men or women in the InterAct study, which includes incident cases from the EPIC Potsdam cohort. Individual studies and meta-analyses investigat-ing the separate and joint contributions of measures of overall and central adiposity have often focused on their respective aetiological relevance [2,7,8,23]. However, it is difficult to draw inference about the specific role of central and abdominal obesity for diabetes development from epidemiological analyses mutually adjusting for BMI and WC given the strong correlation between these measures and differences in their respective measurement errors [9].
Although associations of BMI and WC with T2D incidence did not differ substantially between countries, and effect estimates of BMI and WC appeared largely consistent, we observed significant heterogeneity in our meta-analyses, with I2 values of 48% and Overall and Regional Obesity and Incident Diabetes
Figure 2. Hazard ratios for type 2 diabetes per 1 SD increase in BMI (SD = 4.4 kg/m2) in women.Heterogeneity between centres:I2= 59% (p= 0.012). HRs estimated from modified Cox regression with age as the underlying time scale, using Prentice weights. Centre-specific estimates are combined using random effects meta-analysis.
doi:10.1371/journal.pmed.1001230.g002
Overall and Regional Obesity and Incident Diabetes
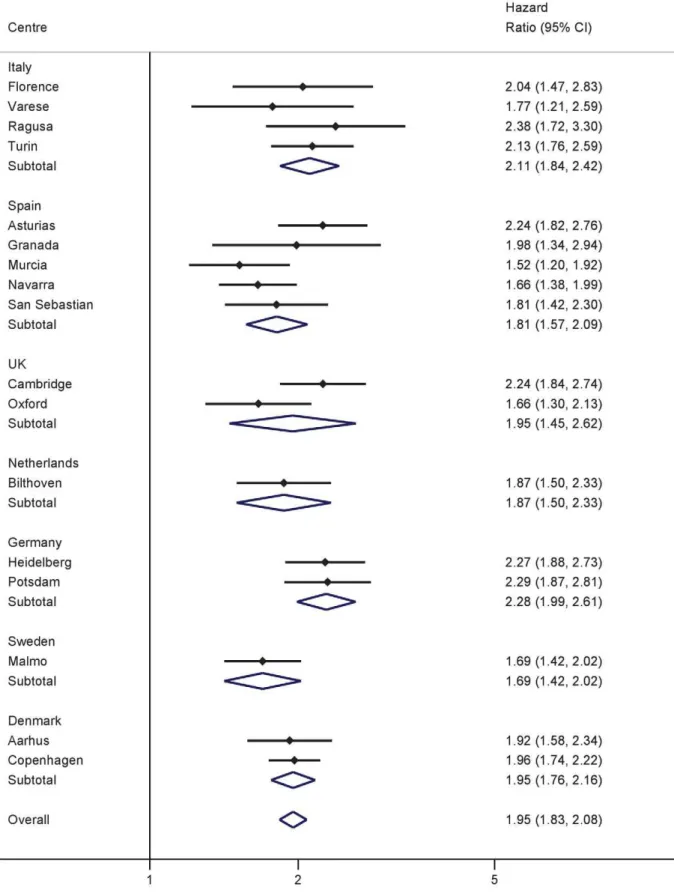
Figure 3. Hazard ratios for type 2 diabetes per 1 SD increase in WC (SD = 10.0 cm) in men.Heterogeneity between centres:I2= 31% (p= 0.11). HRs estimated from modified Cox regression with age as the underlying time scale, using Prentice weights. Centre-specific estimates are combined using random effects meta-analysis.
doi:10.1371/journal.pmed.1001230.g003
Overall and Regional Obesity and Incident Diabetes
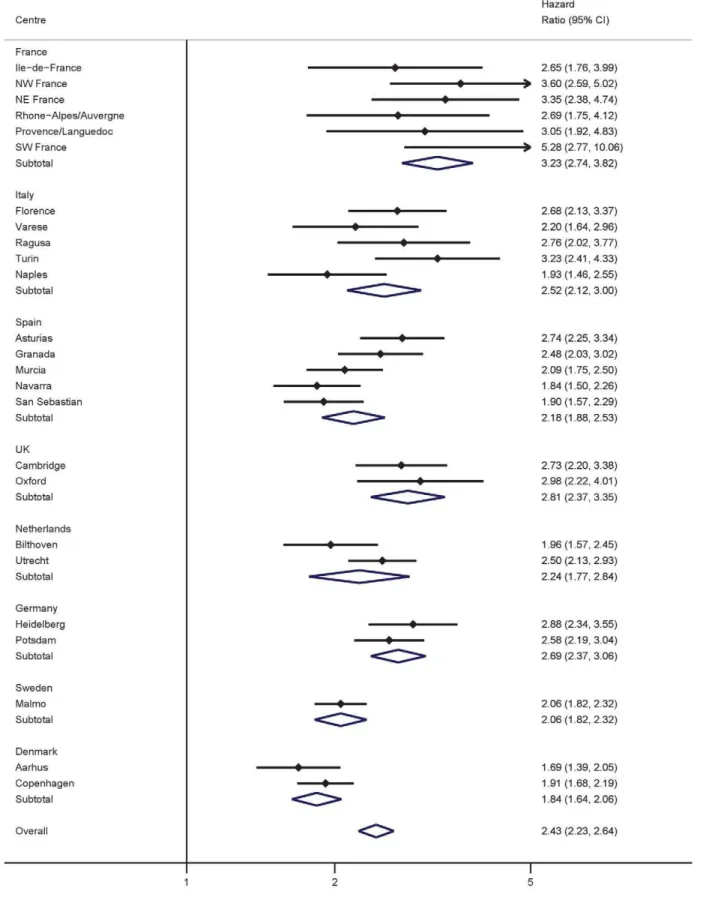
Figure 4. Hazard ratios for type 2 diabetes per 1 SD increase in WC (SD = 11.2 cm) in women.Heterogeneity between centres:I2= 69% (p,0.001). HRs estimated from modified Cox regression with age as the underlying time scale, using Prentice weights. Centre-specific estimates are combined using random effects meta-analysis.
doi:10.1371/journal.pmed.1001230.g004
Overall and Regional Obesity and Incident Diabetes
Table 3.Anthropometric measures and incident type 2 diabetes.
Measure Men Women
SD HR (95% CI) SD HR (95% CI)
BMI
18.5–24.9 kg/m2 1 1
25.0–29.9 kg/m2 2.84 (2.33, 3.45) 3.81 (3.18, 4.58)
$30.0 kg/m2 7.58 (6.00, 9.57) 11.6 (9.20, 14.5)
WC
,94/80 cm 1 1
$94–101.9/80–87.9 cm 2.40 (2.01, 2.88) 3.02 (2.61, 3.48)
$102/88 cm 5.36 (4.38, 6.54) 11.3 (9.15, 13.9)
Per 1 SD increase in BMI 3.6 4.4
Unadjusted 1.93 (1.81, 2.06) 2.07 (1.94, 2.21)
Adjusted for WC 1.49 (1.27, 1.73) 1.15 (1.02, 1.30)
Adjusted for WC, physical activity, smoking, and education 1.58 (1.36, 1.83) 1.16 (1.01, 1.34)
Per 1 SD increase in WC 10.0 11.2
Unadjusted 1.95 (1.83, 2.08) 2.43 (2.23, 2.64)
Adjusted for height 2.03 (1.88, 2.20) 2.46 (2.27, 2.68)
Adjusted for BMI 1.39 (1.19, 1.63) 2.14 (1.87, 2.45)
Adjusted for BMI, physical activity, smoking, and education 1.37 (1.19, 1.58) 2.25 (1.90, 2.66)
Per 1 SD increase in waist-hip ratio 6.3 6.5
Unadjusted 1.81 (1.61, 2.03) 2.15 (1.93, 2.40)
Adjusted for BMI 1.38 (1.25, 1.52) 1.71 (1.57, 1.86)
Adjusted for BMI, physical activity, smoking, and education 1.33 (1.21, 1.47) 1.75 (1.58, 1.93)
HRs estimated from modified Cox regression with age as the underlying time scale, using Prentice weights. Centre-specific estimates are combined using random effects meta-analysis.
doi:10.1371/journal.pmed.1001230.t003
Table 4.Combinations of BMI and waist circumference groups and type 2 diabetes in men.
Weight Category BMI (kg/m2) WC (centimetres)
,94 $94–101.9 $102
Underweight ,18.5
20/3 0/0 0/0
Normal 18.5–22.4 1 (Reference group)
625/109 8/3 0/0
22.5–24.9 1.53 (1.20, 1.95) 3.00 (1.84, 4.89)
1,412/375 308/120 13/5
Overweight 25.0–27.4 2.76 (1.74, 4.37) 4.49 (2.74, 7.36) 5.67 (2.84, 11.3)
1,203/439 1,328/634 248/137
27.5–29.9 3.77 (2.53, 5.61) 6.05 (3.87, 9.45) 8.91 (5.69, 13.9)
233/97 1,335/749 1,044/707
Obese 30.0–34.9 7.48 (4.55, 12.3) 13.3 (8.32, 21.1)
27/16 314/183 2,111/1,550
$35.0 22.0 (14.3, 33.8)
0/0 5/4 557/470
HRs estimated from modified Cox regression with age as the underlying time scale, using Prentice weights. Country-specific estimates are combined using random effects meta-analysis. Sample size and case number stated per cell.
doi:10.1371/journal.pmed.1001230.t004
Overall and Regional Obesity and Incident Diabetes
Table 5.Combinations of BMI and waist circumference groups and type 2 diabetes in women.
Weight Category BMI (kg/m2) WC (centimetres)
,80 $80–87.9 $88
Underweight ,18.5
139/13 0/0 1/1
Normal 18.5–22.4 1 (Reference group)
2,325/257 108/28 14/4
22.5–24.9 1.71 (1.39, 2.09) 3.47 (2.70, 4.45) 5.55 (3.44, 8.95)
2,100/344 798/228 115/40
Overweight 25.0–27.4 2.47 (1.93, 3.18) 5.10 (4.16, 6.25) 10.3 (8.00, 13.3)
765/165 1,430/497 659/338
27.5–29.9 4.90 (3.12, 7.69) 5.82 (4.64, 7.31) 13.7 (10.1, 18.6)
120/41 867/333 1,375/778
Obese 30.0–34.9 6.10 (4.29, 8.66) 18.6 (14.6, 23.8)
22/9 229/94 2,512/1,646
$35.0 31.8 (25.2, 40.2)
0/0 9/4 1,271/980
HRs estimated from modified Cox regression with age as the underlying time scale, using Prentice weights. Country-specific estimates are combined using random effects meta-analysis. Sample size and case number stated per cell.
doi:10.1371/journal.pmed.1001230.t005
Figure 5. Cumulative incidence of type 2 diabetes over 10 y by BMI and waist circumference groups in men.Red line, WC,94 cm; blue line, WC$94–101.9 cm; black line, WC$102 cm.
doi:10.1371/journal.pmed.1001230.g005
Overall and Regional Obesity and Incident Diabetes
31% for BMI and WC in men and 59% and 69% in women. Meta-regression analyses showed that this heterogeneity was not explained by differences in the average age of participants from the different countries. In contrast, centres with higher average WCs tended to have lower effect estimates of BMI, and inclusion of average WC in meta-regression analyses reduced theI2in men from 48% to 0% and in women from 59% to 52%. Average BMI did not explain heterogeneity in the association between WC and T2D in men and women.
Sex Differences
We observed a stronger effect estimate for excess abdominal fat in women compared to men using different analytical strategies. This was not due to sex differences in the correlation between WC and BMI, which was similar in both sexes (0.86 in men and 0.87 in women in the subcohort). Also, sex differences in the association between WC and T2D were not explained by height, which was shown to only have a very marginal influence on the association. Previous work has highlighted the value of WC as an index of abdominal fat accumulation when it is interpreted in the context of overall levels of adiposity [24,25]. In this study, sex differences in the association between WC and T2D were particularly pronounced after adjusting for BMI. This suggests that WC may be a better measure of abdominal fat and diabetes risk in women once differences in overall body size are accounted for, potentially because of a greater contribution of subcutaneous fat to women’s WC levels, compared to men.
These results demonstrate that women at greater relative risk of T2D are identified when using recommended, sex-specific WC cut-offs and suggest that cut-offs need to be reviewed if the aim is to target comparable levels of relative risk in men and women. However, if the aim is to target groups based on absolute risk, then the observation that absolute levels of T2D risk are lower in women at any level of WC compared to men is more important.
Strengths and Weaknesses
This is the largest study of incident diabetes to date to investigate the separate and joint contributions of BMI and WC. Advantages of our study include its power, prospective design, and international, multicentre population. Inclusion of over 12,000 incident cases allows investigation of T2D risk for different combinations of BMI and WC cut-offs with greater precision. The prospective design of the InterAct case-cohort study minimises systematic error introduced by recall or treatment bias that cross-sectional and case-control studies are subject to. Investigation on a Europe-wide scale increases the generalisability of our findings. However, while the possibility of examining anthropometric effects across the eight European countries can help to understand factors contributing to any potential heterogeneity, results from our European descent InterAct participants do not allow inferences about BMI- and WC-associated relative or absolute risks of T2D in other ethnic groups with potentially different body composition and T2D incidence. Methods for case ascertainment and verification in
Figure 6. Cumulative incidence of type 2 diabetes over 10 y by BMI and waist circumference groups in women.Red line, WC,80 cm; blue line, WC$80–87.9 cm; black line, WC$88 cm.
doi:10.1371/journal.pmed.1001230.g006
Overall and Regional Obesity and Incident Diabetes
InterAct are largely based on a clinical diagnosis of T2D. Estimates of the cumulative incidence in InterAct are therefore an underestimation, potentially differential with regard to obesity levels, as rates are expected to be higher if undiagnosed, asymptomatic diabetes cases were also considered. While our large-scale study had standardised measures of anthropometry available for all except 363 Oxford participants, some differences existed between centres in terms of the WC measurement site or the clothes worn during measurement. Assuming that any misclassification was non-differential with regard to case status, this may have led to an attenuation of the observed associations for WC, highlighting the importance of appropriately designed and powered studies with standardised measures of WC to address its relative importance for the risk of diabetes and other outcomes.
Conclusion
WC is independently and strongly associated with T2D, particularly in women, and should be more widely measured. If targeted measurement is necessary for reasons of resource scarcity, measuring WC in overweight individuals may be an effective strategy since it identifies a high-risk subgroup of individuals who could benefit from individualised preventive action.
Supporting Information
Figure S1 Ratio (women/men) of hazard ratios for the
effect of an increased waist circumference ($102 cm in men and$88 cm in women) on incident type 2 diabetes.
(TIF)
Table S1 Cumulative incidence of type 2 diabetes by
BMI and waist circumference in men.
(DOC)
Table S2 Cumulative incidence of type 2 diabetes by
BMI and waist circumference in women.
(DOC)
Acknowledgments
We thank all EPIC participants and staff for their contribution to the study. Authors
Claudia Langenberg MD, PhD (1), Stephen J. Sharp MSc (1), Matthias B. Schulze PhD (2), Olov Rolandsson MD, PhD (3), Kim Overvad PhD (4), Nita G. Forouhi MD, PhD (1), Joachim Spranger MD, PhD (5), Dagmar Drogan PhD (6), Jose´ Marı´a Huerta PhD (7,8), Larraitz Arriola MD, MSc (8,9,10), Blandine de Lauzon-Guillan PhD (11,12), Maria-Jose Tormo MD (7,8), Eva Ardanaz PhD (8,13), Beverley Balkau PhD (11,12), Joline W. J. Beulens PhD (14), Heiner Boeing PhD (6), H. Bas Bueno-de-Mesquita PhD (15,36), Franc¸oise Clavel-Chapelon PhD (16), Francesca L. Crowe PhD (17), Paul W. Franks PhD (3,35), Carlos A. Gonzalez MD, PhD (18), Sara Grioni BSc (19), Jytte Halkjaer PhD (20), Goran Hallmans MD, PhD (3), Rudolf Kaaks PhD (21), Nicola D. Kerrison MSci (1), Timothy J. Key DPhil (17), Kay Tee Khaw MD (22), Amalia Mattiello MD (23), Peter Nilsson MD, PhD (24), Teresa Norat PhD (25), Luigi Palla PhD (1), Domenico Palli MD, MPH (26), Salvatore Panico MD (24), J. Ramo´n Quiro´s MD (27), Dora Romaguera PhD (25), Isabelle Romieu MD, MPH, ScD (28), Carlotta Sacerdote MD, PhD (29,30), Marı´a-Jose´ Sa´nchez MD, PhD (8,31), Nadia Slimani PhD (28), Ivonne Sluijs PhD (14), Annemieke M. W. Spijkerman PhD (32), Birgit Teucher PhD (21), Anne Tjonneland Dr Med Sci (20), Rosario Tumino MD, MSc (33), Daphne L. van der A PhD (32), Yvonne T. van der Schouw PhD (14), Edith J. M. Feskens PhD (34), Elio Riboli MD, MPH, ScM (25), and Nicholas J. Wareham MD, PhD (1) on behalf of the InterAct Consortium.
Affiliations
(1) MRC Epidemiology Unit, Institute of Metabolic Science, Adden-brooke’s Hospital, Box 285, Cambridge CB2 0QQ, United Kingdom, (2) Department of Molecular Epidemiology, German Institute of Human
Nutrition Potsdam Rehbruecke, Arthur-Scheunert-Allee 114–116, 14558 Nuthetal, Germany, (3) Department of Public Health and Clinical Medicine, Umea˚ University, Norrlands Universitetsjukhus, 90185 Umea˚, Sweden, (4) Department of Epidemiology, School of Public Health, Bartholins Alle´ 2, DK-8000 Aarhus C, Denmark, (5) Charite´-Universi-ta¨tsmedizin Berlin, Department of Endocrinology, Diabetes and Nutrition, Chariteplatz 1, 10117 Berlin, Germany, (6) Department of Epidemiology, German Institute of Human Nutrition Potsdam-Rehbruecke, Arthur-Scheunert-Allee 114–116, 14558 Nuthetal, Germany, (7) Department of Epidemiology, Murcia Regional Health Council, Ronda de Levante 11, 30008 Murcia, Spain, (8) Consortium for Biomedical Research in Epidemiology and Public Health (CIBER Epidemiologı´a y Salud Pu´blica), Melchor Ferna´ndez Almagro 3–5, 28029 Madrid, Spain, (9) Public Health Division of Gipuzkoa, Basque Government, Av. Navarra 4, 20013 San Sebastian, Spain, (10) Instituto BIO-Donostia, Hospital Donostia, 20014 Donostia, Basque Country, (11) INSERM, CESP Centre for Research in Epidemiology and Population Health, U1018: Epidemiology of Diabetes, Obesity and Chronic Kidney Disease over the Lifecourse, 16 Av Paul Vaillant Couturier, 94807 Villejuif Cedex, France, (12) University Paris Sud 11, UMRS 1018, 94807 Villejuif Cedex, France, (13) Navarre Public Health Institute, Leyre 15, 31003 Pamplona, Navarra, Spain, (14) Julius Center for Health Sciences and Primary Care, University Medical Center Utrecht, Stratenum 6.131, PO Box 85.500, 3508 GA Utrecht, The Netherlands, (15) National Institute for Public Health and the Environment (RIVM), PO Box 1, 3720 BA Bilthoven, The Netherlands, (16) INSERM, CESP Centre for Research in Epidemiology and Population Health, U1018: Nutrition, Hormones and Women’s Health, IGR, 39 rue Camilles Desmouolins, 94800 Villejuif Cedex, France, (17) Cancer Epidemiology Unit, Nuffield Department of Clinical Medicine, University of Oxford, Richard Doll Building, Roosevelt Drive, Oxford OX3 7LF, United Kingdom, (18) Unit Nutrition, Environment and Cancer, Department of Epidemiology, Catalan Institute of Oncology, Gran Via s/n km 2,7, L’Hospitalet de Llobregat, 08907 Barcelona, Spain, (19) Fondazione IRCCS Istituto Nazionale Tumori Milan, Via Venezian 1, 20133 Milan, Italy, (20) Danish Cancer Society Research Center, Strandboulevarden 49, 2100 Copenhagen, Denmark, (21) German Cancer Research Centre, Im Neuenheimer Feld 280, 69120 Heidelberg, Germany, (22) Department of Public Health and Primary Care, University of Cambridge Addenbrooke’s Hospital, Box 251, Cambridge CB2 2QQ, United Kingdom, (23) Department of Clinical and Experimental Medicine Federico II University, via Pansini, 5-80131 Naples, Italy, (24) University of Lund, Department of Clinical Sciences Medicine, University Hospital Scania, 205 02 Malmo, Sweden, (25) Department of Epidemiology & Biostatistics, School of Public Health, Imperial College London, St Mary’s Campus, Norfolk Place, London W2 1PG, United Kingdom, (26) Molecular and Nutritional Epidemiology Unit, ISPO Ponte Nuovo, Via delle Oblate 4, 50141 Florence, Italy, (27) Public Health Directorate, 9 Ciriaco Miguel Vigil St, 33006 Oviedo, Spain (28) International Agency for Research on Cancer, 150 Cours Albert Thomas, 69372 Lyon Cedex 08, France, (29) Center for Cancer Prevention (CPO-Piemonte), Via Santena 7, 10126 Torino, Italy, (30) Human Genetics Foundation (HuGeF), Via Nizza 52, 10126 Torino, Italy, (31) Andalusian School of Public Health, Cuesta del Observatorio 4, Ap. Correos 2070, 18080 Granada, Spain, (32) National Institute for Public Health and the Environment (RIVM), PO Box 1, 3720 BA Bilthoven, The Netherlands, (33) Cancer Registry and Histopathology Unit, ‘‘Civile - M.P. Arezzo’’ Hospital, ASP 7 Via Dante Nr. 109, 97100 Ragusa, Italy, (34) Division of Human Nutrition - Section Nutrition and Epidemiology, University of Wageningen, PO Box 8129, 6700 EV Wageningen, The Netherlands, (35) Department of Clinical Sciences, Clinical Research Center, Ska˚ne University Hospital, Lund University, 20502 Malmo¨, Sweden, (36) Department of Gastroenterology and Hepatology, University Medical Centre, Utrecht, The Netherlands.
Author Contributions
Conceived and designed the experiments: CL NJW. Performed the experiments: CL SS NJW. Analyzed the data: SJS. Contributed reagents/ materials/analysis tools: CL SJS MBS OR KO NGF JS DD JMH LA BdL-G M-JJT EA BB JWJB HB HBB-d-M FC-C FLC PWF CG SG JH GH RH NDK TJK KTK AM PN TN LP DP SP JRQ DR IR CS M-JJS NS IS AMWS BT AT TR DlvdA YTvdS EJMF ER NJW. Wrote the first draft of the manuscript: CL SJS. Contributed to the writing of the manuscript: CL SJS MBS OR KO NGF JS DD JMH LA BdL-G M-JJT
Overall and Regional Obesity and Incident Diabetes
EA BB JWJB HB HBB-d-M FC-C FLC PWF CG SG JH GH RH NDK TJK KTK AM PN TN LP DP SP JRQ DR IR CS M-JJS NS IS AMWS BT AT TR DlvdA YTvdS EJMF ER NJW. ICMJE criteria for authorship read and met: CL SJS MBS OR KO NGF JS DD JMH LA BdL-G M-JJT EA BB JWJB HB HBB-d-M FC-C FLC PWF CG SG JH GH RH NDK TJK KTK AM PN TN LP DP SP JRQ DR IR CS M-JJS NS IS AMWS
BT AT TR DlvdA YTvdS EJMF ER NJW. Agree with manuscript results and conclusions: CL SJS MBS OR KO NGF JS DD JMH LA BdL-G M-JJT EA BB JWJB HB HBB-d-M FC-C FLC PWF CG SG JH GH RH NDK TJK KTK AM PN TN LP DP SP JRQ DR IR CS M-JJS NS IS AMWS BT AT TR DlvdA YTvdS EJMF ER NJW.
References
1. Barrett-Connor E (1989) Epidemiology, obesity, and non-insulin-dependent diabetes mellitus. Epidemiol Rev 11: 172–181.
2. Wang Y, Rimm EB, Stampfer MJ, Willett WC, Hu FB (2005) Comparison of abdominal adiposity and overall obesity in predicting risk of type 2 diabetes among men. Am J Clin Nutr 81: 555–563.
3. Flegal KM, Carroll MD, Ogden CL, Curtin LR (2010) Prevalence and trends in obesity among US adults, 1999–2008. JAMA 303: 235–241.
4. Zaninotto P, Head J, Stamatakis E, Wardle H, Mindell J (2009) Trends in obesity among adults in England from 1993 to 2004 by age and social class and projections of prevalence to 2012. J Epidemiol Community Health 63: 140–146. 5. Knowler WC, Barrett-Connor E, Fowler SE, Hamman RF, Lachin JM, et al. (2002) Reduction in the incidence of type 2 diabetes with lifestyle intervention or metformin. N Engl J Med 346: 393–403.
6. Knowler WC, Fowler SE, Hamman RF, Christophi CA, Hoffman HJ, et al. (2009) 10-year follow-up of diabetes incidence and weight loss in the Diabetes Prevention Program Outcomes Study. Lancet 374: 1677–1686.
7. Vazquez G, Duval S, Jacobs DR , Jr., Silventoinen K (2007) Comparison of body mass index, waist circumference, and waist/hip ratio in predicting incident diabetes: a meta-analysis. Epidemiol Rev 29: 115–128.
8. Freemantle N, Holmes J, Hockey A, Kumar S (2008) How strong is the association between abdominal obesity and the incidence of type 2 diabetes? Int J Clin Pract 62: 1391–1396.
9. Klein S, Allison DB, Heymsfield SB, Kelley DE, Leibel RL, et al. (2007) Waist circumference and cardiometabolic risk: a consensus statement from shaping America’s health: Association for Weight Management and Obesity Prevention; NAASO, the Obesity Society; the American Society for Nutrition; and the American Diabetes Association. Diabetes Care 30: 1647–1652.
10. Dunkley AJ, Stone MA, Patel N, Davies MJ, Khunti K (2009) Waist circumference measurement: knowledge, attitudes and barriers in patients and practitioners in a multi-ethnic population. Fam Pract 26: 365–371.
11. Langenberg C, Sharp S, Forouhi NG, Franks PW, Schulze MB, et al. (2011) Design and cohort description of the InterAct Project: an examination of the interaction of genetic and lifestyle factors on the incidence of type 2 diabetes in the EPIC Study. Diabetologia 54: 2272–2282.
12. Haftenberger M, Lahmann PH, Panico S, Gonzalez CA, Seidell JC, et al. (2002) Overweight, obesity and fat distribution in 50- to 64-year-old participants in the European Prospective Investigation into Cancer and Nutrition (EPIC). Public Health Nutr 5: 1147–1162.
13. Pischon T, Boeing H, Hoffmann K, Bergmann M, Schulze MB, et al. (2008) General and abdominal adiposity and risk of death in Europe. N Engl J Med 359: 2105–2120.
14. Spencer EA, Roddam AW, Key TJ (2004) Accuracy of self-reported waist and hip measurements in 4492 EPIC-Oxford participants. Public Health Nutr 7: 723–727.
15. Riboli E, Hunt KJ, Slimani N, Ferrari P, Norat T, et al. (2002) European Prospective Investigation into Cancer and Nutrition (EPIC): study populations and data collection. Public Health Nutr 5: 1113–1124.
16. Day N, Oakes S, Luben R, Khaw KT, Bingham S, et al. (1999) EPIC-Norfolk: study design and characteristics of the cohort. European Prospective Investigation of Cancer. Br J Cancer 80: 95–103.
17. Wareham NJ, Jakes RW, Rennie KL, Schuit J, Mitchell J, et al. (2003) Validity and repeatability of a simple index derived from the short physical activity questionnaire used in the European Prospective Investigation into Cancer and Nutrition (EPIC) study. Public Health Nutr 6: 407–413.
18. World Health Organization (2000) Obesity: preventing and managing the global epidemic. Report of a WHO consultation. World Health Organ Tech Rep Ser 894: 1–253.
19. National Cholesterol Education Program (NCEP) Expert Panel on Detection, Evaluation, and Treatment of High Blood Cholesterol in Adults (Adult Treatment Panel III) (2002) Third report of the National Cholesterol Education Program (NCEP) Expert Panel on Detection, Evaluation, and Treatment of High Blood Cholesterol in Adults (Adult Treatment Panel III) final report. Circulation 2002 106: 3143–3421.
20. Brown I, Stride C, Psarou A, Brewins L, Thompson J (2007) Management of obesity in primary care: nurses’ practices, beliefs and attitudes. J Adv Nurs 59: 329–341.
21. World Health Organization (2006) Obesity and overweight. Fact sheet number 311. Geneva: World Health Organization.
22. Abdullah A, Peeters A, de Court, Stoelwinder J (2010) The magnitude of association between overweight and obesity and the risk of diabetes: a meta-analysis of prospective cohort studies. Diabetes Res Clin Pract 89: 309–319. 23. Feller S, Boeing H, Pischon T (2010) Body mass index, waist circumference, and
the risk of type 2 diabetes mellitus: implications for routine clinical practice. Dtsch Arztebl Int 107: 470–476.
24. Despres JP (2011) Excess visceral adipose tissue/ectopic fat the missing link in the obesity paradox? J Am Coll Cardiol 57: 1887–1889.
25. Balkau B, Deanfield JE, Despres JP, Bassand JP, Fox KA, et al. (2007) International Day for the Evaluation of Abdominal Obesity (IDEA): a study of waist circumference, cardiovascular disease, and diabetes mellitus in 168,000 primary care patients in 63 countries. Circulation 2007 116: 1942–1951.
Overall and Regional Obesity and Incident Diabetes
Editors’ Summary
Background. Worldwide, more than 350 million people
have diabetes, and this number is increasing rapidly. Diabetes is characterized by dangerous levels of glucose (sugar) in the blood. Blood sugar levels are usually controlled by insulin, a hormone that the pancreas releases after meals (digestion of food produces glucose). In people with type 2 diabetes (the commonest form of diabetes), blood sugar control fails because the fat and muscle cells that normally respond to insulin by removing sugar from the blood become insulin resistant. Type 2 diabetes can be controlled with diet and exercise, and with drugs that help the pancreas make more insulin or that make cells more sensitive to insulin. The long-term complications of diabetes, which include an increased risk of heart disease and stroke, reduce the life expectancy of people with diabetes by about 10 years compared to people without diabetes.
Why Was This Study Done?A high body mass index (BMI,
a measure of body fat calculated by dividing a person’s weight in kilograms by their height in meters squared) is a strong predictor of type 2 diabetes. Although the risk of diabetes is greatest in obese people (who have a BMI of greater than 30 kg/m2), many of the people who develop diabetes are overweight—they have a BMI of 25–30 kg/m2. Healthy eating and exercise reduce the incidence of diabetes in high-risk individuals, but it is difficult and expensive to provide all overweight and obese people with individual lifestyle advice. Ideally, a way is needed to distinguish between people with high and low risk of developing diabetes at different levels of BMI. Waist circumference is a measure of fat distribution that has the potential to quantify diabetes risk among people with different BMIs because it estimates the amount of fat around the abdominal organs, which also predicts diabetes development. In this case-cohort study, the researchers use data from the InterAct study (which is investigating how genetics and lifestyle interact to affect diabetes risk) to estimate the long-term risk of type 2 diabetes associated with BMI and waist circumfer-ence. A case-cohort study measures exposure to potential risk factors in a group (cohort) of people and compares the occurrence of these risk factors in people who later develop the disease and in a randomly chosen subcohort.
What Did the Researchers Do and Find?The researchers
estimated the association of BMI and waist circumference with type 2 diabetes from baseline measurements of the weight, height, and waist circumference of 12,403 people who subsequently developed type 2 diabetes and a subcohort of 16,154 participants enrolled in the European Prospective Investigation into Cancer and Nutrition (EPIC). Both risk factors were independently associated with type 2 diabetes risk, but waist circumference was a stronger risk factor in women than in men. Obese men (BMI greater than 35 kg/m2) with a high waist circumference (greater than
102 cm) were 22 times more likely to develop diabetes than men with a low normal weight (BMI 18.5–22.4 kg/m2) and a low waist circumference (less than 94 cm); obese women with a waist circumference of more than 88 cm were 31.8 times more likely to develop type 2 diabetes than women with a low normal weight and waist circumference (less than 80 cm). Importantly, among overweight people, waist circumference measurements identified a subgroup of overweight people (those with a high waist circumference) whose 10-year cumulative incidence of type 2 diabetes was similar to that of obese people.
What Do These Findings Mean?These findings indicate
that, among people of European descent, waist circumfer-ence is independently and strongly associated with type 2 diabetes, particularly among women. Additional studies are needed to confirm this association in other ethnic groups. Targeted measurement of waist circumference in overweight individuals (who now account for a third of the US and UK adult population) could be an effective strategy for the prevention of diabetes because it would allow the identifi-cation of a high-risk subgroup of people who might benefit from individualized lifestyle advice.
Additional Information.Please access these web sites via the online version of this summary at http://dx.doi.org/10. 1371/journal.pmed.1001230.
N
The US National Diabetes Information Clearinghouseprovides information about diabetes for patients, health care professionals, and the general public, including detailed information on diabetes prevention (in English and Spanish)N
The US Centers for Disease Control and Preventionprovides information on all aspects of overweight and obesity (including some information in Spanish)N
The UK National Health Service Choices website providesinformation for patients and carers about type 2 diabetes, about the prevention of type 2 diabetes, and about obesity; it also includes people’s stories about diabetes and about obesityN
The charity Diabetes UK also provides detailed informationfor patients and carers, including information on healthy lifestyles for people with diabetes, and has a further selection of stories from people with diabetes; the charity Healthtalkonline has interviews with people about their experiences of diabetesN
More information on the InterAct study is availableN
MedlinePlus provides links to further resources and adviceabout diabetes and diabetes prevention and about obesity(in English and Spanish)
Overall and Regional Obesity and Incident Diabetes