EURASIAN JOURNAL OF ECONOMICS AND FINANCE
http://www.eurasianpublications.com
†The views expressed by the author do not represent those of his institutional affiliations. The author is
thankful to Mr. Gopal Prasad (Assistant Adviser, Reserve Bank of India) for his valuable inputs in the research.
D
ETERMINANTS OF
N
ON
-P
ERFORMING
A
SSETS IN
I
NDIA
-
P
ANEL
R
EGRESSION
†Saikat Ghosh Roy
Axis Bank Limited, India. Email: [email protected]
Abstract
It is well known that level of banks‟ credit plays an important role in economic developments.
Indian banking sector has played a seminal role in supporting economic growth in India. Recently, Indian banks are experiencing consistent increase in non-performing assets (NPA). In this perspective, this paper investigates the trends in NPA in Indian banks and its determinants. The panel regressions, fixed effect allows evaluating the impact of selected macroeconomic variables on the NPA. The Panel regression result indicates that the GDP growth, change in exchange rate and global volatility have major effects on the NPA level of Indian banking sector.
Keywords: Non-performing loans, Macro-financial linkages, Bank Credit, Panel Regression Model
JEL Classification: E44, E51, G21, C23
1. Introduction and Literature Review
1.1. Non-performing Asset Scenario in Different Countries
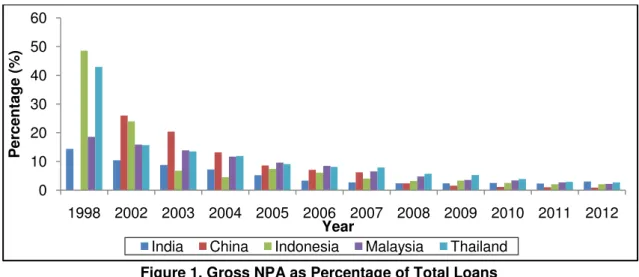
If we look at from Asian perspective, Non-performing assets have become a matter of concern since the Asian crisis in 1997-98 which hit hard the „Asian Tigers‟ like Thailand, Indonesia, Malaysia and also China. India was not hit such badly by the crisis. Before the crisis commercial banks in those countries were very poorly capitalized and running high level of Non-performing assets. The main indicator, Gross NPA as percentage of total loans reached 48.6 per cent in Indonesia, 42.9 per cent in Thailand, 18.6 per cent in Malaysia during 1998. It reached to a maximum of 29.8 per cent in China in 2001. Indian banking sector performed much better during this time with Gross NPA to total loan ratio of only 14.4 per cent in 1998 (Figure 1).
70
over the past decade. Substantial consolidation took place between 1999 and 2004, which has also increased competition and efficiency of the Asian banking system. Many countries closed their weaker banks or merged their banking institutions (varying between 10 to 30 percent of total banks in India, Indonesia, Korea and Malaysia) or privatised them (Mohanty and Turner, 2010).
Figure 1. Gross NPA as Percentage of Total Loans Source: World Bank <http://data.worldbank.org/indicator/FB.AST.NPER.ZS>
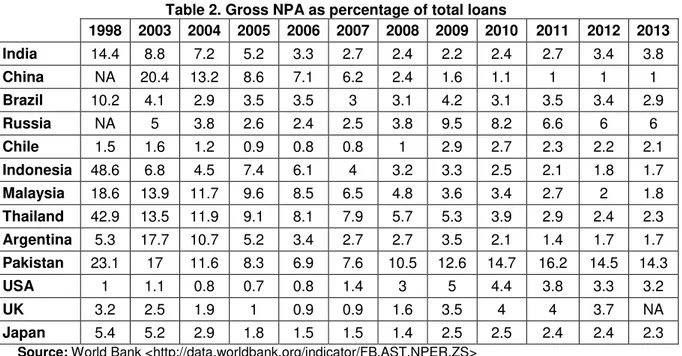
The credit deployment by the banking system in the economy has a direct impact on the non-performing loan level of the country. Credit is required for faster growth of the economy but any kind of macroeconomic shock can impact those outstanding advances badly and may turn them non-performing. Table 1 shows the pattern of credit deployment by several countries covering developed, emerging and frontier market. Among the emerging economies China, Malaysia and Thailand have very high level of credit deployment to propel the growth. In India and Brazil the amount increased gradually over the years and crossed 100% in Brazil in 2012. Russia is the most conservative among the BRIC countries having the lowest level of credit deployment. For frontier market, countries like Argentina and Pakistan have low level of credit deployment. The developed countries like USA, UK, and Japan thrive on high level of credit. The debt levels of those countries are approaching to alarming level.
Table 1. Domestic credit provided by banking sector (% of GDP)
2002 2003 2004 2005 2006 2007 2008 2009 2010 2011 2012
India 57.1 55.8 57.6 58.4 60.9 60.8 67.7 70.1 71.8 74.1 75.9
China 143.5 151.9 140.4 134.3 133.5 127.8 120.8 145.1 146.3 145.5 155.1
Brazil 74.5 74 72.6 74.5 86.6 92.2 96.9 95.8 95.2 98.3 110.5
Russia 26.9 27.9 25.7 22.1 22.5 24.4 23.9 33.7 38.4 39.5 41.5
Chile 84.7 83.5 82.6 79.5 78.9 85.4 92.8 69.6 66 71.2 108
Indonesia 52.4 49.2 49.7 46.1 41.6 40.5 36.8 36.9 36.5 38.5 42.6
Malaysia 143.6 139.8 127.5 117.7 114.6 109.4 110.8 131.1 127.4 128.7 134
Thailand 127.8 130.7 124.5 119.2 109 131.6 130.5 137 142.8 159.2 169.6
Argentina 62.4 50.6 45.4 38.3 30.8 28.5 24.4 28 29.2 31.3 37.3
Pakistan 37.2 37.9 43 46.5 45.5 48.4 53.2 48.4 46.4 43.3 45.8
USA 198.8 214.4 221.5 225.4 235.5 244.4 224.4 232.4 231.1 232.5 229.9 UK 141.7 145.3 153.6 160.8 171 186.7 212.4 227.9 222.2 212.6 206.7
Japan 302.5 312.7 307.7 317.5 309.9 300.2 303.3 329 328 341.7 346.1
Source: World Bank <http://data.worldbank.org/indicator/FS.AST.DOMS.GD.ZS>
0 10 20 30 40 50 60
1998 2002 2003 2004 2005 2006 2007 2008 2009 2010 2011 2012
P
er
ce
n
tage
(%
)
Year
71
Karim et al. (2010) investigate the relationship between non-performing loans and bank efficiency in Malaysia and Singapore through the Tobit simultaneous equation regression model. The result shows that higher non-performing loan reduces cost efficiency and also lower cost efficiency increases non-performing loans. This also supports the hypothesis proposed by Berger and DeYoung (1997) that bad management in banks elevates the level of non-performing loans. Among the macroeconomic factors interest rate has a positive significant relationship with the non-performing loans and producer price index has a negative and significant relationship with the non-performing loans in the Islamic banking sector of Malaysia (Adebola et al. 2011). After the Asian financial crisis the non-performing loan ratios in Malaysia and Singapore improved gradually which can be attributed to the factors like transferring of NPLs from banks to Asset Management Companies (AMC), more effort to recover NPAs, higher loan write-offs to make the balance sheet healthier (Karim et al. 2010).
Table 2. Gross NPA as percentage of total loans
1998 2003 2004 2005 2006 2007 2008 2009 2010 2011 2012 2013
India 14.4 8.8 7.2 5.2 3.3 2.7 2.4 2.2 2.4 2.7 3.4 3.8
China NA 20.4 13.2 8.6 7.1 6.2 2.4 1.6 1.1 1 1 1
Brazil 10.2 4.1 2.9 3.5 3.5 3 3.1 4.2 3.1 3.5 3.4 2.9
Russia NA 5 3.8 2.6 2.4 2.5 3.8 9.5 8.2 6.6 6 6
Chile 1.5 1.6 1.2 0.9 0.8 0.8 1 2.9 2.7 2.3 2.2 2.1
Indonesia 48.6 6.8 4.5 7.4 6.1 4 3.2 3.3 2.5 2.1 1.8 1.7
Malaysia 18.6 13.9 11.7 9.6 8.5 6.5 4.8 3.6 3.4 2.7 2 1.8
Thailand 42.9 13.5 11.9 9.1 8.1 7.9 5.7 5.3 3.9 2.9 2.4 2.3
Argentina 5.3 17.7 10.7 5.2 3.4 2.7 2.7 3.5 2.1 1.4 1.7 1.7
Pakistan 23.1 17 11.6 8.3 6.9 7.6 10.5 12.6 14.7 16.2 14.5 14.3
USA 1 1.1 0.8 0.7 0.8 1.4 3 5 4.4 3.8 3.3 3.2
UK 3.2 2.5 1.9 1 0.9 0.9 1.6 3.5 4 4 3.7 NA
Japan 5.4 5.2 2.9 1.8 1.5 1.5 1.4 2.5 2.5 2.4 2.4 2.3
Source: World Bank <http://data.worldbank.org/indicator/FB.AST.NPER.ZS>
Among the Asian countries the non-performing loan scenario of China is most talked about. The Chinese non-performing loan is result of nexus between its State Owned Enterprises (SOEs), State Owned Commercial Banks (SOCBs) and the direct intervention of the Government and political classes. SOCBs were forced by the Govt. to make loans to the SOEs with high default risk and those loans eventually became non-performing. This problem of
72
Investigating the economic determinants of NPLs in Pakistan Farhan et al. (2012) found that Interest Rate, Energy Crisis, Unemployment, Inflation, and Exchange Rate has a significant positive relationship while GDP growth has significant negative relationship with the non-performing loans of Pakistani banking sector according to the perception of Pakistani bankers. Non-performing loans are also affected by volatility on interest rates (Siddiqui et al. 2012). The energy crisis is a macro factor unique to Pakistan, which is still suffering from a tremendous energy crisis in the country. Since 2006 the cause of most of the bad loans is attributed to this severe energy crisis in the country (Farhan et al. 2012).
For the Brazilian banking system, Chu (2001) found that from 1994 to 2000 the
macroeconomic factors to which the Brazilian banks‟ defaults are most sensitive are - GDP, the
Spread, Interest Rate and Unemployment. Park (2011) performed another study to find the effects of economic growth and interest rates on the performance of Brazilian commercial bank loan portfolios for the next decade i.e. for the time period of 2000 to 2010. The empirical results showed that the economic growth (GDP) is the main driver of the performance of the credit portfolio of Brazilian commercial banks, and that the variation in the interest rate has no significant effects on it. There was a two quarter lagged effect of the economic i.e. GDP growth on the performance of the credit portfolio of the Brazilian banks (Park, 2011).
Fofack‟s (β005) study consisted of finding both the macroeconomic and microeconomic
i.e. bank specific determinants of NPA in Sub-Saharan Africa using panel data, where the data was taken for 16 African countries. The results showed that GDP per capita and real effective exchange rates were the most important macroeconomic factors in determining the NPL, where GDP per capita had the negative relationship and REER depreciation had positive association with the NPA. That means falling per capita income increased the level of NPA. Apart from those, real interest rate and money supply measured by broad money also had impact on the level of NPAs. For the bank level variables return on asset, total deposit and net interest margin were the significant factors and all had negative association with NPA. Interestingly inflation
didn‟t appear to be a significant factor (Fofack, β005).
Now if we look at the much developed European countries, the determinants of NPA are more or less similar. Klein (2013) investigated the NPA scenario in Central, Eastern and South- Eastern Europe in the period of 1998–2011. The study found that the bank specific factors had low explanatory power than the macroeconomic factors. The results suggested that macroeconomic determinants like higher unemployment rate, exchange rate depreciation and higher inflation contributed to higher NPAs while higher Euro area‟s GDP growth resulted in lower NPAs. Bank specific factors equity-to-asset ratio and return on equity (ROE) are negatively correlated with NPAs while excessive lending leads to higher NPAs. This study also observed a strong macro-financial linkage and feedback effect from banking sector to real economy by panel vector auto-regression (VAR) analysis.
1.2. Non-performing Asset Scenario in India
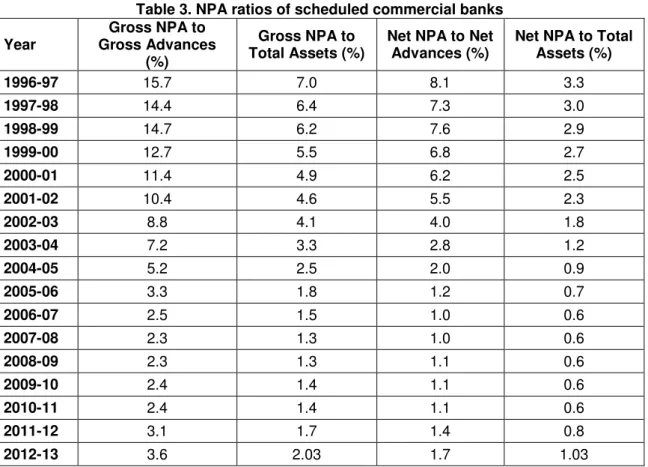
During the 1997-98 Asian financial crises Indian banks were in much better position than its Asian peers in the matter of Non-performing assets. The globalization effect was less in India and Indian economy was more decoupled than countries like Thailand, Malaysia, and Indonesia which were directly controlled by the capital flows from the west. So, Indian banks were less vulnerable to global shocks. The Gross NPA as percentage of total loans was at 14.4 per cent, much lower than the Asian peers. The NPA levels then improved over the next decade and marginally deteriorated during the next global crisis of 2008. However, in 2011-12 the NPA ratios deteriorated further. This may be the impact of excess lending during the crisis period to keep the economy moving and the growth intact. Table 3 depicts the NPA ratios of scheduled commercial banks from year 1996-97 to 2011-12.
73
similar but that of public sector banks were much higher. The highest NPA ratio was for the
State Bank of India Group which includes country‟s largest lender State Bank of India (Table 4).
Table 3. NPA ratios of scheduled commercial banks
Year
Gross NPA to Gross Advances
(%)
Gross NPA to Total Assets (%)
Net NPA to Net Advances (%)
Net NPA to Total Assets (%)
1996-97 15.7 7.0 8.1 3.3
1997-98 14.4 6.4 7.3 3.0
1998-99 14.7 6.2 7.6 2.9
1999-00 12.7 5.5 6.8 2.7
2000-01 11.4 4.9 6.2 2.5
2001-02 10.4 4.6 5.5 2.3
2002-03 8.8 4.1 4.0 1.8
2003-04 7.2 3.3 2.8 1.2
2004-05 5.2 2.5 2.0 0.9
2005-06 3.3 1.8 1.2 0.7
2006-07 2.5 1.5 1.0 0.6
2007-08 2.3 1.3 1.0 0.6
2008-09 2.3 1.3 1.1 0.6
2009-10 2.4 1.4 1.1 0.6
2010-11 2.4 1.4 1.1 0.6
2011-12 3.1 1.7 1.4 0.8
2012-13 3.6 2.03 1.7 1.03
Source: Reserve Bank of India (Issues of „Report on Trend and Progress of Banking in India‟)
Table 4. Net NPA as percentage of net advances
Year Nationalised
Banks
State Bank Group
Old Private Sector Banks
New Private Sector Banks
Foreign Banks
2002-03 4.74 4.12 5.54 4.63 1.76
2003-04 3.13 2.71 3.84 2.41 1.49
2004-05 1.85 2.23 2.74 1.85 0.86
2005-06 1.16 1.63 1.65 0.78 0.83
2006-07 0.92 1.32 0.91 0.97 0.97
2007-08 0.77 1.43 0.66 1.21 1.21
2008-09 0.7 1.5 0.9 1.3 1.7
2009-10 0.91 1.5 0.83 1.09 1.82
2010-11 1 1.7 0.5 0.6 0.6
2011-12 1.4 1.8 0.6 0.4 0.6
2012-13 2 2 0.8 0.4 1
Source: Reserve Bank of India (Issues of „Report on Trend and Progress of Banking in India‟)
74
an empirical assessment of relation between non-performing assets and terms of credit of public sector banks using linear regression model. In favourable macroeconomic conditions the chances of defaulting decreases as the borrower wants to maintain his credit worthiness. The study also identified „Pro-cyclical‟ behaviour of lending of the banks observed in other countries like China. Banks tend to lend more during economic expansion period due to amplification of asymmetric information and moral hazard. This in turn caused more defaults.
In another study Yadav (2011) tried to measure the impact of non-performing assets on public sector banks‟ profitability. Though the result was statistically significant with expected negative relationship, the low value of the coefficient (-0.0494) implies that level of NPA alone
does not explain the banks‟ profitability much. The other bank specific factors that affect the
profitability are credit-deposit ratio, priority sector advances as percentage of total credit, operating expenses as percentage of total asset, level of spread etc (Yadav, 2011). The lending policy of the banks is one of the causes for NPAs as pointed out by many researchers not only for India but for other countries also. Deterioration of the quality of advances in Indian public sector banks over the years can be attributed to aggressive lending policies undertaken by the banks (Ghosh and Ghosh, 2011). The same pro-cyclic lending behaviour of banks discussed by Reddy (2004), Ranjan and Dhal (2003) and several others combined with poor lending policies caused the banks to lend more in pre-recession period i.e. before FY 2008-09. That resulted in the increase in the NPA level in the subsequent years (Table 4). Inability of the banks to monitor and control the NPAs in the post-recession years proves the absence of proper pre-sanctioning appraisal and post-disbursement control within the public sector banks in India (Ghosh and Ghosh, 2011).
Now to find out the impact of macroeconomic factors on non-performing assets in Indian banks, there are very few studies. Das and Ghosh (2003) empirically examined non-performing loans of public sector banks of India in terms of macroeconomic condition along with various indicators like asset size, credit growth and operating efficiency indicators. In the macroeconomic stress testing of public sector banks factors such as output gap, Real Effective Exchange Rate appreciation above its trend value, inflation rate and monetary tightening i.e.
rise in interest rate significantly affect banks‟ asset quality as found out empirically by Roy and
Bhattacharya (2011). The study found that the coefficient for output gap and inflation rate have positive signs while the coefficient of REER deviation from trend is negative. The NPA level measured by default rate responds positively to inflationary shocks and also to the volatility of exchange rate (Roy and Bhattacharya, 2011).
Higher NPA levels of banks in the last decade prompted several actions from the Government of India and Reserve Bank of India in form of policy measures in the areas of debt recovery, securitisation and asset reconstruction, resolution of defaults and non-performing assets (Ranjan and Dhal, 2003). Narasimham committee was set up in 1991 to provide a road map for the banking sector reforms and to build a robust banking system in the country. The committee suggested that Indian banks should follow the international practice in defining a NPA (Jain, 2012). The committee also advocated for a proper system of income recognition and provisioning which is fundamental for the preservation of the strength and stability of the banking system. Another big step was The Securitisation and Reconstruction of Financial Assets and Enforcement of Security Interest (SARFAESI) Act, 2002, which was passed on December 17, 2002. Along with this Debt Recovery Tribunals (DRTs) and Lok Adalats were also formed for recovering NPAs. A more systematic surveillance and more internal review of health of loan accounts at a quicker pace when they are still in standard category can help prevent slippage of assets to a large extent (Rao, 2012).
2. Methodology
2.1. Data
75
and the bank level variables are obtained from various issues of „Report on Trend and Progress of Banking in India‟ published by Reserve Bank of India. The data for macroeconomic variables are collected from various issues of „Handbook of Statistics on Indian Economy‟ published by the central bank.
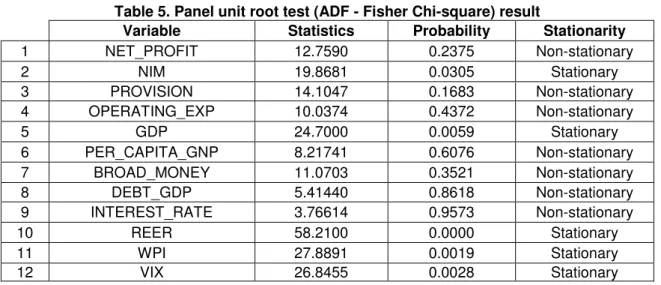
Many variables were considered while estimation. But only the significant variables are included in the baseline specification. Initially we considered total 12 variables of which four are bank specific variables eight are economic variables. But to be considered in the regression analysis the variables must be stationary in nature. So, after discarding the non-stationary variables we ultimately kept five variables for the regression analysis (Table 5). Among them one is bank level variable and rest four are macroeconomic variables. The bank level variable is the Net Interest Margin (NIM). The Macroeconomic variables are GDP growth rate (GDP), change in Real Effective Exchange Rate (REER), Inflation measured by Wholesale Price Index
(WPI). Also to take in account the effect of the external sector the “Global Variable”, change in
CBOE Volatility Index (VIX), based on S&P 500 Index Options is included. The Panel Unit Root Test (ADF - Fisher Chi-square) result for the variables is given in Table 5. Overall the data includes 85 observations evenly distributed over five cross sections i.e. bank segments.
Table 5. Panel unit root test (ADF - Fisher Chi-square) result
Variable Statistics Probability Stationarity
1 NET_PROFIT 12.7590 0.2375 Non-stationary
2 NIM 19.8681 0.0305 Stationary
3 PROVISION 14.1047 0.1683 Non-stationary
4 OPERATING_EXP 10.0374 0.4372 Non-stationary
5 GDP 24.7000 0.0059 Stationary
6 PER_CAPITA_GNP 8.21741 0.6076 Non-stationary
7 BROAD_MONEY 11.0703 0.3521 Non-stationary
8 DEBT_GDP 5.41440 0.8618 Non-stationary
9 INTEREST_RATE 3.76614 0.9573 Non-stationary
10 REER 58.2100 0.0000 Stationary
11 WPI 27.8891 0.0019 Stationary
12 VIX 26.8455 0.0028 Stationary
2.2. Panel Regression
We run the Panel Regression Model of the form-
Yt = αBt + Mt + Gt + ε
Here the dependent variable is Net NPA to Net Advances ratio (NPA_ADVANCES). The independent variables are - bank variable NIM shown by Bt, Macroeconomic variables GDP, REER and WPI denoted by Mt and the global variable VIX denoted by Gt. One time period lag of all the independent variables NIM, GDP, REER, WPI and VIX are also included as independent variables. We have used the fixed effect model as estimation technique.
3. Results
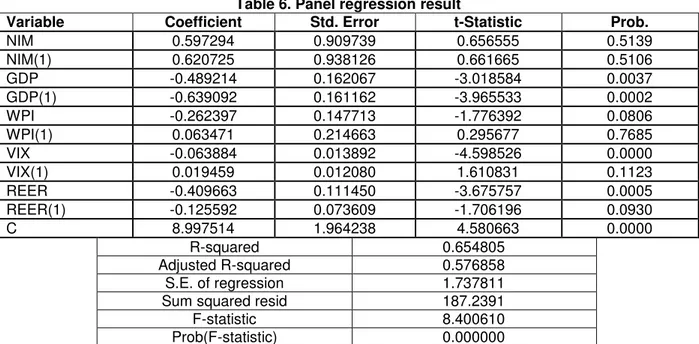
The panel regression result is depicted in the Table 6. From the result we can see that at 95 per cent confidence level the following variables have significant (Prob.<0.05) impacts – both GDP growth rate for current period and with one period lag, Change in Real Effective Exchange Rate (REER), Change in Real Effective Exchange Rate (REER) and Change in CBOE Volatility Index (VIX).
76
good extent. Now to analyze and validate the result we need to focus more on the sign of the coefficient than the value. For GDP and its one period lag the signs are negative in both cases. This implies that with decrease in economic growth the NPA level increases. It is quite evident from the current economic data of India; the GDP growth rate slumped to the decade low of about 4 per cent and the NPA level increased to almost 2005 level. The second significant variable is the change in Real Effective Interest Rate. We need to look how the exchange rate the non-performing asset level of banks economically, it is not as straight forward as the relation between GDP and NPA. The coefficient in REER is having negative sign denoting inverse relationship with non-performing asset level. That means a currency appreciation leads to more
NPA. One explanation for that could be the fact that strong currency makes the country‟s
products and services less competitive and thereby decreasing the amount of export. The next variable impacting the level of NPA is the global variable CBOE Volatility Index commonly referred as VIX. This index measures the volatility in the global market. The sign of the coefficient should be positive implying a rise in volatility would also increase the NPA of the banks. But, here we get the negative sign which is quite significant. It implies that though the volatility is increasing globally Indian banks are being able to keep the non-performing asset level at a declining trajectory.
Table 6. Panel regression result
Variable Coefficient Std. Error t-Statistic Prob.
NIM 0.597294 0.909739 0.656555 0.5139
NIM(1) 0.620725 0.938126 0.661665 0.5106
GDP -0.489214 0.162067 -3.018584 0.0037
GDP(1) -0.639092 0.161162 -3.965533 0.0002
WPI -0.262397 0.147713 -1.776392 0.0806
WPI(1) 0.063471 0.214663 0.295677 0.7685
VIX -0.063884 0.013892 -4.598526 0.0000
VIX(1) 0.019459 0.012080 1.610831 0.1123
REER -0.409663 0.111450 -3.675757 0.0005
REER(1) -0.125592 0.073609 -1.706196 0.0930
C 8.997514 1.964238 4.580663 0.0000
R-squared 0.654805
Adjusted R-squared 0.576858
S.E. of regression 1.737811
Sum squared resid 187.2391
F-statistic 8.400610
Prob(F-statistic) 0.000000
Notes: Method: Panel Least Squares, Periods included: 16, Cross-sections included: 5.95% Confidence Level
4. Conclusion and Policy Implications
The Non-Performing assets or bad loans continue to impact the economies around the world adversely from time to time. That led to a banking crisis in a country and a contagion to other countries as well as the whole banking sector of the world is connected now. The central banks all over the world have taken a tough stance against the non-performing assets and other regulators, think-tanks are joining them to create a safer banking sector. The Basel Three norms and Macro-prudential stress testing framework developed by International Monetary Fund (IMF) are outcomes of that.
77
developed and developing countries have already managed to curb the NPA level from the high of 2008-09 at the time of global recession, where it is still rising in India. Another point of concern in managing NPA is the high growth of restructured debt through Corporate Debt Restructuring (CDR) process. The aggregate restructured debt increased by 52.2 per cent to Rs. 2290 Billion in March 2013 from Rs. 1505 Billion in March 2012. It can be said that banks are more prone to take the CDR route than going for SARFAESI Act, Debt Recovery Tribunals and Lok Adalats for the resolution of NPA. So, the RBI should be more vigilant to stop the misuse of the CDR process.
References
Adebola, S.S., Wan Yusoff, S.B., and Dahalan, D.J., 2011. An ARDL approach to the determinants of nonperforming loans. Arabian Journal of Business and Management Review, 1(2), pp.20-30.
Berger, A.N. and Deyoung, R., 1997. Problem loans and cost efficiency in commercial banks, Journal of Banking and Finance, 21, pp.849-870. http://dx.doi.org/10.1016/S0378-4266(97)00003-4
Chu, V., 2001. Principais Fatores Macroeconômicos da Inadimplência Bancária no Brasil [Main Macroeconomic Factors for Banking Delinquency in Brazil]. BANCO CENTRAL DO Banco Central Do Brasil, Juros e spread bancário no Brasil: avaliação de dois anos do projeto, pp.41-44.
Das, A. and Ghosh, S., 2003. Determinants of credit risk. In: International conference on money, investment and risk at Nottingham Trent University. November 2003, Nottingham, United Kingdom.
Farhan, M., Sattar, A., Chaudhry, A.H., and Khalil, F., 2012. Economic determinants of non-performing loans: Perception of Pakistani bankers. European Journal of Business and Management, 4(19), pp.87-99.
Fofack, H., 2005. Nonperforming loans in Sub-Saharan Africa: Causal analysis and macroeconomic implications. World Bank Policy Research Working Paper, 3769. Ghosh, D. and Ghosh, S., 2011. Management of non-performing assets in public sector banks:
Evidence from India. International Conference on Management (ICM 2011) Proceedings, pp.750-760.
Jain, A., Jain, V. and Jain, S., 2012. Non performing assets in India. Indian Journal of Accounting, 42(2), pp.11-18.
Karim, M.Z.A., Chan S.G., and Hassan S., 2010. Bank efficiency and non-performing loans: Evidence from Malaysia and Singapore. Prague Economic Papers, 19(2), pp.118-132. Klein, N., 2013. Non-performing loans in CESEE: Determinants and impact on macroeconomic
performance. IMF Working Paper, WP/13/72.
Mohanty, M. and Turner, P., 2010. Banks and financial intermediation in emerging Asia: Reforms and new risks. BIS Working Papers, 313.
Park, J.C., 2011. Business cycle and bank loan portfolio performance: Empirical evidence from
Brazilian banks. [online] Available at:
<http://bibliotecadigital.fgv.br/dspace/handle/10438/8903> [Accessed 10 March 2014]. Ranjan, R. and Dhal, S.C., 2003. Non-performing loans and terms of credit of public sector
banks in India: An empirical assessment. Reserve Bank of India Occasional Papers, 24(3), pp.81-121.
Rao, K.S., 2012. Need for strategic shift in the management of non performing assets in the Indian Banking industry. The Journal of Indian Institute of Banking & Finance, April-June, pp.50-59.
Reddy, Y.V., 2004. Credit policy, systems and culture. Reserve Bank of India Bulletin, March, pp.303-311.
78
Siddiqui, S., Malik, S.K., and Shah, S.Z., 2012. Impact of interest rate volatility on non-performing loans in Pakistan. International Research Journal of Finance and Economics, 84, p.66.
Yadav, M.S., 2011. Impact of nonperforming assets on profitability and productivity of public sector banks In India. AFBE Journal, 4(1), pp.232-239.
Zeng, S., 2012. Bank non-performing loans (NPLS): A dynamic model and analysis in China. Modern Economy, 3(1), pp.100-110. http://dx.doi.org/10.4236/me.2012.31014