Stochastic Time Models of Syllable Structure
Jason A. Shaw1,2*, Adamantios I. Gafos3,4
1MARCS Institute, University of Western Sydney, Penrith, New South Wales, Australia,2School of Humanities and Communication Arts, University of Western Sydney, Penrith, New South Wales, Australia, 3Faculty of Human Sciences, University of Potsdam, Potsdam, Germany,4Haskins Laboratories, New Haven, Connecticut, United States of America
Abstract
Drawing on phonology research within the generative linguistics tradition, stochastic meth-ods, and notions from complex systems, we develop a modelling paradigm linking phono-logical structure, expressed in terms of syllables, to speech movement data acquired with 3D electromagnetic articulography and X-ray microbeam methods. The essential variable in the models is syllable structure. When mapped to discrete coordination topologies, syl-labic organization imposes systematic patterns of variability on the temporal dynamics of speech articulation. We simulated these dynamics under different syllabic parses and eval-uated simulations against experimental data from Arabic and English, two languages claimed to parse similar strings of segments into different syllabic structures. Model simula-tions replicated several key experimental results, including the fallibility of past phonetic heuristics for syllable structure, and exposed the range of conditions under which such heu-ristics remain valid. More importantly, the modelling approach consistently diagnosed sylla-ble structure proving resilient to multiple sources of variability in experimental data including measurement variability, speaker variability, and contextual variability. Prospects for exten-sions of our modelling paradigm to acoustic data are also discussed.
Introduction
The relationship between symbolic phonological structure and experimental phonetic data presents a specific case of a general challenge for modern cognitive science—the development of concepts and tools relating discrete and continuous aspects of a cognitive system. For the case of consonants and vowels, the phonological units to which most probabilistic modelling work has been devoted, general tools from statistical pattern analysis have gained traction on the problem of relating continuous phonetic dimensions to phonological categories [1–5]. Moving beyond phonemes to the syllabic level of phonological organization introduces new challenges, which we take up in this paper.
Syllables do not generally signal differences in meaning, except perhaps in cases involving presence vs. absence of a morpheme boundary, e.g.,nightratevs.nitrate,help us nailvs.help a snail. Rather, they impart organization to the units of phonological contrast. Syllable structure and the organization that syllables impart on spoken language remains stable across a range of OPEN ACCESS
Citation:Shaw JA, Gafos AI (2015) Stochastic Time Models of Syllable Structure. PLoS ONE 10(5): e0124714. doi:10.1371/journal.pone.0124714
Academic Editor:Iris Berent, Northeastern University, UNITED STATES
Received:October 12, 2014
Accepted:March 13, 2015
Published:May 21, 2015
Copyright:© 2015 Shaw, Gafos. This is an open access article distributed under the terms of the
Creative Commons Attribution License, which permits unrestricted use, distribution, and reproduction in any medium, provided the original author and source are credited.
Data Availability Statement:All relevant data are within the paper and its Supporting Information files.
phonemes. Thus,plea,treeandgleeshare a uniform syllabic structure—they are single syllables
—independent of the physiologico-acoustic events that take place during the production of these words. Evidence for syllabification has typically come from phonological argumentation within generative linguistics [6–8]. More recently, on the experimental side, there is mounting evidence that linguistic and specifically syllabic structure shapes the continuous low-level tem-poral organization of articulatory movements during speech [9–14]. Hall [15] remarks that the prospect of assessing syllable structure from patterns of articulatory movement represents“an entirely new approach to studying syllables.”However, there are conflicting data and an on-going debate about the degree to which syllabic organization shapes the phonetic signal [16,17].
Drawing on phonology research within the generative tradition, complex systems theory, and stochastic methods, we develop a modelling paradigm linking discrete phonological struc-ture, expressed in terms of syllables, to phonetic data acquired with 3D electromagnetic articu-lography and X-ray microbeam methods. We illustrate the paradigm with a model revealing the predictions of different syllable types and account for a number of previously observed ex-perimental results, including both the typical phonetic properties of simplex and complex sylla-ble parses but also the conflicting data, cases in which phonetic properties change under conditions we make precise.
Our approach combines symbolic and dynamical formal methods. Different syllabic parses of a phoneme string are mapped to distinct temporal configurations, using the concept of coor-dination topology, which expresses the temporal organization of phonological form [18]. Coor-dination topologies act as mutually exclusive independent variables in our modelling paradigm
—this is the symbolic part. Using concepts from the study of complex systems, coordination topologies correspond to the essential variables describing the qualitative aspects of phonologi-cal form. The task is to identify the topology accounting for the most variability in the experi-mental data. The crucial dynamical component offers ways to understand the fact that the same topology, the same qualitative structure, can correspond to a range of continuous mani-festations as non-essential parameters change. The fitting problem is therefore one of finding the combination of essential and non-essential variable settings that best accounts for the vari-ability in the experimental data.
In comparison to past approaches, we take an opposing perspective on the overarching quest of relating continuous measurements to higher level units of cognitive organization. Past approaches either have asserted that there is no systematic relation between abstract phonolog-ical organization and phonetic indices ([7] pages 16–17) or have sought and sometimes failed to identify invariant patterns in speech data [19,20]. With respect to Kahn’s stance [7], an alter-native approach, the one pursued in this work, is to appreciate that the relation between ab-stract phonological organization and phonetic indices may not be straightforward and undertake the task of developing tools enabling the systematic study of this relation. With re-spect to the second past approach, instead of attempting or hoping to discover invariance, our approach seeks to explain variability by positing different qualitative organizations (syllables) and mapping these to a range of quantitative manifestations as phonetic parameters change. This may appear as a retreat from the search for invariant reflexes of phonological structure in the quantitative phonetic record. But our approach is in fact stronger because it allows us to ex-pose the conditions under which qualitative phonological form may or may not map to any given range of phonetic parameters. The key is in developing the appropriate substrate for making explicit the full range of the relation between the qualitative and the quantitative. In this approach, we can uncover the conditions under which phonetic parameters remain stable but also ask questions about how such parameters change under different conditions. This characteristic of our approach in particular enables us to diagnose syllable structure in cases of
high variability in the experimental data, including cases in which past phonetic heuristics are known to break down.
The remainder of this paper is organized as follows. Section 2 provides background on sylla-bles and their phonetic indices. Section 3 provides an overview of methods for data acquisition and quantification. Section 4 develops our modelling paradigm and reports model fits to multi-ple articulatory datasets drawn from English and Arabic. Section 5 summarizes results and pro-vides a preliminary application of our tools for diagnosing the temporal patterns subserving syllable structure to acoustic data. An extension of our approach to acoustic data would enable virtually unlimited access to speaker populations for which speech movement data would be difficult or impossible to obtain. Section 6 briefly concludes.
Background
Syllables are fundamental units of spoken language. Linguistic theories posit syllables as foun-dational primitives in capturing systematic cross-linguistic sound patterns [6–8,21]. Syllables are also key constructs mediating between the abstract phonological organization of language and its phonetic encoding from the perspective of phonologists concerned with the phonology-phonetics relation, phoneticians concerned with models of phonetic implementation and psy-cholinguists interested in lexical access and speech planning [22–24]. In seeking correlates of syllabic organization in the phonetic signal, Stetson [25] first hypothesized that syllables corre-spond to the“pulses”created by contractions of the intercostal muscles, which control lung volume during speech. Later studies of pulmonary air pressure during speech [26] revealed that lung pressure is kept relatively steady over the course of the production of a sentence and that the slight variations in pressure do not correspond neatly to Stetson’s“syllable pulses”. Subsequent work turned to patterns of relative timing and in this domain there is by now sub-stantial experimental evidence for a timing-based correspondence between prosodic phonolog-ical structure, including syllables, and articulation [9–12,14,27–36]. More specifically, the hypothesis emerged that syllables correspond to characteristic patterns of coordination or rela-tive timing between the consonants and vowels that constitute these larger units.
In a related development but on the theory side, Gafos [18,37] introduced formal back-ground combining a theory of constraint interaction in linguistic grammars with the theory of dynamical representations on which much of the experimental work above is based. These for-mal tools were applied to Arabic, paving the way to experimental work on the consonant clus-ters in that language [38].
Arabic and specifically Moroccan Arabic is of special interest in seeking correlates of syllabic organization in the phonetic signal, because its syllable structure departs significantly from that of other well-studied languages. In their foundational work on generative phonology, Chomsky & Halle ([39] page 354) wrote that obstruent consonants (stops, fricatives and affricates) can-not form syllables by themselves or in combination with other consonants. However, subse-quent theoretical work provided considerable converging evidence from phonotactics, morphology and versification that in some languages syllables are composed entirely of conso-nants [40–44]. Moroccan Arabic is a remarkable illustration of this case. For instance, in this language the string of consonants [nx.dm]‘I work’is claimed to contain two syllables and [xs. sk.tft.tʃ.fs.st.ta]‘you have to inspect at six o’clock’is claimed to contain seven syllables (‘.’
grilled’![g.lih])[46]. As a result of these processes, a large number of word-initial consonant clusters were created. Some of these have a rising sonority profile, as in /glih/ above or /flan/
‘someone’, where the low sonority /g/ or /f/ are followed by the higher sonority liquid /l/. So-nority sequencing is a key concept in syllable structure [47–49]. Specifically, a rising sonority profile as in /gl/ or /fl/ is prototypical of syllable onsets cross-linguistically, and sonority se-quencing is argued to underlie the processing of consonant clusters in both production and perception (for production see [50]; for perception see [51]). However, many other clusters in Moroccan Arabic do not conform to this sonority profile. Even limiting attention just to two-consonant sequences of stops at the word-initial position, all possible combinations of labial, coronal and dorsal consonants are attested, e.g., [kt], [gd], [dg], [kb], [bk], [tb], [bt]. Crucially, the syllable structure assigned to the latter clusters is the same as that for rising sonority profile clusters. That is, [d.bal]‘to fade’and [k.tab]‘book’are like [g.lih] and [f.lan] in that they are all two syllables (as before‘.’marks syllable divisions). This pattern of syllabification contrasts with English where strings such as /kru/‘crew’or /gli/‘glee’are parsed into a single syllable with a COMPLEX two-consonant cluster as its onset [6]. In Moroccan Arabic similar strings are claimed to be parsed into two syllables, e.g. /kra/‘rent’![k.ra], /skru/![sk.ru]‘they got drunk’, /glih/![g.lih]‘he grilled’. In these Arabic forms, the syllables with the vowels [a], [u] and [i] can only include a single consonant as their onset ([42] page 252; [45] pages 159–160), hence SIMPLEX onsets, and the syllables preceding these consist entirely of consonants [k], [sk] and [g]. A range of phonological facts provide converging evidence for this syllable struc-ture in Moroccan Arabic. For example, patterns of seemingly puzzling variation in the phonetic forms of Moroccan Arabic words are explained parsimoniously by making reference to a ban on complex onsets. Thus, the word for‘he sprinkled’can be produced as [dr.dr] or [dər.dər], with a variably present voiced vocoid [ə], but not as [drə.drə] ([42] page 228). This variation is explained by stating that variably present voiced vocoid, [ə], can only occur after syllable on-sets; [drə] is not possible because [dr] is not a legal syllable onset. The distribution between high vowels and glides is also cleanly captured with reference to simplex onset syllables. For ex-ample, the singular form of‘son’is [wld] and cannot be produced as [uld]; the plural, formed by mapping the same sequence of consonants to a CCaC form, is [u.lad]‘sons’and cannot be produced [wlad]. The alternation between [w] and [u] follows from a ban on complex onsets. Because [wl] cannot be an onset, [w] is parsed into a separate syllable and surfaces as [u] in ac-cordance with the broader cross-linguistic distribution of vowel-glide pairs (specifically, the generalization that vocalic features, shared in the vowel-glide pairs such as [u]~[w] and [i]~[y] surface variantly but systematically as a vowel in syllable nucleus position and as a glide else-where). Finally, there has been substantial work on Moroccan Arabic versification which also supports the conclusion that this language bans complex onsets [42,52]. In Malħun songs, which conform to strict syllabic templates, word-initial consonant clusters cannot occupy a sin-gle beat. Such clusters are always split so that the first consonant, e.g., [g] of [glih], counts as an independent syllable ([42] page 252–253). In sum, Moroccan Arabic permits a rather complex set of consonant clusters and assigns a different syllabic organization to such clusters from En-glish. This language and its contrast to English therefore provide an excellent empirical domain for the development of methods to diagnose phonological and specifically syllabic organization in the phonetic signal.
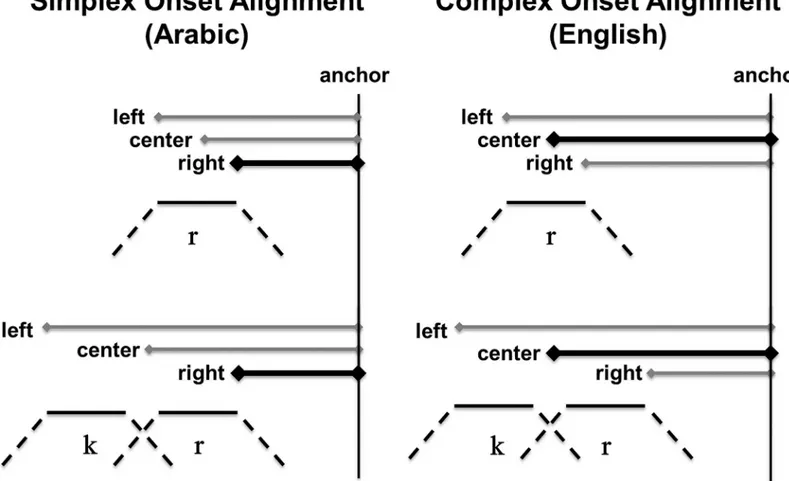
onset alignment, the pattern observed for English. Note that both schemas exhibit the same timing in CV syllables (Fig 1, top), but differ in how the CCV sequence (Fig 1, bottom) is timed relative to the CV sequences. The temporal differences illustrated schematically inFig 1can be captured quantitatively through analysis of how temporal intervals change across CV and CCV syllables. Arabic, a language in which consonant sequences cannot begin the same syllable, parses CCV as [C.CV] and exhibits the simplex onset alignment pattern (left). English parses CCV as [CCV] and exhibits the complex onset alignment pattern (right). The depicted patterns are canonical temporal schemes to which exceptions have been found. Both the canonical schemes as well as exceptions to them are of central concern in this paper.
InFig 1, the temporal life of individual segments,r,k, is represented by three lines: a dotted
line corresponding to movement toward constriction, a solid line corresponding to constriction duration and another dotted line corresponding to movement away from constriction. For each alignment schema, two words differing in the number of initial consonants,r,kr, are
shown. In addition, the figure shows three intervals for each word. The intervals are left-delim-ited by the left edge, right edge and center of the single consonant or consonant cluster and right-delimited by a common anchor (A) on the following vowel (exact definitions of these
Fig 1. Temporal alignment schemas.Schematic representation of three intervals, left edge to anchor (LE-A), center to anchor (CC-A) and right edge to anchor (RE-A), delineated by points in an initial single consonant, /r/ (top row), or consonant cluster, /kr/ (bottom row), and a common anchor (A). The alignment schema on the left shows simplex onset organization. The schema on the right shows complex onset organization. They key difference between simplex and complex alignment is in the patterns of change in the intervals across /r-/ (top) and /kr-/ (bottom) initial words. On the left (simplex), looking across the top and bottom schemes, RE-A remains stable while LE-A and CC-A increase. On the right (complex), looking across the top and bottom schemes, CC-A remains stable while LE-A increases and RE-A decreases.
‘landmarks’are given in the next section). The difference between simplex and complex onset alignment can be discerned by observing how the duration of these intervals changes across words, e.g.rue,crew. Simplex onset alignment corresponds to a pattern whereby the right edge to anchor (RE-A) interval is more stable than the center to anchor (CC-A) and left edge to anchor (LE-A) intervals [10,13]. InFig 1, left, the relative stability of the RE-A interval is indicated by the constant length of the horizontal line drawn between the right edge and the anchor. In reality, as stability is assessed across word types and multiple repetitions of each word, the RE-A interval is not constant. It is patterns of relative stability among intervals that are schematized here and such patterns can be statistically assessed as done in the references cited above. For complex onset alignment, a different pattern is found whereby the CC-A inter-val is more stable across words than the LE-A and RE-A interinter-vals [9,10,31]. As shown inFig 1, right, in complex onset alignment it is the horizontal line between the center of the cluster, or
“c-center”, and the anchor that remains constant across the two words. These results concur with independent arguments from phonological theory that Arabic disallows complex conso-nant clusters as syllable onsets whereas English permits them [7,42,54]. Accordingly, in Arabic the string /kra/‘rent’would not be just a single syllable. Rather, [k] would be in a different syl-lable from [ra]. Intuitively, we can describe the correspondence between these theoretical ideas and the data patterns ofFig 1as follows. Since in Arabic, it is only the immediately prevocalic consonant that is in the same syllable as the vowel, their timing relation should remain unper-turbed when another consonant is added to the beginning of the word. Thus, no change in the interval between the prevocalic consonant and the vowel is expected (Fig 1, left). In English, in contrast, since the added consonant is incorporated into the same syllable as the rest of the seg-ments, the timing relation between these segments must change to accommodate the extra member of the syllable. Thus, we expect the interval between the prevocalic consonant and the vowel to change when another consonant is added (Fig 1, right). These previous studies and other related ones in the research above provide methods for exploring the syllabic structuring of phonological form in terms of temporal patterns in the phonetic signal.
Experimental Data
Data acquisition
The experimental data were acquired using electromagnetic and X-ray microbeam technolo-gies, which allow the tracking of fleshpoints on speech articulators with high spatial-temporal resolution. In the electromagnetic articulography method (henceforth, EMA), an electromag-netic field is used to track movements of small receiver coils glued on the speech articulators, i.e. lips, tongue tip, tongue dorsum and jaw [56]. Transmitter coils, three coils (in two-dimen-sional EMA) or six coils (in three-dimentwo-dimen-sional EMA) [57], produce alternating magnetic fields at different frequencies in the range of about 10 kHz. The fields from the transmitter coils pass through the receiver coils and generate an electric signal. The voltage of this signal is related to the distance and orientation of the receiver relative to the transmitter coils. This relationship is used to calculate the position of the receivers as a function of time, permitting access to the fine details of the spatial and temporal properties of vocal-tract action during speech. The voltages in the receiver coils are captured at a sampling rate of 200 Hz. Audio data are also collected in parallel with the articulatory data. In the X-ray microbeam method, a flying spot X-ray microbeam generator emits a narrow beam of high energy X-rays [58]. High-speed computer control of this beam tracks gold pellets glued on the speech articulators [59–61]. The X-ray microbeam method pre-dates EMA, but produces fully comparable data-sets [62]. The datasets modelled in the paper include already published results on Arabic [13,63] and English [9], publically available data [61] and new data. The procedures for new data collection were approved by the Ethics Committee at the University of Potsdam, and written consent was obtained from all participants.
Quantifying temporal stability
In order to quantify temporal organization, we decompose articulatory movements corre-sponding to consonants and vowels into a series of landmarks ([18] page 276). These include START: the onset of movement toward an articulatory target; TARGET: achievement of an
articu-latory target; RELEASE: the onset of movement away from an articulatory target; and END: the
offset of controlled movement away from an articulatory target. For each consonant or vowel, these landmarks are identified by automatic algorithm with reference to the velocity signal of the relevant articulator. The receiver or pellet used to delineate the movement associated with a consonant is the one corresponding to the consonant’s primary oral articulator, e.g. the tongue tip for [d], the lower lip for [f], and the tongue back for [g]. The algorithm locates the time-stamp at which the instantaneous velocity exceeds, in the case ofSTARTand RELEASE, or falls
below, in the case of TARGETand END, a set percentage of the velocity peak associated with
movement toward or away from an articulatory target [64].
Extracting landmarks from speech movements using this procedure yields a series of time-stamps. These timestamps are used to quantify patterns of temporal organization correspond-ing to distinct syllable parses.Fig 2provides an illustration of how temporal landmarks parsed from the velocity signal are used to define structurally relevant temporal intervals (as schema-tized inFig 1) for three Arabic wordsbulha,sbulha, andksbulha(‘her urine’,‘her ear of grain’,
the temporal intervals of interest. In this example, the anchor is the maximal vertical displace-ment of the tongue tip movedisplace-ment corresponding to the segdisplace-ment [l]. That segdisplace-ment was chosen because it is at the end of the hypothesised syllabic unit and is shared across all stimuli (it ap-pears after the vowel in each stimulus word). We refer to this point as CMAX. In the analyses to follow, we use the articulatory landmarks of either CMAXor VEND, the offset of the vowel, as an-chor points. Changing the anan-chor point from CMAXto VENDincreases the amount of variability in the intervals. Later on, we show that our models can capture how such increases in variabili-ty influence phonetic heuristics for syllables.All thirvariabili-ty data tokens inFig 2(three words, ten repetitions) are aligned at the CMAXanchor timestamp. A second vertical black line is drawn at the mean value of the RELEASEtimestamps of the lower lip constriction for the [b],bRELEASEin
bulha,sbulhaandksbulha. Another vertical line is drawn at the center of the word-initial con-sonant cluster. The center of a cluster is the mean of the midpoints of each concon-sonant in the cluster, where consonant midpoint refers to the point equidistant to the TARGETand RELEASE
landmarks of the consonant. AsFig 2shows, the interval betweenbRELEASEand the anchor point does not seem to change much acrossbulha,sbulha,ksbulha. In contrast to what is observed forbRELEASE, the center of the consonant cluster gets farther away from the anchor point with each consonant added. This is indicated by the progressive leftward shift of the vertical grey lines frombulhatosbulhatoksbulha. In these Arabic datasets, then, as consonants are added at the beginning of a word, the local timing relation between the [b] and its adjacent vowel does not change much. This was schematically shown in the left panel ofFig 1. This Arabic temporal organization contrasts with the English one schematized in the right panel ofFig 1. In English, as consonants are added at the beginning of the word, the local timing between the prevocalic consonant and the vowel has been reported to change. In the right panel ofFig 1, this was shown by the progressive rightward shift of the prevocalic consonant.
The patterns illustrated inFig 2, like those to be quantified in our data, involve comparisons of interval stability, e.g.“the interval betweenbRELEASEand the anchor point does not seem to change much”and so on. Quantitatively, interval stability is assessed using the standard devia-tion (SD) of an interval’s duration and its relative standard deviation (RSD), defined as the ratio of the standard deviation to the mean. RSD is an appropriate stability index for our pur-poses because the mean of a timed interval is correlated with its variance [55,65], and we intend to compare the stability of temporal intervals of inherently different durations. In the remain-der of this paper, we develop models to capture patterns of stability, expressed in RSD and quantified over the LE-A, CC-A, and RE-A intervals, as shown inFig 1.
Models
Overview
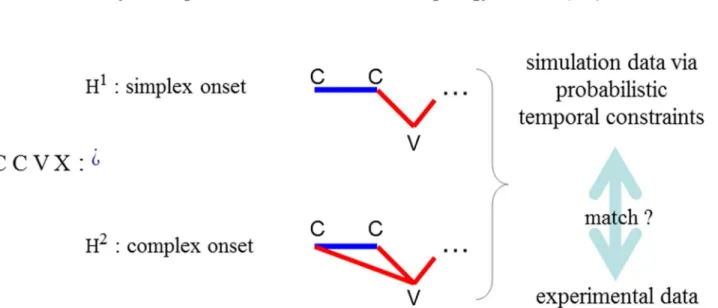
A schematic of the modelling paradigm is shown inFig 3. Each syllabic parse can be mapped to a coordination topology ([18] page 316), reflecting the temporal relations underlying the seg-mental sequence. Two contrasting coordination topologies corresponding to a simplex onset parse (H1) and a complex onset parse (H2) of a segmental substring CCVX are shown inFig 3. Mnemonics are‘C’for any consonant,‘V’for any vowel, and‘X’for any string over the C,V
Fig 2. Illustration of temporal alignment in Arabic.Positional signals in the y-dimension for 3 different receivers, tongue tip, lower lip and tongue back, for 10 repetitions each ofbulha,sbulha,ksbulha. The leftmost vertical line (grey) demarcates the center of the initial consonant cluster (or single consonant as in
bulha). The middle vertical line demarcates the release of the prevocalic consonant [b]. The rightmost vertical
line demarcates the point of inferred maximum constriction in the post-vocalic consonant [l]. Reprinted from [13] under a CC BY license, with permission from Cambridge University Press (S2 File), original copyright 2011.
alphabet. These topologies specify timing relations between consonants and vowels, indicated by lines between the segments so related. Different topologies act as mutually exclusive inde-pendent variables, e.g. in the example ofFig 3, for any given CCV sequence, the parse in which both consonants are part of the onset, as per the English syllable structure, is pitted against the parse in which only the prevocalic C is included in a syllable with the V, as per the Arabic sylla-ble structure. The task is to identify the topology accounting for the most variability in the data. For example, it is expected that for a CCV string in a language that does not admit com-plex onsets, the simcom-plex onset topology would explain more variability than the comcom-plex onset topology.
From a coordination topology, our models generate temporal structure that reflects this to-pology. Given a set of word types, e.g. CVX, CCVX, CCCVX, our models generate articulatory landmarks defining theplateauof each consonant in relation to its adjacent consonants and to the vowel. The plateau of a consonant is defined as the interval demarcated by two landmarks, TARGETand RELEASE. The TARGETcorresponds to the timestamp of the achievement of the
con-sonant’s constriction (see also Section 3.2), e.g. the timepoint where the tongue makes contact with the alveolar ridge during the formation of a [t]. RELEASEcorresponds to the timestamp of
the beginning of the movement away from that constriction (section 3.2). These landmarks are generated from stochastic versions of timing relations between consonants and vowels.
Syllable structure enters crucially in the statement of these relations. In a CCV sequence, the hypothesis that it is syllabified as C.CV, with a simplex onset, dictates that the vowel STARTis
timed to only the immediately prevocalic consonant. The hypothesis that it is syllabified as CCV, with a complex onset, dictates that the vowel STARTis timed to the center of the entire
prevocalic consonantal cluster. These outcomes can be derived from interaction of competing coordination relations ([18] page 316–322). Syllabic structure then determines the timestamp of the STARTlandmark for the vowel. From this timestamp, we derive the timestamp of the
an-chor, which is found all the way at the other end of the syllable, i.e., as in the VENDlandmark
Fig 3. Model overview.Given any sequence of consonants and vowels, here“C C V X”, we exemplify our modelling paradigm by asking: is the sequence parsed in terms of syllables of the simplex or the complex onset type? To evaluate the two hypotheses, H1vs. H2, the model projects coordination topologies
from hypothesized syllable parses. The topology on the top/bottom embodies temporal relations of the simplex/complex onset parse. Absolute time (ms) predictions can be derived from these topologies, and their match to experimental data can be rigorously evaluated.
(seeFig 1for schema), by adding a term corresponding to the vowel’s duration equal to the mean vowel duration in the experimental data. Based on this new timestamp, a set of anchor distributions is generated with the same mean but differing standard deviations. For example, some of our simulations reported below use a population of anchors in which the standard de-viation of the anchor increases from 0 ms in anchor 1 to 95 ms in anchor 20 in steps of 5 ms. Anchor variability is used as a stand-in for any source of variability in the intervals spanning within and across the hypothesized syllabic constituents. Such sources include speech rate, lexi-cal statistics, measurement error, and, of course, the segmental identity of the consonants in-volved. These and other yet unknown factors introduce noise in our experimental data. For instance, speech rate may vary from one stimulus production to another and lexical frequency and phonological neighbourhood density may affect variability in articulation [66,67]. Contex-tual predictability and repetition are also known to influence duration [68,69], and they do so independent of frequency [70]. In our paradigm, such variability is injected in the simulated data by systematically changing the standard deviation of the anchor distribution. Since it is the pattern of relative stability that is diagnostic of syllable structure, it is important that our variability manipulation affects all relevant intervals equally. Injecting variability at the anchor point ensures this because all intervals quantified in our data analyses are right-delimited by a shared anchor (seeFig 1), e.g. left edge to anchor (LE-A), center to anchor (CC-A) and right edge to anchor (RE-A).
Our description of coordination relations above is based on alignment of gestural land-marks. An alternative is coordination relations expressed in terms of phases. In models of speech production using phases [71], gestures are defined using the dynamics of second-order mass-spring systems. A gesture is associated with an abstract 3600cycle. A phase corresponds to a point on the cycle of the oscillating body, and is expressed by number of degrees on the cycle. Coordination relations are expressed in terms of synchronizing phase angles. A mapping can be established between temporal organization as generated in our scheme and the phase-based description. Specifically, the spatio-temporal landmarks in the coordination relations of our model correspond to phase angles, as in STARTis at phase 00, TARGETat 2400, RELEASEat
2900and so on. In the phase-based description, the duration of a gesture's cycle is determined by the stiffness parameter, with lower stiffness implying lower frequency and thus longer peri-od (duration of one cycle). Stiffness maps to plateau duration in our mperi-odel. Therefore, our choice of stating coordination relations does not prevent us from relating our models to those in a phase-based description. At the same time, our choice does not force us to make additional assumptions about the relation between data and model parameters.
On experimental results concerning inter-gestural phasing, see [20]. For applications to syllable structure and modelling results using a phase-based scheme see [32] and [72].
Finally, for phase-based schemes, coordination relations are usually expressed with two uni-versally assumed phasing values, in-phase and anti-phase. To quantitatively fit experimental data, our models require more specific information than two phases. One reason for this is that different consonant clusters (for which their constituent consonants are sequential and thus timed anti-phase) exhibit different degrees of overlap. Thus, saying they are anti-phase is not sufficient. For our quantitative aims, we need estimates of phonetic details which are under-de-termined by the two phasing relations above.
To sum up the central idea, the task of evaluating syllable parses with experimental data has been formulated here as the task of fitting abstract coordination topologies to the experimental data (seeFig 3). This fitting can be expressed using two types of parameters, coordination to-pologies and anchor variability. In the study of biological coordination and complex systems more generally, these two parameters correspond respectively to the so-called essential and non-essential parameters describing the behavior of complex systems ([73] page 13). Essential parameters specify the qualitative form of the system under study. For us, this corresponds to the syllabic parse of the phonological string. The fundamental hypothesis entailed in positing an abstract phonological organization isomorphic to a syllable parse is that syllables are macro-scopic units at the qualitative level of description. This means that syllables and the organiza-tion they impart on spoken language remain stable across the variable phonic identities of the sounds that take part in the hypothesized syllabic structuring of speech [74]. Syllable structure is independent of speech rate, the frequency of the specific words or the combinatorial proba-bility of the particular phonic sequences that make up these words in the mental lexicon. All of these latter factors have left imprints on the articulatory patterns that are registered in experi-mental data. Crucially, we do not know and it may not be possible to predict for any given stimulus how each such factor or combination of factors affects the intervals to be quantified. Therefore, in formulating the modelling problem of diagnosing syllable structure in experi-mental data, we let variability be one of the parameters manipulated in the fitting process.
Defining the models
The modelling paradigm described above serves to provide explicit links between qualitative phonological organization and its manifestation in terms of continuous indices such as phonet-ic duration and its variability. Via simulation, our models generate simulated quantitative data from hypothesized qualitative phonological structures. Then, the simulation-generated data can be compared or fitted to the experimental data.
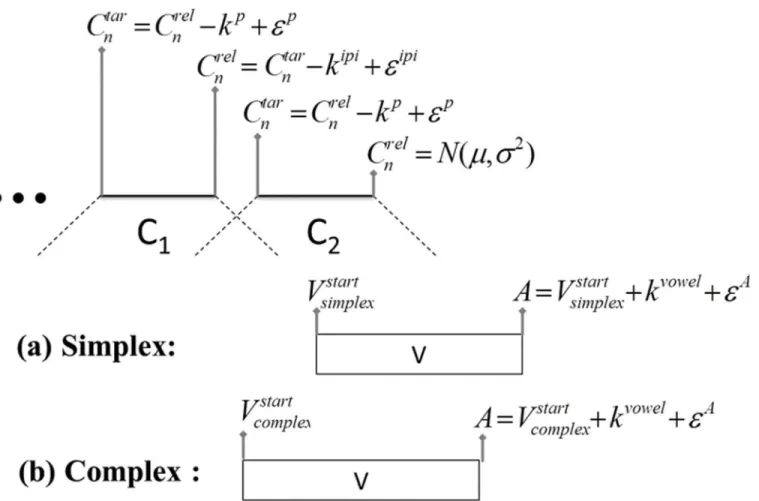
The simulation algorithm is summarized inFig 4. Word simulation proceeds from the re-lease landmark,Cr el
n , of the immediately prevocalic consonant,Cn. The timestamp of the
achievement of target of this consonant,Ctar
n , is determined by subtracting consonant plateau
duration,kp, fromCtar
n and adding an error term specific to consonant plateau duration,ε
p.
The error term is a random variable with a mean of 0 and standard deviation drawn from mea-surements of plateau duration in the data. Taken together, the plateau duration constant,kp, and the error term,εp, define the distribution of plateau values in the data being modelled.
Ad-ditional prevocalic consonants, e.g. C1in #C1C2V, are determined with reference to the imme-diately following consonant. For example, the timestamp of the release of,Cn−1,Creln 1, is determined by subtracting the inter-plateau interval,kipi, fromCtar
n and adding an error term
specific to inter-plateau duration,εipi. As with plateau duration, the constant for inter-plateau
identically for both simplex and complex onset models. The difference between the models, as noted above, is in the alignment of the vowel relative to prevocalic consonant clusters. This alignment is dictated by syllable parse. For simplex onset organization, the start of the vowel, Vstart, is left-aligned to the midpoint of the immediately pre-vocalic consonant. For complex onset organization, theVstartlandmark is left-aligned to the c-center, a point determined by the mean of the midpoints of all prevocalic consonants. This difference in vowel alignment ac-counts for the distinct patterns of variability characteristic of simplex vs. complex onset sylla-bles. The anchor point,A, occurs at the end of the syllable and right-delimits the three intervals of interest (Fig 1: left edge to anchor, center anchor, right edge to anchor). It is simulated by adding a constant corresponding to vowel duration,kvowel, to theVstartlandmark and adding an error term,εA. This final error term is varied in our simulation creating the different anchor
distributions described above so that we can observe syllable-referential patterns of temporal stability at different levels of variability in the intervals.
Crucially, the only difference between the models is in terms of syllable structure. From each model, simulated data was generated for word replicas with shapes corresponding to word shapes in the corpus. In the simulated data, the relative standard deviation (RSD) of the same three intervals measured in the experimental data, LE-A, CC-A, and RE-A, was calculated for each value ofεA. RSD was calculated by dividing the standard deviation of the interval by
the mean interval duration. The actual temporal structure corresponding to a coordination
Fig 4. Summary of word simulation algorithm.Consonant landmarks are generated from the release of the immediately prevocalic consonant. The alignment of the vowel is determined by the syllable parse (simplex or complex). All landmarks are associated with a noise term,ε.
topology is determined by the totality of deterministic timing relations and interactions be-tween these, but it is also affected by non-deterministic or stochastic forces in the timing rela-tions, as described above. Hence, the models are stochastic time models of syllables for which the statistics of the temporal organization corresponding to a syllable parse can be determined by sampling across many repetitions of actuating or simulating that parse. The RSDs so pro-duced are then evaluated against RSDs calculated from the experimental data. In the remainder of this section, we report model hit rates for experimental data drawn from English and Arabic, languages hypothesized to differ in syllabic structure.
Fitting the data
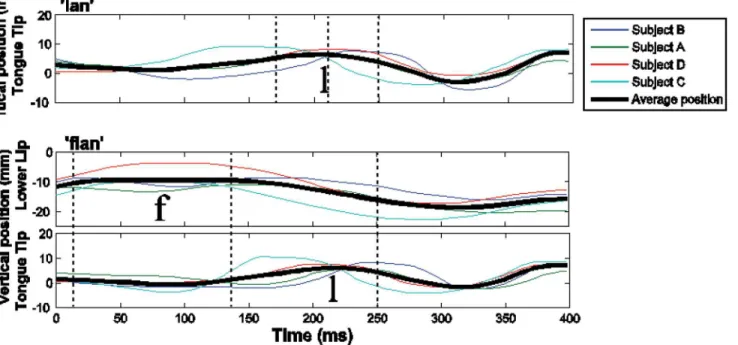
Recent work on Moroccan Arabic has reported relevant measurements of EMA data for a number of different word sets, either matched dyads, such astab~ktab, or where possible, matched triads, such asbulha~sbulha~ksbulha, discussed above [13,63].Fig 5shows represen-tative EMA data from Arabic. The upper panel shows the movement of the tongue tip sensor during production of the wordlan‘to become soft’by four different speakers of Moroccan Ara-bic. The position of the tongue tip rises to form the constriction for /l/, then falls, and, finally, rises again to form the constriction for /n/. All speakers show this pattern, even though there is variation across speakers in the interval between the two vertical maxima, or consonantal pla-teaus. The thick black line shows the average trajectory across speakers. The bottom two panels ofFig 5show movement of the tongue tip sensor and the lower lip sensor during production of the wordflan‘someone’. The individual grey lines correspond to the same Arabic speakers in the upper panel. The movement trajectories forlan(upper panel) andflan(lower two panels) are both right-aligned to the anchor. The duration of the movement of the tongue tip is rela-tively constant acrosslanandflanat both the level of individual speakers and the average
Fig 5. Articulatory recordings of Moroccan Arabic.The top panel shows the movement of the tongue tip during the production oflan‘to become soft’by four speakers. The bottom two panels show the tongue tip and lower lip movement during the production offlan‘someone’by the same four speakers. The colors of the lines indicate the different speakers. The thick black line shows the average trajectory across speakers. Dotted vertical lines indicate the landmarks that left-delimit the temporal intervals of interest: left edge, center, and right edge. The movement trajectory of the tongue tip is relatively consistent acrosslanandflantokens. In particular, the right edge landmark is stable while the center and left edge landmarks shift to the left.
across speakers. This pattern reflects simplex onset alignment, the schema laid out in the left side ofFig 1.
We now turn to model fitting for our first Moroccan Arabic corpus, which consists of 22 words:bal‘to urinate’,dbal‘to fade’,tab‘to repent’,ktab‘book’,lih‘for him’,glih‘to grill’,bati
‘to spend the night’,sbati‘belt’,bula‘urine’,sbula,‘thorn’,bulha‘her urine’,sbulha‘her ear (of grain)’,ksbulha‘they owned it for her’,dulhanoncekdulhanonce,bkdulhanonce,kulha‘eat for her’,skulhanonce,mskulha‘to hold for her’,lan‘to become soft’,flan‘someone’,kflan nonce.Fig 6summarizes interval measures for this corpus. It shows the mean duration of LE-A, CC-A, and RE-A intervals for 567 data points drawn across the entire corpus. The main observation is that the variability of the RE-A interval is lower than the CC-A interval and the LE-A interval. For a complete description of the data including statistical analyses see [13,63]. In fitting the data, we assess syllable structure through patterns of interval RSDs. RSD values for the LE-A, CC-A, and RE-A intervals are simulated and compared to values in the data. The phonetic parameters in the model, plateau duration (kp,εp), inter-plateau interval (kipi,εipi),
and vowel duration (kv), were set to means in the data computed across word set (usually matched dyads and triads), speakers, and trials. For a given word set, we conducted 1000 simu-lations. On each simulation run, RSDs were generated according to a hypothesized syllable parse across different levels of anchor variability (εA). At each level of anchor variability (on
each run) we evaluated the goodness of fit between data RSDs (three values for dyad/triad) and model RSDs (three corresponding values for dyad/triad). Ahitwas recorded for a simulation run if the goodness of fit to the data exceeded threshold at any level of anchor variability.
Fig 6. Duration of measured intervals in Arabic.Each box corresponds to 567 data points (collapsing over data reported in [13,63]). Left box: LE-A (left edge to anchor interval), middle box: CC-A (center to anchor interval), right box: RE-A (right edge to anchor interval). Intervals shown here were right-delimited by the CMaxanchor.
The procedure for determininghitsis as follows. Using the least squares method, a line was fit to coordinates determined by pairings of experimental and simulated RSDs (RSDLE A
sim ,
RSDLE A
data ;RSDCC Asim ,RSDCC Adata ;RSDRE Asim ,RSDRE Adata ). Residual sum of squares,SSresidual, were
calcu-lated as the sum of the square distances between the RSD coordinates and the best fitting line, according to the equationSSresidual=∑(xdata−xlinearfit)2, wherexdatais the RSD value from the
data andxlinearfitis the closest point on the best-fitting line. Total sum of squares were also
cal-culated using the standard equation,SStotal=∑(xdata−μ(x))2, whereμ(x) is the mean of RSD
values in the experimental data. The sum of squares of the model,SSmodel, was obtained by
sub-tracting the residual sum of squares from the total sum of squares:SSmodel=SStotal−SSresidual.
This indicates the improvement of the linear fit computed from the simulated RSDs over the mean as an estimate of data points. An F statistic,F¼ SSmodel
ðSSresidual=dfÞ, was then calculated by taking the ratio between the mean squares of the model (which in the case of a one parameter model like ours is equal to the sum of squares of the model,SSmodel) and the mean squares of the
resid-ual, obtained by dividing the sum of squares of the residresid-ual,SSresidual, by the degrees of
free-dom,df. The thresholdFvalue used to determine hits was 99.0 (p<. 01). A simulation
generating anFvalue greater than 99.0 was recorded as ahit; anFvalue less than 99.0 was con-sidered amiss. How reliably a syllable parse captures the data was assessed over multiple runs of the simulation in the form of ahit rate, defined as the number of hits divided by the total number of simulation runs.
Our choice of goodness of fit metric emphasizes the relationship between RSD values as op-posed to the exact RSD values in the data by tolerating affine transformation between experi-mental RSD values and simulated RSD values. For example, consider a set of experiexperi-mental RSDs such as LE-A = 20.5%, CC-A = 9.7%, RE-A = 5.1% reported for the Moroccan Arabic dyadbal~dbal. Simulated RSDs that are identical (20.5%, 9.7%, 5.1%) would of course provide a perfect fit to this data but so too would values that are linearly transformed, such as
LE-A = 16.4%, CC-A = 7.76%, RE-A = 4.08%, which are multiplicatively related to thebal~dbal by a factor of. 8. Simulated RSD values of LE-A = 28.5%, CC-A = 17.7%, RE-A = 13.01%, which are shifted up from the data by a constant value of 8% would also provide a perfect fit to the data. Transformations such as these (additive, multiplicative) preserve the relationship be-tween RSD values in affine space. Computing model error from a linear fit to experimental and simulated RSD coordinates therefore deemphasizes exact values in favour of magnitude rela-tionships between intervals, i.e., the size of the difference between the RSD of the RE-A and LE-A intervals relative to the size of the difference between the RSD of the LE-A and CC-A in-tervals. This is highly appropriate for our aim of assessing which coordination topology under-lies the data.
We highlight the key components of the fitting process. First, the fit of a coordination topol-ogy to data is evaluated on the basis of relationships between interval stabilities for all three rel-evant intervals. The fitting process assesses numerical predictions for each of the three
[1,76]. The probabilistic rules of English past tense formation developed in Albright and Hayes [75] are associated with araw confidencescore. Defined as the ratio of the number of times that a particular rule applies, the rule’shits, by the number of times in which the environment for the rule is present in the data, the rule’sscope, the confidence score reflects the likelihood that the rule applies when its environment is met. In the case at hand, that of syllable structure, the hit rateproposed above provides a simple statistic summarizing the probability that the data was generated under the hypothesized syllable structure. A final key component of the model-ling paradigm is the stochastic component, introduced in error terms associated with gestural landmarks and scaled in the case of anchor variability. Parameterizing discrete representations (coordination topology) via anchor variability allows us to reveal the range of RSD patterns consistent with simplex and complex onset syllables.
Arabic
We start with data from a single speaker, reported in [13] and summarized inFig 6.Table 1 shows interval RSDs and model hit rates for seven word sets (matched dyads and triads). RSDs for all word sets show the expected pattern of RE-A interval stability. The RE-A interval has a lower RSD than the CC-A interval and the LE-A interval. Model simulations were run following the procedure described earlier. The hit rates for the two models clearly reveal the superior perfor-mance of the simplex onset model in fitting the Arabic data. The simplex onset model achieved a significant fit to the data on at least 847 out of 1000 runs of the simulation and an average hit rate of 95.3%. The complex onset model achieved at most 4 hits out of 1000 trials and an average hit rate of 00.1%. The simplex onset model clearly outperforms the complex onset model.
We now turn to datasets drawn from the same speaker for which interval stability measure-ments are not always consistent with the phonetic heuristic for simplex onsets, that is, with RE-A stability as exemplified inFig 1.Table 2shows two sets of interval RSDs, for each word dyad or triad. The intervals for these word dyads or triads were quantified using the two mea-surement techniques, once with the CMAXanchor and once with the VENDanchor. When using the CMAXanchor, the RE-A interval showed lower relative standard deviation (RSD) than the CC-A interval. This is the canonical result for Arabic and, as with the data inTable 1, it goes along with theoretical evidence supporting the simplex onset hypothesis for Moroccan Arabic [42]. However, when the data were quantified using the VENDanchor the inverse stability pat-tern was found. This latter patpat-tern is the same as that seen in English and would seem to sup-port the complex onset hypothesis. In sum, in one subset of measurements it is the RE-A that
Table 1. The relative standard deviation (RSD) of three intervals, left edge to anchor (LE-A), center to anchor (CC-A), and right edge to anchor (RE-A), for different Moroccan Arabic word sets and model hit rates for each syllabic organization, simplex onsets and complex onsets.
Word dyad / triad Interval stability (RSD) Hit rate
LE-A CC-A RE-A Simplex onset Complex onset
dal~dbal 20.5% 9.7% 5.1% 98.7% 00.3%
tab~ktab 6.8% 5.7% 5.5% 97.1% 00.4%
lih~glih 18.5% 10.7% 2.7% 98.3% 00.1%
bati~sbati 19.3% 7.1% 5.2% 84.7% 00.1%
bula~sbula 22.0% 11.1% 7.3% 88.5% 00.0%
bulha~sbulha~ksbulha 24.6% 15.9% 11.2% 100% 00.1%
dulha~kdulha~bkdulha 28.5% 22.3% 20.3% 99.9% 00.0%
Average hit rate 95.3% 00.1%
is most stable, but in a different subset it is the CC-A interval that is most stable. We refer to cases of this sort as“stability reversals”.
One response to such inconsistencies would be to conclude that temporal stability indices are unreliable in diagnosing syllabic organization (“everything goes”) or even that syllable structure does not and need not, as Kahn ([7] pages 16–17) asserted, have consistent phonetic indices. A different approach is to appreciate that the relation between abstract phonological organization and these indices may not be straightforward, and undertake the task of develop-ing tools enabldevelop-ing the systematic study of this relation. More generally, the problem met here is a specific instance of a larger problem in present day cognitive science, namely, the problem of evaluating qualitative theoretical constructs with variable experimental data.
We illustrate our approach in two steps. First, we show that it is possible to evaluate syllabic organization even when phonetic heuristics produce ambiguous or misleading results, as in the case of the stability reversals inTable 2. In a second step, we use our models to make explicit the relation between theoretically posited syllable parses and the entire range of their quantita-tive consequences. The models will be employed as analytical tools to study the effect of vari-ability on indices of temporal stvari-ability. Via the models we generate simulated data. The focus will be on how the patterning of temporal stability indices changes as we change variability in the data which, it will be recalled, is done in our simulations by systematically changing anchor variability.
Table 2. The relative standard deviation (RSD) of three intervals, left edge to anchor (LE-A), center to anchor (CC-A), and right edge to anchor (RE-A), calculated over Moroccan Arabic word sets using different landmarks, VEndand CMax, to right-delimit the intervals.
Word dyads / triads Anchor Interval stability (RSD) Variability Index
LE-A CC-A RE-A
bulha~sbulha~ ksbulha CMAX
24.6% 15.9% 11.2% 22
VEND 23.9% 17.8% 18.2% 41
bal~dbal CMAX 20.5% 9.7% 5.1% 15
VEND 27.5% 22.7% 25.3% 63
tab~ktab CMAX
6.8% 5.7% 5.5% 14
VEND 12.2% 7.7% 10.0% 26
bula~sbula CMAX 22.0% 11.1% 7.3% 19
VEND 14.6% 6.5% 6.9% 26
The bold values indicate the intervals with the lowest RSD. For intervals right-delimited by the CMaxlandmark, the RE-A interval has the lowest RSD. For
intervals right-delimited by the VEND
landmark, the CC-A interval has the lowest RSD. The rightmost column provides the standard deviation of the RE-A as an index of variability for the corresponding word set.
doi:10.1371/journal.pone.0124714.t002
Table 3. Hit rates for each syllabic organization, the simplex onset model and the complex onset model, for sets of Moroccan Arabic words that show stability reversals.
Word dyads / triads Anchor Hit rate
Simplex onset Complex onset
bulha~sbulha~ksbulha VEND
85.4% 00.7%
bal~dbal VEND
45.9% 01.8%
tab~ktab VEND 52.2% 02.8%
bula~sbula VEND 86.0% 00.6%
Average hit rate 67.4% 1.5%
We begin by applying our procedure for quantitative evaluation to the Moroccan Arabic word sets shown inTable 2. For each set of RSD values showing CC-A stability inTable 2, we again conducted 1000 simulations of each syllabic organization and evaluated the goodness of fit between simulated data and experimental data, as above. The hit rates for each case are given inTable 3. For the measurements under consideration, RSD of intervals right-delimited by the VENDanchor, the CC-A interval has a lower RSD than the RE-A interval and the LE-A interval. Nevertheless, the simplex onset model outperforms the complex onset model in each case.
Given that this subset of Arabic data shows CC-A stability and that CC-A stability has been considered prototypical of complex onset organization (seeFig 1, right), why does the simplex onset model outperform the complex onset model? Through simulation, our models allow us to sharpen reasoning about the relation between syllable structure and continuous indices of that structure in articulatory data. As the non-essential variable (anchor variability) is scaled, the interval RSDs change in accordance to the structure dictated by the essential variable (coor-dination topology). The result is a pattern of change, or dynamic, that characterizes any given syllabic structure (the essential, qualitative form) as a function of scaling or changing the non-essential variable in the model. The dynamics of interval RSDs as a function of anchor variabil-ity are illustrated inFig 7for simplex onset (left) and complex onset (right) syllables. The lines show the evolution of the RSD,y-axis, of three intervals (LE-A, CC-A, RE-A) as a function of increasing anchor variability,x-axis. As anchor variability increases, the RSD of all three inter-vals increases. However, the different interinter-vals increase at different rates. At low levels of the non-essential parameter (anchor variability), the two syllable structures impart different pat-terns of RSDs on the intervals, which, when expressed in terms of inequalities, reflect the ex-pectations for each syllable type represented by‘canonical’temporal schemes as depicted in Fig 2. For simplex onset syllables, the RSD of the RE-A interval is lower than the CC-A interval and LE-A interval. For complex onset syllables, the RSD of the CC-A interval is lower than the RSD of the RE-A interval and LE-A interval. These are the two canonical stability patterns as-sumed to characterize simplex and complex onsets; seeFig 2, left and right, respectively. But as anchor variability increases, the RSD of the RE-A interval increases at a faster rate than the RSD of the CC-A interval. A crossover point can thus be seen for simplex onset syllables after which the CC-A interval emerges as having better stability (lower RSD) than the RE-A interval. The stability pattern has changed. Specifically, it has changed to an English-like pattern ex-pected for languages instantiating the complex onset hypothesis, even though the model gener-ating the data here embodies the simplex onset hypothesis.
The model simulations permit one to see that there are stringent conditions for the occur-rence of each stability pattern. Both stability patterns (RE-A more/less stable than CC-A) are consistent with simplex onset organization. Given a corpus and two sets of intervals delimited by different anchors extracted from this corpus, the model embodying simplex onsets predicts the following implicational relationship: if one set of intervals shows CC-A stability and the other shows RE-A stability, then the former set of intervals must correspond to an anchor with higher variability than the later. The opposite relationship is precluded; it is not the case that
“everything goes”.
interval) have a higher variability index than the sets of measurements showing RE-A stability. The model hits reported inTable 3add quantitative detail to these qualitative predictions. On the subset of Arabic data showing CC-A stability (Table 2), the simplex onset model outper-forms the complex onset model because the interval stabilities predicted by the simplex onset model are quantitatively closer to the stabilities in the experimental data than those predicted by the complex onset model. We can thus see that although CC-A stability has been viewed as a phonetic index of complex syllable onsets [9,10,13,31,63], CC-A stability does not necessarily implicate complex onset organization. More generally, the simulations inFig 7demonstrate that the mapping between intended syllable structure and stability patterns cannot be express-ed coarsely in terms of invariant stability patterns. The simplex onset model is consistent with both RE-A stability and CC-A stability. The stability pattern changes and specifically it changes systematically as a function of anchor variability. This fact reveals the fallibility of diagnosing syllabic organization via RSD patterns expressed in terms of static inequalities. As we have il-lustrated by the model-experimental data fits inTable 3, our models go further because they correctly diagnose syllabic organization and make sense of the seemingly inconsistent results concerning stability reversals inTable 2.
Before moving on to data from a language admitting complex onsets, we next consider a larger dataset for which variability is contributed not by the measurement method (CMAX an-chor versus VENDanchor) but by pooling data across four Arabic speakers. In other words, in this dataset rather than calculating RSDs separately for each speaker, as is typically done to re-duce variability, we have calculated the RSDs across speakers. Resulting RSDs and hit rates for the simplex and complex onset model on this dataset are inTable 4. Because interval measure-ments now incorporate inter-speaker variation in addition to the other sources of variability,
Fig 7. Simulation results for the simplex onset model (left) and the complex onset model (right).They-axis shows the RSD of the LE-A, RE-A and CC-A intervals. Thex-axis shows anchors from lowest to highest variability (1 to 20). For anchors of low variability, anchors 1–6, the RE-A interval has the lowest RSD for the simplex onset model (left) and the CC-A interval has the lowest RSD for the complex onset model (right). Beyond anchor 7, however, stability patterns, expressed in terms of inequalities, change. For the simplex onset model (left), the RE-A interval becomes more variable than the CC-A interval; for the complex onset model (right), the CC-A interval becomes more variable than the LE-A interval. These changes in patterns of RSD inequalities obscure the expected phonetic consequences of the underlying syllabic structure. The main point illustrated is that the mapping between abstract syllabic organization and phonetic stability patterns cannot be expressed in terms of canonical or invariant stability patterns. The same symbolic organization, e.g. that of simplex onsets, surfaces with the expected phonetics of simplex onsets for one range of anchor values (1–6) but also with the expected phonetics of complex onsets for another range of parameter values (anchor value 7 and beyond).
the RSDs are quite a bit higher than in the single speaker data discussed above, particularly for the RE-A interval and the CC-A interval (the intervals in this dataset were all right-delimited by the CMAXanchor). For two of the three word sets,lan~flan~kflanand kulha~skulha~ms-kulha, the CC-A interval has a lower RSD than the RE-A interval. Despite CC-A interval stabil-ity, the simplex onset model again outperforms the complex onset model on Arabic data. In short, the stochastic models are not misled by inter-speaker variability just as they were not misled by measurement variability in the single speaker data.
In sum, the simplex onset model outperforms the complex onset model on Arabic data. Moreover, it does so in pockets of Arabic data showing CC-A interval stability due to either measurement variability (Table 2andTable 3) or inter-speaker differences (Table 4). The modelling paradigm sees through these sources of variation to reveal phonological organiza-tion in terms of syllable structure. The improved precision of our technique, over the use of heuristics based on stability inequalities, derives from two sources. First, our models expose how coordination topologies, the essential variable in our approach, structure relationships be-tween interval stabilities. Second, the details of our fitting process, which takes into account the RSD of all three intervals and the relationship between them, is sensitive enough to capture in the data structure imparted by phonological variables in the model. We have shown that both simplex and complex syllabic structures may generate patterns whereby the CC-A interval is more stable than the RE-A interval. However, the fine-grained relationships amongst stabilities in the data (at levels of variability where both syllable parses would predict CC-A interval sta-bility) are more consistent with the simplex onset model than the complex onset model. The stochastic interpretation of phonological structure proposed in our approach thereby succeeds in adjudicating between competing hypotheses when phonetic heuristics are ambiguous or misleading.
English
We now ask whether a model embodying the complex onset hypothesis would outperform a model embodying the simplex onset hypothesis for data drawn from a language admitting complex onsets (the reverse of what we met above for Arabic). It is generally accepted that En-glish is such a language [7]. As reviewed earlier, it is standard to assume that strings such as /kru/‘crew’are parsed into a single syllable in English, with a complex two-consonant cluster as the onset of that syllable. We predict that for English data, a model embodying the complex onset hypothesis (Fig 3, H2) would outperform a model embodying the simplex onset hypothe-sis (Fig 3, H1).
Table 4. The RSD of three intervals, left edge to anchor (LE-A), center to anchor (CC-A), right edge to anchor (RE-A) calculated across multiple (10–18) repetitions by four speakers of Moroccan Arabic.
Word triads repetitions speakers Interval stability (RSD) Hit rate
LE-A CC-A RE-A Simplex onset Complex onset
lan~flan~kflan 10–18 4 32.8% 26.8% 26.9% 82.4% 00.0%
kulha~skulha~mskulha 10–18 4 32.8% 26.6% 30.2% 54.5% 00.0%
bulha~sbulha~ksbulha 10–18 4 27.1% 25.0% 24.7% 90.2% 00.0%
Average hit rate 75.5% 00.0%
The RSD of the CC interval is lower than the LE and RE intervals for two of the three word sets. However, for all word sets, the simplex onset model achieves a greater hit rate than the complex onset model.
There are by now a considerable number of experimental studies on syllable structure and timing in English (see references in Section 1). As expounded above, a key component of our modelling paradigm is that it allows us to study therelationbetween structurally relevant inter-vals. This requires a complete set of measurements from the data. Some of the relevant work on English has focused on patterns of inequality between just two of the intervals. We model experimental data here for which a complete set of measurements are available. Since English is a better-studied language than Arabic, data are available from a larger number of speakers. There is a tradeoff, however, in the type of consonant clusters that are available. Our Arabic datasets included tri-consonantal clusters with both rising and falling sonority profiles. English is more limited in the range of clusters it allows.
Our first English dataset draws from work of Browman and Goldstein reported in [9]. This was the first study to use fleshpoints on articulatory organs to investigate the relation between temporal stability and syllable structure. This study provided over the word set [pɔt], [sɔt], [lɔt], [spɔt], [splɔt], [plɔt] measurements of the stability of all three relevant temporal intervals, LE-A, RE-A, and CC-A. Interval stability was reported in terms of the standard deviation of each interval calculated across the word set. In order to make the measurements directly com-parable to those for Moroccan Arabic discussed in the previous sections, the relative standard deviation (RSD) of the English productions was calculated by dividing the standard deviation of each interval by the mean of that interval. Alongside this dataset, we analyzed a similar word set,pend~spendfrom another American English speaker collected using the EMA facilities at the University of Potsdam speech production lab. The reason for including this additional word set will become apparent later in the discussion.
Our main source of English data was drawn from the Wisconsin X-ray microbeam speech production database [61]. This database contains recordings of a variety of tasks including pro-duction of sentences, passages and word lists from fifty-seven speakers of American English. Although not all speakers contributed recordings for all tasks and some recordings have miss-ing data which make them unusable for our analysis, the Wisconsin datasets remain an archive of articulatory data that is extremely impressive in size. To illustrate how consonant clusters are timed relative to singleton consonant onsets in English,Fig 8shows movement trajectories for the tongue tip (referred to as T1 in the database) for the word‘row’(top panel) and for the tongue tip and tongue back (referred to as T4) for the word‘grows’(bottom panel). These words were extracted from read sentences. The word‘grows’was extracted from the sentence
“The noise problem grows more annoying each day”of Task 57 ([61] page 194). The word
The English datasets above concern word-initial clusters. No previous work on cluster tim-ing in English has examined word-medial clusters. If the timtim-ing patterns assessed in our mod-els are characteristic of syllable-initial as opposed to just word-initial clusters, then the same patterns should be also met in word-medial clusters, since in both word positions the syllabifi-cation is claimed to be the same. We have pursued this prediction and thus extended the empirical range of the correspondence between timing and syllables, by examining a set of word-medial clusters from the Wisconsin X-ray microbeam speech production database [61], obtaining articulatory measurements for a set of words from a population of 21 to 40 speakers, depending on the word quantified, as described below. The number of words and speakers were determined by our quantification requirements. Specifically, we looked for words with word-medial syllable onset clusters for which the consonantal gestures for all the onset conso-nants and the postvocalic consonant could be measured (often single gestures could not be measured for one or the other speaker). Furthermore, we chose a set of words with uniform prosodic structure, specifically with stress on the second syllable, because in bisyllabic words the position of stress is known to affect speakers’judgments about syllabification [77,78]. With-in this archive, we converged on six words, three with sWith-ingle C onsets and three with CC onsets: be[f]ore, u[p]on a[b]out, be[tw]een, a[cr]oss, hi[sp]anic, with 21–40 repetitions per word. A few other two syllable words in the corpus are stressed on their second syllable, but these words appeared in contexts which made it impossible to measure the gestures for the majority of speakers. The speakers were not the same for every word because at times a gesture could not be measured for a speaker in one word, but all gestures could be measured in another word
Fig 8. Articulatory recordings of English.The top panel shows the movement of the tongue tip during the production of‘row’by five speakers. The bottom two panels show the tongue tip and tongue back movement during the production of‘grow’by the same five speakers. The shading of the lines indicates the different speakers. The thick black line shows the average trajectory across speakers. Dotted vertical lines indicate the landmarks that left-delimit the temporal intervals of interest: left edge, center, and right edge. The movement trajectory of the tongue tip is shifted (to the right) inrowrelative togrowwhile the center landmark remains constant across words.
produced by the same speaker. In the organization of the Wisconsin database, each word oc-curred in a specific task number. TheS1 Filelists subject codes for the subjects whose data were measured for any given word as well as the tasks from which these words were obtained.
Quantification of our data proceeded as follows. For every instance of our words, the left edge to anchor (LE-A), center to anchor (CC-A), and right edge to anchor (RE-A) intervals were measured following the procedures in Section 3.2. Over the productions of one word (e.g. 32 productions ofbefore, 40 productions ofuponand so on) mean interval durations were cal-culated.Fig 9shows the means for the three interval durations across the different words. The
Fig 9. Duration of measured intervals in English.Boxes summarize mean duration calculated over 255 data points from 21–40 speakers (depending on the word) of each interval. Left bar: LE-A (left edge to anchor interval), middle bar: CC-A (center to anchor interval), right bar: RE-A (right edge to anchor interval).
![Fig 6. Duration of measured intervals in Arabic. Each box corresponds to 567 data points (collapsing over data reported in [13,63])](https://thumb-eu.123doks.com/thumbv2/123dok_br/18416090.360358/15.918.56.845.117.542/duration-measured-intervals-arabic-corresponds-points-collapsing-reported.webp)