Ar
ti
cle
0103 - 5053 $6.00+0.00
*e-mail: [email protected]
Genetic and Environmental Inluence on Essential Oil Composition
of
Eugenia dysenterica
Alessandra R. Duarte,a Ronaldo R. Naves,b Suzana C. Santos,a
José C. Seraphinc and Pedro H. Ferri*,a
aInstituto de Química, bEscola de Agronomia e de Engenharia de Alimentos and cInstituto de
Matemática e Estatística, Universidade Federal de Goiás, CP 131, 74001-970 Goiânia-GO, Brazil
A composição dos óleos essenciais de Eugenia dysenterica de populações silvestres de Senador Canedo (SC) e Campo Alegre de Goiás (CA) e de plantas cultivadas, crescidas adjacentemente a partir de sementes dos dois sítios de amostragem, indicou a presença de dois grupos de óleos relacionados à origem das amostras. O grupo I incluiu amostras de SC, seja da população cultivada (subgrupo IA), com percentagens elevadas de α-pineno (5,9-13%), β-pineno (6,6-14%) e (Z)-β-ocimeno (0-13%), seja da silvestre (subgrupo IB), com percentagens elevadas de γ-cadineno (21-34%), limoneno (1,3-28%) e óxido de carioileno (1,5-14%). O grupo II incluiu amostras cultivadas e silvestres de CA, com β-carioileno (15-44%), δ-cadineno (6,4-21%) e α-copaeno (4,4-14%) como majoritários. A correlação canônica revelou que limoneno, γ-cadineno, óxido de carioileno, Zn, Cu, Fe, Mn, temperatura e precipitação média mensal correlacionaram-se às amostras silvestres de SC, enquanto (Z)-β-ocimeno, α-copaeno, β-carioileno, α-humuleno,
δ-cadineno e P correlacionaram-se às amostras silvestres de CA e a todas as amostras cultivadas, independentemente da origem da semente. As variações nos óleos parecem ser geneticamente determinadas, em adição a uma inluência ambiental sobre as amostras de SC.
The composition of the essential oil of Eugenia dysenterica collected from wild populations in Senador Canedo (SC) and Campo Alegre de Goiás (CA), as well as from cultivated plants growing adjacently from seeds at the same sites has indicated the presence of two oil clusters related to sampling origin. Cluster I included only SC samples, either from the cultivated population (subcluster IA) with high percentages of α-pinene (5.9-13%), β-pinene (6.6-14%) and (Z)-β-ocimene (0-13%), or from the wild population (subcluster IB) with high contents of
γ-cadinene (21-34%), limonene (1.3-28%) and caryophyllene oxide (1.5-14%). In cluster II, which included wild and cultivated samples originating from CA seeds, the major constituents were β-caryophyllene (15-44%), δ-cadinene (6.4-21%) and α-copaene (4.4-14%). The canonical correlation revealed that limonene, γ-cadinene, caryophyllene oxide, Zn, Cu, Fe, Mn, and mean monthly temperature and precipitation values were quite strongly related to SC wild samples (subcluster IB), whereas (Z)-β-ocimene, α-copaene, β-caryophyllene, α-humulene, δ-cadinene, and P were related to CA wild samples as well as to all cultivated samples regardless of seed origin. The chemovariation might be genetically determined. In addition, SC samples showed a clear environmental inluence.
Keywords:Eugenia dysenterica, essential oil, chemical variability, seasonal inluence, canonical correlation analysis
Introduction
Eugenia dysenterica DC. is a shrubby tree with edible cherry-like fruits and it is popularly known in Brazil as ‘cagaiteira’. It is well-known in Brazilian Cerrado medicine and its leaves are part of preparations used for medical diarrhoeic care and dysentery.1 Antimicrobial activities
have been reported concerning Eugenia genus’ essential oils and expressed juice, including dermatophytes,2
antibacterial and systemic fungi such as Paracoccidioides brasiliensis,3,4Cryptococcusneoformans var. neoformans,
and C.neoformans var. gattii isolated from HIV-infected individuals with paracoccidioidomycosis or cryptococcal meningitis.5
creams. Moreover, they are harvested by extractive and predatory methods.6 Studies based on genetic diversity
have shown a complex pattern of genetic variation in the geographic space of E. dysenterica wild populations,7,8
which may be useful for conservation programs or to establish sampling strategies.
Previous investigations regarding E. dysenterica
essential oils have mainly revealed sesquiterpenes in the leaf of this species.5,9 Seasonal inluence on oil chemovariations
has been described in cultivated individuals originated from seeds obtained from two different sites.9 In addition, the
dynamics of terpene variations during fruit ripening has shown that monoterpenes concentration was high up to the semi-ripe stage and afterwards decreased. On the other hand, sesquiterpenes were intensively synthesized later on in the ripening process, whereas ester occurrence was negligible.10 Despite the great potential and the growing
regional market for E. dysenterica fruits, leaf and fruit essential oils are unknown to cosmetic industries in Brazil. Moreover, genetic and environmental inluence on the chemical variability of different wild populations and their cultivated samples has not yet been obtained.
As part of our ongoing work on the characterization of essential oils of medicinal aromatic plants growing wild in central Brazilian cerrado,11 we now report on the results
obtained for the essential oil variability of E. dysenterica, which was collected from two geographically separated wild populations and from adjacently-grown cultivated populations originated from seeds obtained from two natural sites. For this purpose, leaf essential oils were analyzed by GC-MS.
To study chemical variability, chemical constituents were submitted to principal component, cluster, and canonical discriminant analyses. Our aim was to detect the samples’ distribution pattern and to identify which constituents may distinguish between these groups of individuals. In addition, environmental factors affecting essential oil variability were studied via canonical correlation analysis between oil constituent data set and edapho-climatic data matrix, with 19 variables for each sampling site.
Results and Discussion
According to Barazani et al.,12 chemotypic differentiation
may not be concluded from data based solely on wild populations or cultivated plants. Therefore, chemotypic characterization could be established when representatives of two wild, adjacently-grown populations exhibited the same chemical differences as seen in nature. In the present work, E. dysenterica oils were obtained from two wild
populations geographically separated by the Corumbá River basin, which forms two distinct sampling sites in the cities of Senador Canedo (SC) and Campo Alegre de Goiás (CA). Cultivated plants were made up of 12 year-old individuals originating by seed propagation from each indigenous population in a single experimental ield, located 30 and 200 km from natural SC and CA populations, respectively (see map of sampling sites in the Supplementary Information, SI, ile).
The mean oil yield of adjacently-cultivated samples was higher than that of wild plants, but it failed to show statistically signiicant differences in site origin (SC/CA). A total of 29 compounds were identiied, accounting for 90-100% of volatile constituents (Table 1). All essential oils predominantly reveal sesquiterpene hydrocarbon compositions (42-86%), although the monoterpene hydrocarbon content for some SC samples is over 46%. The two-way variance analysis (ANOVA) showed that signiicant differences in the amounts of major constituents were found according to population (wild/cultivated) and site origin (SC/CA), such as γ-cadinene (24) (28%), caryophyllene oxide (27) (8.6%), and δ-cadinene (26) (16%), which had the highest percentage in wild samples from SC and CA, respectively, and α-copaene (9) (9.1-12%) in CA samples, regardless of the populations. Quantitative chemical differences were also obtained only in terms of site origin, such as β-pinene (2) (7.5%), limonene (4) (9.1%), and monoterpene hydrocarbons (31%), which showed the highest percentage in SC samples, whereas α-humulene (14) (14%) and sesquiterpenes hydrocarbons (70%) showed high amounts in CA samples, regardless of the populations. Despite the high percentage of α-pinene (1) (5.6-7.8%), β-caryophyllene (10) (19-23%), and oxygenated sesquiterpenes (5.7-10%), these constituents failed to reveal signiicant differences between populations and/or site origin.
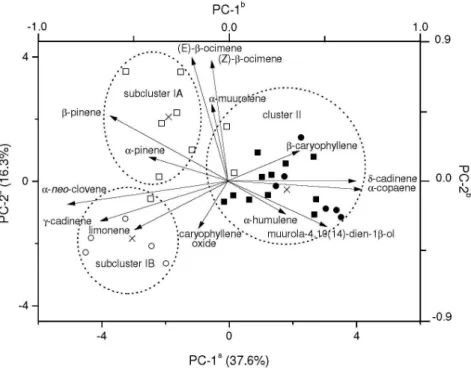
Results obtained from PCA and nearest neighbour complete linkage cluster analysis using Ward’s technique (31 samples × 14 variables = 434 data; see Table 1) revealed high chemical variability within E. dysenterica essential oils (see SI ile). The irst PC accounts for ca.
38% of total variance and distinguishes well above the 99% conidence level rich sesquiterpenes of CA samples from rich monoterpenes of SC samples, regardless of population (wild and cultivated). Moreover, the second PC (16% of total variance) separates wild samples from cultivated samples of SC origin (see PC scatterplot in the SI ile).
Constituent RIb Population Sampling sites Average
SC CA
1 α-Pinenec 933 Wild 7.1 4.5 5.6 A
Cultivated 8.2 7.3 7.7 A
Average 7.8 a 6.3 a
2 β-Pinenec 978 Wild 6.0 3.4 4.6 A
Cultivated 8.3 4.0 5.9 A
Average 7.5 a 3.8 b
3 Myrcenee 989 Wild 2.6 0.80 1.6 A
Cultivated 2.1 0.59 1.3 A Average 2.3 a 0.67 a
4 Limonenec,e 1024 Wild 14 1.3 7.2 A
Cultivated 5.3 1.8 3.8 A
Average 9.1 a 1.7 b 5 (Z)-β-Ocimenec 1028 Wild − 2.4 A
Cultivated 4.6 a 2.3 Aa 6 (E)-β-Ocimenec 1045 Wild − 0.59 A
Cultivated 1.6 a 0.45 Ab
7 Linalool 1095 Wild − 0.49 A
Cultivated 0.52 a 0.29 Ab
8 α-Terpineol 1186 Wild 0.12 0.43 0.29 B
Cultivated 0.44 0.98 0.73 A Average 0.32 b 0.78 a 9 α-Copaenec,d 1374 Wild 0.16 Bb 12 Aa
Cultivated 2.9 Ab 9.1 Aa
10 β-Caryophyllenec 1421 Wild 15 22 19 A
Cultivated 22 22 22 A
Average 20 a 23 a
11 α-Guaiened 1439 Wild − 1.5 A
Cultivated 1.1 a 1.5 Aa 12 6,9-Guaiadienee 1445 Wild 1.0 A −
Cultivated 1.3 Aa 0.27 b 13 α-neo-Clovenec 1451 Wild 3.0 A −
Cultivated 1.8 Aa 0.52 b
14 α-Humulenec 1458 Wild 7.3 15 12 A
Cultivated 8.9 13 11 A
Average 8.3 b 14 a
15 γ-Muurolene 1476 Wild 0.40 0.77 0.60 A
Cultivated 0.42 0.74 0.60 A Average 0.41 b 0.75 a 16
Amorpha-4,7(11)-diene
1481 Wild − −
Cultivated 0.02 −
Constituent RIb Population Sampling sites Average
SC CA
17 α-Amorphene 1487 Wild 0.01 0.42 A
Cultivated 0.54 a 0.52 Aa
18 β-Selinened 1491 Wild − −
Cultivated 2.1 a 3.2 a
19 δ-Selinene 1496 Wild − 0.01 A
Cultivated 1.5 a 3.1 Aa
20 α-Selinene 1502 Wild 0.01 A 0.48
Cultivated 0.56 A 0.65
21 α-Muurolenec,e 1507 Wild − 0.60 A
Cultivated 1.8 0.60 A
22 α-Bulnesene 1516 Wild − 2.0 A
Cultivated 1.3 a 1.9 Aa
23 δ-Amorphene 1511 Wild − −
Cultivated 0.15 − 24γ-Cadinenec,d 1513 Wild 28 Aa 0.51 Ab
Cultivated 11 Ba 0.36 Ab
25 7-epi-α-Selinene 1520 Wild − −
Cultivated 0.87 a 1.6 a 26δ-Cadinenec,e 1524 Wild 1.4 Bb 16 Aa
Cultivated 5.2 Ab 13 Ba 27 Caryophyllene
oxidec,e
1583 Wild 8.6 Aa 4.8 Aa Cultivated 1.9 Bb 4.5 Ba 28 Humulene epoxide IId 1610 Wild 1.3 3.2 2.3 A
Cultivated 0.55 2.9 1.9 A Average 0.87 b 3.0 a 29
Muurola-4,10(14)-dien-1β-olc,e
1630 Wild 0.35 2.3 1.4 A
Cultivated 0.56 1.7 1.2 A Average 0.48 b 1.9 a Monoterpene
hydrocarbons
Wild 30 13 21 A
Cultivated 31 17 23 A
Average 31 a 15 b
Oxygenated monoterpenes
Wild 0.13 0.92 0.56 B
Cultivated 0.95 1.3 1.1 A Average 0.66 b 1.2 a Sesquiterpene
hydrocarbonse
Wild 57 73 66 A
Cultivated 62 69 66 A
Average 61 b 70 a
Oxygenated sesquiterpenes
Wild 10 10 10 A
Cultivated 3.1 9.1 6.4 A
Average 5.7 a 9.5 a Oil yields / (%, wt) Wild 0.25 Ba 0.25 Ba
Cultivated 0.55 Aa 0.49 Aa
aAverage based on original data. bRetention index. cConstituents selected for PCA (see experimental section). dArcsine and erank-transformed in two-way ANOVA analysis
(see experimental section). Percentages followed by the same capital letter in the columns and by the same small letter in the rows did not share signiicant differences at 5% probability by Tukey’s test.
Table 1. Percentagesa of essential oil constituents from wild and cultivated E. dysenterica collected from two sampling sites in central Brazilian cerrado
originating from CA seeds. Although CA samples were clustered regardless of the population (wild or cultivated), SC samples appear to be environmentally determined. The SC samples could be enclosed in subcluster IA (cultivated samples originating from SC seeds), characterized by a high percentage of β-pinene (2) (9.3 ± 2.6%), α-pinene (1) (9.0 ± 2.3%), (Z)-β-ocimene (5) (5.9 ± 2.6%), α-muurolene (14) (2.6 ± 2.3%), and (E)-β-ocimene (6) (2.0 ± 0.9%); and in
A dendrogram showing similarities between samples in terms of Euclidean distances – originated from the cluster analysis via PC scores and percentages of oil constituents in clustered samples – may be seen in the supplementary information ile.
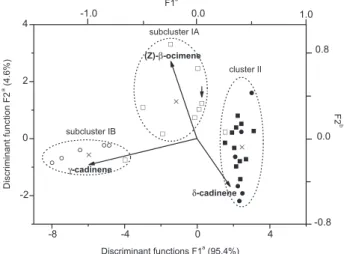
The canonical discriminant analysis (CDA) conirmed this clustering as a priori groupings and an axial system produced by this analysis distinguished well above the 99% conidence level the different types of oils based on the contents of (Z)-β-ocimene (5), γ-cadinene (24), and δ-cadinene (26) as predictor variables (Figure 1). The irst discriminant function (F1) accounts for 95.4% of total variability and separates wild SC samples from CA samples regardless of the populations (F-test value = 28.8; degrees of freedom, DF = 6 and 52) due to the high negative and positive scores of 24 (subcluster IB) and 26 (cluster II), respectively. On the other hand, the second discriminant function (F2) distinguishes cultivated samples originating from SC seeds (F = 7.3; DF = 2 and 27), as a result of high scores of (Z)-β-ocimene (5) (subcluster IA). It was possible to predict accurately 98% of total well-classiication in the original clusters by means of a cross-validation approach.13
The only misclassiication referred to an SC cultivated sample in subcluster IA which had been originally classiied as a CA sample. Such a misclassiication may have been caused by a lower level of δ-cadinene (16) in the sample, which is a feature of cultivated plants from SC seeds.
All these indings may be correlated with factors other than genetic determination (cluster I from cluster II), as
biotic pressures which could modulate the volatiles of SC wild and cultivated samples originating from SC seeds (subclusters IA/IB), such as the inluence of pollinators, pathogens, and herbivores or differences in environmental conditions.14,15 Several studies have reported on the effects
of nutrients on essential oil biosynthesis, which include the inluence of fertilizer applications on the variations of different oil constituents.16 Micronutrient fertilizers (Cu,
Zn, Mn, and Fe) have also shown signiicant effects on oil yields and contents of marjoram, mint, geranium, rosemary, and cumin.15,17,18
Therefore, oil constituent data (set 1) and edapho-climatic factor data (set 2) were jointly analysed via
canonical correlation analysis (CCA), a multivariate treatment that describes correlations between two data sets (Table 2).19 The method makes it possible to assess new
variables called canonical variates (CVs) so that they exhibit the highest correlations that may be found between the two data groups. Similarly to PCA, CVs bear no correlation with each other, whereas eigenvalues are approximately equal to the squares of canonical correlations and relect the variance proportion explained by each canonical correlation relating two variable sets. The correlations of the variables with the CVs – known as canonical loadings or structure correlation coeficients – have been used to explain with which original variables a canonical correlation is mainly associated.
Canonical correlation analysis results (Table 2) showed that the irst axis of oil constituent data (set 1) was highly correlated with the irst axis of edapho-climatic factors (set 2). In fact the irst pair of canonical variates (V1 and W1) was correlated – their canonical correlation coeficient measured 0.9433 – and the variance amount was accounted at 89%. Since the p-value of the irst pair of CVs was lower than 0.05, the data sets were statistically correlated at the 95% conidence level by the multivariate Wilks’ lambda test, and may aid in interpreting the relationship between variables.
In Table 2, which shows the signs and magnitude of structure correlation coeficients, an increase in the value of the irst CV is linked with an increase in δ-cadinene (26), α-copaene (9), β-caryophyllene (10), and (Z)-β-ocimene (5) from the irst set and P from the second set. On the other hand, the increase in the irst CV is also highly associated with a reduction of γ-cadinene (24), limonene (4), and caryophyllene oxide (27) from the irst set, and Zn, Cu, Fe, Mn, and climatic factors – precipitation and temperature – from the second set. Thus, the irst CV shows sesquiterpene variation in leaves in response to environmental pressure.
The correlation analysis regarding populations and soils revealed that γ-cadinene (24), limonene (4), and
Figure 1. Scatterplot of canonical discriminant functions of E. dysenterica wild samples (circle symbols) and adjacently-cultivated individuals (square symbols) from seeds originated from Senador Canedo (SC; unshaded symbols) and Campo Alegre de Goiás (CA; shaded symbols) to which subclusters IA/IB and cluster II it belongs. aAxes refer to
scores from the samples. bAxes refer to loadings from predictor oil
caryophyllene oxide (27) have a strong relationship with micronutrient balance in soils (Zn, Cu, Fe, Mn) and with the hottest and most humid habitats, as well as with SC wild samples (subcluster IB). In addition, δ-cadinene (26), α-copaene (9), β-caryophyllene (10), (Z)-β-ocimene (5), and P are related to the cultivated samples from SC seeds (subcluster IA) and to CA samples regardless of population (cluster II). The canonical correlation plot shows sample scores for each of the two CVs of the irst canonical correlation (Figure 2). When the canonical correlation is high, the points form two clusters at different points on the regression line. In Figure 2, the hottest and most humid site of the SC wild population (subcluster IB) was located to the left of the regression line (negative CV values), whereas cultivated samples from SC seeds (subcluster IA) and CA samples regardless of population (cluster II) were located to the right of positive CV values.
The positive and negative correlation between caryophyllene oxide (27) and β-caryophyllene (10) respectively and metal ions are in agreement with the effects of foliar application of micronutrient fertilizers containing Zn and Mn on cumin oils.18 These micronutrient
effects should be associated with a strict requirement for sesquiterpene synthases for a divalent metal ion as cofactor, which have also inluenced the number of by-products obtained from these reactions.20 The formation of
γ-humulene is promoted by Mn2+ ions whereas the amounts
of all other by-products are reduced. In peppermint, the only by-product (δ-cadinene) produced by (E)-β-farnesene
synthase in the presence of Mg2+ was entirely absent in the
presence of Mn2+ ions.21 Similar negative effects of Mn2+
on δ-cadinene (26) are in agreement with the negative correlation shown in Table 2.
As regards the relationship between P and oil constituents, it has been reported that reduced P availability causes an increased production of different in vitro secondary metabolites under greenhouse conditions.22 In
contrast, terpenoid accumulation was related with high P soil content or when culture media were supplemented
Table 2. Canonical correlation structure (loadings) of oil constituents and edapho-climatic factors with their canonical variates
Discriminant oil Canonical variate Edapho-climatic Canonical variate
constituents (set 1) V1 factors (set 2) W1
4 Limonene −0.6804 Zn / (mg dm−3) −0.9344
5 (Z)-β-Ocimene 0.3448 Cu / (mg dm−3) −0.9393
9 α-Copaene 0.5899 Fe / (mg dm−3) −0.4147
10 β-Caryophyllene 0.3696 Mn / (mg dm−3) −0.7043
14 α-Humulene 0.2484 P / (mg dm−3) 0.7441
24 γ-Cadinene −0.8822 Temperature / (°C) −0.9024
26 δ-Cadinene 0.5933 Precipitation / mm −0.7874
27 Caryophyllene oxide −0.5246
Eingenvalue 0.8899
Canonical correlation 0.9433
Wilks’ lambda 0.0299
Degrees of freedom 56
P-value 0.0317
Cumulative variance / (%):
of discriminant oil constituent data 28.2
of discriminant oil constituents/edapho-climatic relation 56.1
with increased P concentration.23 The observed correlation
should be related at least partially with the collection of wild samples, which occurred in August at the end of the dry season. During this time the peak of leaing activities, senescence, and emission of new leaves occur,24 thus
requiring large amounts of carbon and macronutrients, particularly N and P for proteins and RNA, markedly increased in young leaves with a high capacity for biosynthesized essential oils. Leaf volatiles may provide a constitutive defense – by deterring potential herbivores – or an induced response to herbivore damage by attracting predators or parasites.25
Based on currently available data, the chemical variability of oil composition from SC and CA wild samples may be explained as a result of localized inbreeding effects associated with a low migration gene rate within the populations. The Corumbá River basin separates the wild CA population from the SC site (cluster I from cluster II) through a depression formed by the river and its tributaries. This spatial barrier could contribute at least partially to ecological isolation – a pre-requisite for speciation and chemovariation between the two sampling sites. Thus, the observed chemical polymorphism should be genetically determined rather than environmentally controlled, a fact that has been observed in several plant species.26 The existence of chemotypic differentiation
between the two populations could be conirmed by the fact that cultivated plants grown adjacently in the same environment exhibited the typical composition of their wild populations.12
Furthermore, the inluence of edapho-climatic factors on SC samples – not on CA samples – is strong enough to induce the high chemical variability recorded in the leaf oil of SC wild and cultivated samples originating from SC seeds. It might be speculated that the chemical phenotypic plasticity of SC samples (subclusters IA/IB) could be the result of various evolutive pressures acting as a selection force for a specialized phenotype that is better adapted to local environments (ecotypes).
The population structure based on oil variability is in accordance with the results of genetic structure in
E. dysenterica populations using morphological and isoenzymatic traits,7,27 as well as SSR and RAPD markers.8
Although most of the genetic variance was found within natural populations, there was a highly signiicant quantity among populations, thus indicating a gene low restriction between them. The high correlation coeficient between genetic and geographic distance matrices suggested a spatial pattern of genetic variability among the populations, with decreased gene low as distances increased.8 On the
other hand, the regions’ edaphic features exerted a strong
inluence on the populational phenotypic differentiation as morphological and demographic sample characters.27
Thus, variation patterns in essential oils may relect the existence of a genetic nature in oil composition (SC and CA chemotypes) or stress that chemical variations may be caused by selective pressures in different ecological and geographical environments (SC ecotypes) of E. dysenterica.
Conclusions
Essential oil variability of E. dysenterica determined by GC-MS and by multivariate statistical analysis of wild and adjacently-grown cultivated populations originated from seeds of two sampling sites revealed high polymorphism, which could be inluenced by genetic and edapho-climatic factors.
Experimental
Plant material
E. dysenterica leaves were collected in their natural habitat in August 2006, in the cities of Campo Alegre de Goiás (CA: 17° 36´ 13´´ S, 47° 43´ 13´´ W, 831 m) and Senador Canedo (SC: 16° 37´ 7´´ S, 49° 4´ 26´´ W, 904 m), Goiás State, Brazil; they were identiied by a single author (R. R. N.). With regard to cultivated samples, leaves were collected in July 2006 from 12 years-old individuals originated from seed propagations of the same wild plants. The cultivated individuals were adjacently grown in the form of a randomized block with three replications in a single experimental ield (16° 35´ 39´´ S, 49° 17´ 23´´ W, 716 m) belonging to the School of Agronomy and Food Engineering of Universidade Federal de Goiás, Goiânia, Goiás State, Brazil. The cultivated habitat was located 30 and 200 km from SC and CA natural populations, respectively. Voucher specimens are deposited at the herbarium of Universidade Federal de Goiás (UFG40611 and UFG40612).
of plant samples. All experiments were conducted in duplicates and the results are shown as mean values.
Soil analyses
Soil samples were collected at 0-20 and 20-40 cm depths in each locality. They were subsequently air-dried, thoroughly mixed, and sieved (2 mm). The portion iner than 2 mm was kept for physical and chemical analysis.28
The pH was determined in a 1:1 soil-water volume ratio. Ca, Mg, and Al were extracted with 1 mol L-1 KCl, whereas P,
K, Zn, Cu, Fe, Mn, and Mo were extracted with Mehlich’s solution. Organic matter, cation exchange capacity (CEC), potential acidity (H+Al), base saturation, Al saturation, and soil texture were determined by the usual methods.28
Mean monthly temperature and precipitation values were obtained from climatological stations at UFG (cultivated samples) and Instituto Nacional de Meteorologia – INMET (wild samples). Environmental factor data from these climatological records and the average of the soil analyses of both depths were ordered in an edapho-climatic matrix with 19 variables for each sampling site. The canonical correlation procedure was applied to both data sets concerning essential oil constituents and edapho-climatic features (discriminant edapho-edapho-climatic variables in clustered samples are shown in the supplementary information ile).
In geographical terms, the cultivated ield has a soil loam texture whereas natural habitat mainly reveals a sandy loam texture; both are characterized by acidic and nutritionally impoverished soils and by scleromorphic vegetation. Mean annual rainfall, temperature, and relative humidity values are similar.
Chemical analyses
Oil sample analyses were performed on a GC-MS Shimadzu QP5050A instrument under the following conditions: a CBP-5 (Shimadzu) fused silica capillary column (30 m × 0.25 mm i.d., 0.25 µm ilm thickness) connected to a quadrupole detector operating in EI mode at 70 eV with a scan mass range of 40-400 m/z at a sampling rate of 1.0 scan s−1; carrier gas: He (1 mL min-1); injector and
interface temperatures of 220 °C and 240 °C, respectively, with a split ratio of 1:20. The injection volume was 0.4 µL (ca. 20% in hexane) and the oven temperature was raised from 60 to 246 °C with an increase of 3 °C min-1, then
10 °C min-1 to 270 °C, holding the inal temperature for
5 min. Individual components were identiied by comparing their linear retention indices (RI),29 by co-injection with a
C8-C32n-alkanes series,30 mass spectra with those of the
literature,29 and a computerized MS-database using NIST
libraries.29
Chemical variability
Univariate average multiple comparisons of oil constituent data were established by two-way ANOVA (wild/cultivated populations and SC/CA sites as factors) using SAS GLM analyses (Statistical Analysis System, SAS Institute Inc., Cary, NC, 1996). All data were checked for homoscedasticity with the use of Hartley’s test. This test revealed signiicant deviation from the basic assumption for oil constituents 9, 10, 24, 27-29, monoterpene hydrocarbons, and 3, 4, 12, 26, which were arcsine and rank-transformed, respectively(Table 1). A post-hoc Tukey test was performed whenever a difference was established.
P-values below 0.05 were regarded as signiicant.
In multivariate analyses, each datum was standardized according to zij = (xij– averagej)/(standard deviation)j. Principal component analysis (PCA) was applied to explore the interrelationships between populations and their chemical constituents, via système portable d’analyse des données numériques-SPAD, version 5.5, Centre International de Statistique et d’Informatique Appliquées, France (2001). Cluster analysis was also applied to investigate possible natural groupings among samples characterized by the set of oil constituents. Nearest neighbour complete linkage technique by Benzécri algorithm was used as a similarity index and hierarchical clustering was performed according to Ward’s variance minimizing method.31 As for variable selection, the
threshold of residual eigenvalues (≤ 0.70) in the original data matrix (31 samples × 29 variables) was used to establish the maximum number of variables which could be removed (19 variables).32 The 15 effectively eliminated
variables expressed the highest loadings in the lowest residual eigenvalues and also contributed ≤ 2% to chemical proiles.
Canonical discriminant analysis via SAS CANDISC and SAS DISCRIM procedures was used to differentiate populations and clusters on the basis of oil composition. The predictive ability of canonical discriminant functions was evaluated by leave-one-out cross-validation approach as implemented in SAS.
Supplementary Information
Supplementary data are available free of charge at http://jbcs.sbq.org.br, as a PDF ile.
Acknowledgments
The authors are indebted to CNPq, PADCT III, and FUNAPE/UFG for inancial support; and to CAPES for the fellowship granted to Alessandra R. Duarte.
References
1. Septímio, L. R.; A Fitoterapia Baseada em Ervas Medicinais do Cerrado, Secretaria de Intercâmbio e Projetos Especiais do Ministério da Cultura: Brasília, Brasil, 1994.
2. Lima, E. O.; Gompertz, O. F.; Giesbrecht, A. M.; Paulo, M. Q.; Mycoses 1993, 36, 333; Souza, L. K. H.; Oliveira, C. M. A.; Ferri, P. H.; Santos, S. C.; Oliveira Júnior, J. G.; Miranda, A. T. B.; Lião, L. M.; Silva, M. R. R.; Braz. J. Microbiol.2002, 33, 247.
3. Ogunwande, I. A.; Olawore, N. O.; Ekundayo, O.; Walker, T. M.; Schmidt, J. M.; Setzer, W. N.; Int. J. Aromather.2005, 15, 147. 4. Santos, S. C.; Ferri, P. H.; Ribeiro, J. P.; Guimarães, D. O.;
Silva, M. O.; Garcia, A. C. F.; Pires, J. S.; Castro, A. C. M.; Silva, M. R. R.; Paula, J. R.; Rev. Bras. Pl. Med. 2004, 7, 30; Santos, G. D.; Ferri, P. H.; Santos, S. C.; Bao, S. B.; Soares, C. M. A.; Pereira, M.; Med. Mycol.2007, 45, 609.
5. Costa, T. R.; Fernandes, O. F. L.; Santos, S. C.; Oliveira, C. M. A.; Lião, L. M.; Ferri, P. H.; Paula, J. R.; Ferreira, H. D.; Sales, B. H. N.; Silva, M. R. R.; J. Ethnopharmacol.2000, 72, 111. 6. Almeida, S. P.; Proença, C. E. B.; Sano, S. M.; Ribeiro, J. F.;
Cerrado: Espécies Vegetais Úteis, Embrapa-CPAC: Planaltina, Brasil, 1998.
7. Diniz-Filho, J. A. F.; Telles, M. P.; Conserv. Biol.2002, 16, 924; Telles, M. P. C.; Coelho, A. S. G.; Chaves, L. J.; Diniz-Filho, J. A. F.; Valva, F. D.; Conserv. Gen.2003, 4, 685.
8. Zucchi, M. I.; Pinheiro, J. B.; Chaves, L. J.; Coelho, A. S. G.; Couto, M. A.; Morais, L. K.; Vencovsky, R.; Pesq. Agropec. Bras.2005, 40, 975; Zucchi, M. I.; Brondani, R. P. V.; Pinheiro, J. B.; Chaves, L. J.; Coelho, A. S. G.; Vencovsky, R.; Genet. Mol. Biol.2003, 26, 449.
9. Duarte, A. R.; Naves, R. R.; Santos, S. C.; Seraphin, J. C.; Ferri, P. H.; J. Braz. Chem. Soc.2009, 20, 967.
10. Duarte, A. R.; Costa, A. R. T.; Santos, S. C.; Ferri, P. H.; Paula, J. R.; Naves, R. V.; J. Essent. Oil Res. 2008, 20, 30.
11. Curado, M. A.; Oliveira, C. B. A.; Jesus, J. G.; Santos, S. C.; Seraphin, J. C.; Ferri, P. H.; Phytochemistry2006, 67, 2363; Silva, F. G.; Oliveira, C. B. A.; Pinto, J. E. B. P.; Nascimento, V. E.; Santos, S. C.; Seraphin, J. C.; Ferri, P. H.; J. Braz. Chem. Soc.2007, 18, 990.
12. Barazani, O.; Cohen, Y.; Fait, A.; Diminshtein, S.; Dudai, N.; Ravid, U.; Putievsky, E.; Friedman, J.; Biochem. Syst. Ecol.
2002, 30, 721.
13. Wold, A.; Eriksson, L. In Chemometric Methods in Molecular Design, vol. 2; Waterbeemd, H., ed.; VCH: Weinheim, 1995. 14. Sturgeon, K. B.; Evolution1979, 33, 803; Langenheim, J. H.;
J. Chem. Ecol.1994, 20, 1223; Figueiredo, A. C.; Barroso, J. G.; Pedro, L. G.; Scheffer, J. J. C. In Essential Oils: Basic and Applied Research; Franz, C.; Mathe, A.; Buchbauer, G., eds.; Allured: Illinois, 1997.
15. Robles, C.; Garzino, S.; Phytochemistry 2000, 53, 71. 16. Martins, F. T.; Santos, M. H.; Polo, M.; Barbosa, L. C. A.; Quim.
Nova2006, 29, 1203.
17. Tarraf, S.; El-Sayed, A. A.; Ibrahim, M. E.; Egypt J. Physiol. Sci.1994, 18, 201; Srivastava, R. K.; Singh, A. K.; Kalra, A.; Tomar, V. K. S.; Bansal, R. P.; Patra, D. D.; Chand, S.; Naqvi, A. A.; Sharma, S.; Kumar, S.; Ind. Crop Prod.2002, 15, 189. 18. El-Sawi, S. A.; Mohamed, M. A.; Food Chem.2002, 77, 75. 19. Saporta, G.; Probabilités. Analyse des Données et Statistique,
Technip: Paris, 1990; Meuzelaar, H. L. C.; Statheropoulos, M.; Huai, H.; Yun, Y. In Computer Enhanced Analytical Spectroscopy, vol. 3; Jurs, P. C., ed.; Plenum Press: New York, 1992.
20. Picaud, S.; Olofsson, L.; Brodelius, M.; Brodelius, P. E.; Arch. Biochem. Biophys. 2005, 436, 215.
21. Crock, J.; Wildung, M.; Croteau, R.; Proc. Natl. Acad. Sci. U. S. A.1997, 94, 12833.
22. Vazquez-Flota, F.; Moreno-Valenzuela, O.; Miranda-Ham, M. L.; Coello-Coello, J.; Plant Cell Tissue Organ Cult.1994, 38, 273; Chishaki, N.; Horiguchi, T.; Soil Sci. Plant Nutr.1997, 73, 987; Roca-Pérez, L.; Pérez-Bermúdez, P.; Gavidia, I.; Boluda, R.; J. Plant Nutr. Soil Sci.2005, 168, 774;
23. Kosinski, I.; Pol. Ecol. Stud.1996, 22, 17.
24. Sano, S. M.; Fonseca, C. E. L.; Ribeiro, J. F.; Oga, F. M.; Luiz, A. J. B.; Pesq. Agropec. Bras.1995, 30, 5.
25. Dicke, M.; Hilker, M.;Bas. Appl. Ecol.2003, 4, 3; Jurgens, A.; Feldhaar, H.; Feldmeyer, B.; Fiala, B.; Biochem. Syst. Ecol.
2006, 34, 97.
26. Hay, R. K. M.; Waterman, P. G.; Volatile Oil Crops: their Biology, Biochemistry and Production, Longman Scientiic and Technical: Harlow, 1993; Echeverrigaray, S.; Fracaro, F.; Santos, A. C. A.; Paroul, N.; Wasum, R.; Seraini, L. A.; Biochem. Syst. Ecol.2003, 31, 467.
27. Trindade, M. G.; Chaves, L. J.; Genet. Mol. Biol.2005, 28, 407. 28. Silva, S. C.; Manual de Análises Químicas de Solos, Plantas e
Fertilizantes, 1a ed., Embrapa: Brasília, Brasil, 1999. 29. Adams, R. P.; Identiication of Essential Oil Components by
30. Van Den Dool, H.; Kratz, P. D.; J. Chromatogr., A1963, 11, 463.
31. Benzécri, J. P.; L´Analyse des Données: la Taxinomie, Tome 1, 3rd ed., Dunod: Paris, 1980; Ward, J. H.; J. Am. Stat. Assoc.
1963, 58, 238.
32. Mardia, K. V.; Kent, J. T.; Bibby, J. M.; Multivariate Analysis, Academic Press: London, 1980.
Su
pp
le
m
enta
ry
Inf
or
m
ati
on
*e-mail: [email protected]
Genetic and Environmental Inluence on Essential Oil Composition
of
Eugenia dysenterica
Alessandra R. Duarte,a Ronaldo R. Naves,b Suzana C. Santos,a
José C. Seraphinc and Pedro H. Ferri*,a
aInstituto de Química, bEscola de Agronomia e de Engenharia de Alimentos and cInstituto de
Matemática e Estatística, Universidade Federal de Goiás, CP 131, 74001-970 Goiânia-GO, Brazil
aAverage based on original data ± standard deviation. bRank- and carcsine-transformed in ANOVA analysis. t: trace. IA (n = 6): only cultivated samples from
SC seed origin; IB (n = 6): majority wild samples from SC origin; II (n = 19): all samples from CA origin regardless of population (see text). Percentages followed by the same letter in a row did not share signiicant differences at 5% probability by Tukey’s test.
Table S1. Percentagesa of essential oil constituents in E. dysenterica clustered samples from wild and adjacently-cultivated individuals from seeds originated
from Senador Canedo (SC) and Campo Alegre de Goiás (CA) to which subclusters IA/IB and cluster II it belongs
Constituent Clusters
IA IB II
1 α-Pinene 9.0 ± 2.5 a 6.6 ± 3.6 a 6.4 ± 3.3 a
2 β-Pinene 9.3 ± 2.8 a 5.9 ± 3.8 ab 4.1 ± 2.3 b
3 Myrceneb 1.0 ± 0.5 a 3.8 ± 4.4 a 0.74 ± 0.58 a
4 Limoneneb 7.8 ± 5.9 a 12 ± 10 a 1.9 ± 1.5 c
5 (Z)-β-Ocimene 5.9 ± 4.5 a t 2.4 ± 3.2 b
6 (E)-β-Ocimene 1.9 ± 1.1 a 0.05 ± 0.10 0.57 ± 0.65 b
7 Linalool 0.50 ± 0.15 a 0.04 ± 0.06 a 0.40 ± 0.31 a
8 α-Terpineol 0.27 ± 0.24 ab 0.16 ± 0.24 b 0.80 ± 0.55 a
9 α-Copaenec 2.3 ± 1.3 b 0.44 ± 0.75 c 9.6 ± 3.3 a
10 β-Caryophyllene 18 ± 7 a 16 ± 7 a 24 ± 8 a
11 α-Guaieneb 0.40 ± 0.43 a 0.51 ± 1.2 a 1.6 ± 2.6 a
12 6,9-Guaiadieneb 1.6 ± 1.0 a 1.1 ± 0.3 a 0.18 ± 0.38 b
13 α-neo-Clovene 1.9 ± 0.8 b 3.1 ± 0.7 a 0.36 ± 0.49 c
14 α-Humulene 11 ± 5 a 7.3 ± 8.9 a 13 ± 7 a
15 γ-Muurolene 0.47 ± 0.29 a 0.40 ± 0.34 a 0.70 ± 0.40 a
16 α-Amorphene 0.03 ± 0.05 t t
17 β-Selinenec 0.75 ± 1.2 a 0.15 ± 0.33 a 0.46 ± 0.74 a
18 δ-Selineneb 2.1 ± 2.7 a 0.19 ± 0.43 a 2.1 ± 4.4 a
Constituent Clusters
IA IB II
19 α-Selinene 0.63 ± 1.1 a t 0.59 ± 0.85 a
20 Bicyclogermacrene 0.53 ± 0.20 a 0.54 ± 0.61 a 0.04 ± 0.14
21 α-Muuroleneb 2.6 ± 2.6 a 0.06 ± 0.13 a 0.55 ± 0.35 a
22 α-Bulneseneb 0.18 ± 0.19 a 0.79 ± 1.9 a 2.1 ± 3.4 a
23 δ-Amorphene 0.13 ± 0.13 a 0.10 ± 0.23 a t
24 γ-Cadinene 11 ± 5 b 27 ± 5 a 0.81 ± 1.6 c
25 7-epi-α-Selinene 0.87 ± 1.4 a t 1.1 ± 2.3 a
26 δ-Cadinenec 4.4 ± 1.9 b 2.1 ± 1.7 b 13 ± 5 a
27 Caryophyllene oxide 1.6 ± 0.7 b 7.4 ± 5.1 a 4.5 ± 3.2 b
28 Humulene epoxide IIc 0.82 ± 0.42 a 1.2 ± 1.8 a 2.7 ± 2.0 a
29 Muurola-4,10(14)-dien-1β-olc
0.52 ± 0.62 b 0.30 ± 0.47 b 1.8 ± 1.2 a
Monoterpene hydrocarbons
35 ± 8 a 29 ± 11 a 16 ± 6 b
Oxygenated monoterpenes
0.78 ± 0.28 a 0.19 ± 0.27 b 1.2 ± 0.6 a
Sesquiterpene hydrocarbons
59 ± 8 b 60 ± 11 b 70 ± 7 a
Oxygenated sesquiterpenesc
Table S2. Soil minerals and climatic dataa in sampling sites of E. dysenterica clustered samples from wild and adjacently-cultivated individuals from seeds
originated from Senador Canedo (SC) and Campo Alegre de Goiás (CA) to which subclusters IA/IB and cluster II it belongs
Edapho-climatic variable Clusters
IA IB II
P / (mg dm−3) 2.2 ± 0.0 1.4 ± 0.4 b 2.0 ± 0.3 a
Znb / (mg dm−3) 1.4 ± 0.0 4.5 ± 1.5 a 1.8 ± 0.7 b
Cub / (mg dm−3) 1.4 ± 0.0 3.4 ± 1.0 a 1.6 ± 0.4 b
Fe / (mg dm−3) 34.8 ± 0.0 47.3 ± 6.1 a 41.8 ± 10.6 a
Mn / (mg dm−3) 8.3 ± 0.0 14.0 ± 2.8 a 10.1 ± 2.7 b
Temperatureb / (°C) 19.3 ± 0.0 24.6 ± 2.6 a 20.2 ± 1.3 b
Precipitation / mm 0.0 ± 0.0 12.5 ± 6.1 a 3.2 ± 4.8 b
aAverage based on original data ± standard deviation. bRank-transformed in ANOVA analysis. IA (n = 6): only cultivated samples from SC seed origin;
IB (n = 6): majority wild samples from SC origin; II (n = 19): all samples from CA origin regardless of population (see text). Percentages followed by the same letter in a row did not share signiicant differences at 5% probability by Tukey’s test.
Figure S1. Map of Goiás State in central Brazilian Cerrado, showing the locations of E. dysenterica sampling sites: Senador Canedo (SC) and Campo
Figure S3. Dendrogram representing chemical composition similarity relationships among 31 E. dysenterica samples to which cluster it belongs: I, Senador Canedo (unshaded symbols); II, Campo Alegre de Goiás (shaded symbols), collected from wild (circle symbols) and adjacently-cultivated (square symbols) populations.
Figure S2. Principal component scatterplot of E. dysenterica wild samples (circle symbols) and adjacently-cultivated individuals (square symbols) from
seeds originated from Senador Canedo (SC; unshaded symbols) and Campo Alegre de Goiás (CA; shaded symbols) to which subclusters IA/IB and cluster II it belongs. aAxes refer to scores from samples. bAxes refer to loadings from oil constituents represented as long arrows from origin. Crosses represent
Figure S5. Mass spectrum of α-pinene (1).
Figure S6. Mass spectrum of β-pinene (2).
Figure S7. Mass spectrum of limonene (4).
Figure S9. Mass spectrum of α-copaene (9).
Figure S10. Mass spectrum of β-caryophyllene (10).
Figure S11. Mass spectrum of α-humulene (14).
Figure S13. Mass spectrum of δ-cadinene (26).