Article
0103 - 5053 $6.00+0.00*e-mail: [email protected]
Seasonal Influence on the Essential Oil Variability of Eugenia dysenterica
Alessandra R. Duarte,a Ronaldo R. Naves,b Suzana C. Santos,a José C. Seraphinc and Pedro H. Ferri*,a
aLaboratório de Bioatividade Molecular, Instituto de Química, Universidade Federal de Goiás,
CP 131, 74001-970 Goiânia-GO, Brazil
bSetor de Horticultura, Escola de Agronomia e de Engenharia de Alimentos, Universidade Federal de Goiás,
CP 131, 74001-970 Goiânia-GO, Brazil
cNúcleo de Estatística Aplicada, Instituto de Matemática e Estatística, Universidade Federal de Goiás,
CP131, 74001-970 Goiânia-GO, Brazil
A composição química dos óleos essenciais em populações cultivadas de Eugenia dysenterica, originadas de sementes obtidas de dois diferentes sítios de amostragem, e coletadas durante o verão e o inverno, indicou a presença de dois tipos de óleos, de acordo com a origem das sementes e da estação do ano. O grupo I incluiu somente as amostras oriundas de sementes de Senador Canedo (SC), sejam as coletadas no inverno (subgrupo IA) e caracterizadas pela percentagem elevada de β-pineno (6,6-14%), α-pineno (5,9-13%) e (Z)-β-ocimeno (0-13%), ou aquelas amostras coletadas principalmente no verão (subgrupo IB) e caracterizadas pela percentagem elevada de γ-cadineno (0-33%), limoneno (1,2-28%) e β-pineno (3,2-23%). O grupo II incluiu todas as amostras cultivadas a partir de sementes originadas de Campo Alegre de Goiás (CA), independentemente da estação do ano, cujos constituintes majoritários foram β-cariofileno (15-74%), δ-cadineno (0-24%) e α-copaeno (0-14%). A correlação canônica entre as populações e as estações do ano revelou que α-pineno, (Z)-β-ocimeno, (E)-β-ocimeno e γ-cadineno apresentaram uma forte correlação com o inverno frio e seco (subgrupo IA), enquanto β-cariofileno, temperatura e precipitação médias mensais foram relacionados às amostras originadas de sementes de CA coletadas durante o verão quente e úmido (grupo II). Os hidrocarbonetos sesquiterpênicos predominaram em todas as populações analisadas e a variação química nos óleos essenciais parece ser determinada geneticamente pela origem da semente, em adição a uma nítida influência sazonal somente sobre aquelas provenientes de SC.
The chemical composition of the essential oils of cultivated Eugenia dysenterica populations, which originated from seeds obtained from two different sites and harvested during summer and winter, have indicated the presence of two oil clusters related to seed origin and season. Cluster I included only samples which originated from seeds from Senador Canedo (SC) collected during winter (subcluster IA) and with high percentages of β-pinene (6.6-14%), α-pinene (5.9-13%), and (Z)-β-ocimene (0-13%), or samples collected mainly in the summer (subcluster IB) and characterized by high contents of γ-cadinene (0-33%), limonene (1.2-28%), and β-pinene (3.2-23%). Cluster II included all the samples cultivated from seeds originating from Campo Alegre de Goiás (CA) regardless of the season, which were characterized by high amounts of β-caryophyllene (15-74%), δ-cadinene (0-24%), and α-copaene (0-14%). The canonical correlation between populations and seasons revealed that α-pinene, (Z)-β-ocimene, (E)-β-ocimene, and γ-cadinene present a strong correlation with the cold and dry winter (subcluster IA), whereas β-caryophyllene, temperature, and precipitation were related to samples from CA seed origin during the hot and humid summer (cluster II). Sesquiterpene hydrocarbons predominated in all the sampled populations and the observed essential oil chemovariation might be genetically determined by seed origin, in addition to a clear seasonal influence shown only in the samples from SC seeds.
Introduction
Eugenia genus is distributed throughout all Brazilian regions and consists of about 500 species of trees and shrubs with aromatic foliage and some edible cherry-like fruits.1 In the Brazilian Cerrado, E.dysenterica DC. (syn.
Stenocalyx dysentericus Berg., Myrtus dysenterica M.) grows wild or is cultivated because of its appreciated fruits which are consumed in natura or processed to produce different kinds of jams and ice creams, although they are used only in an extractive and predatory manner.2 Their
leaves are well-known within Brazilian Cerrado medicine as part of preparations used for medical diarrhoeic care and dysentery.3 Antimicrobial activities have been reported for
the essential oils and pressed juice of the Eugenia genus, including dermatophytes,4 antibacterial,5 and systemic
fungi.6,7
Various studies concerning the genetic diversity of E.
dysenterica wild populations have shown a complex pattern of genetic variation in the geographical space which can be used for the germplasm conservation of this species in
ex situ and in situ conditions.8,9
Previous chemical investigations have been restricted to essential oils from leaves and to the dynamics of terpene variations during the fruit ripening period of this species.6,10
Despite the great potential and the growing regional market for E. dysenterica, seasonal variation in the essential oil composition has not yet been reported.
We now report on the results obtained for the composition and seasonal variability of the leaf essential oil of E.
dysenterica that was collected from cultivated populations originating from seeds obtained from two different sites in the Central Brazilian Cerrado. For this purpose, essential oils from leaves of representative population samples of each seed origin during different seasons were analyzed by GC-MS. In order to study chemical variability, chemical constituents were submitted to multivariate chemometric analyses such as principal component (PCA) and cluster and canonical discriminant (CDA) in order to detect the distribution pattern of samples and to identify which chemical constituents are able to distinguish between these groups of individuals. In addition, seasonal factors affecting essential oil variability between the oil constituent data set and the climactic data matrix for each season were analyzed by canonical correlation analysis.
Results and Discussion
In the present work, E. dysenterica leaf oils were obtained from cultivated plants originating from seeds obtained from two native populations that were geographically separated
by the Corumbá River basin, which forms two spatially discontinuous sampling sites in the cities of Senador Canedo (SC) and Campo Alegre de Goiás (CA). The cultivated plants were made up of 12-year-old individuals obtained by seed propagation from indigenous populations in an experimental field located 30 and 200 km from the natural SC and CA populations, respectively.
Unlike other studies in the literature which state that plants exhibit remarkable fluctuation in oil contents with the progress of seasons,11,12 the mean oil yields failed to
show statistically significant differences in relation to seed origin and season. On the other hand, the chemical composition of E. dysenterica oils differed considerably with regard to the seasons (Table 1). With the exception of humidity (p < 0.163), all climatic variables varied significantly (p < 0.0001) as seasons changed. In total, 29 compounds were identified, accounting for 78%-100% of volatile constituents. All essential oils predominantly reveal sesquiterpene hydrocarbon compositions (58%-78%) even though the monoterpene hydrocarbon content for some samples originating from SC seeds is over 59%. These results are in accordance with those obtained by Costa et al.,6 who reported sesquiterpene
hydrocarbons as major constituents.
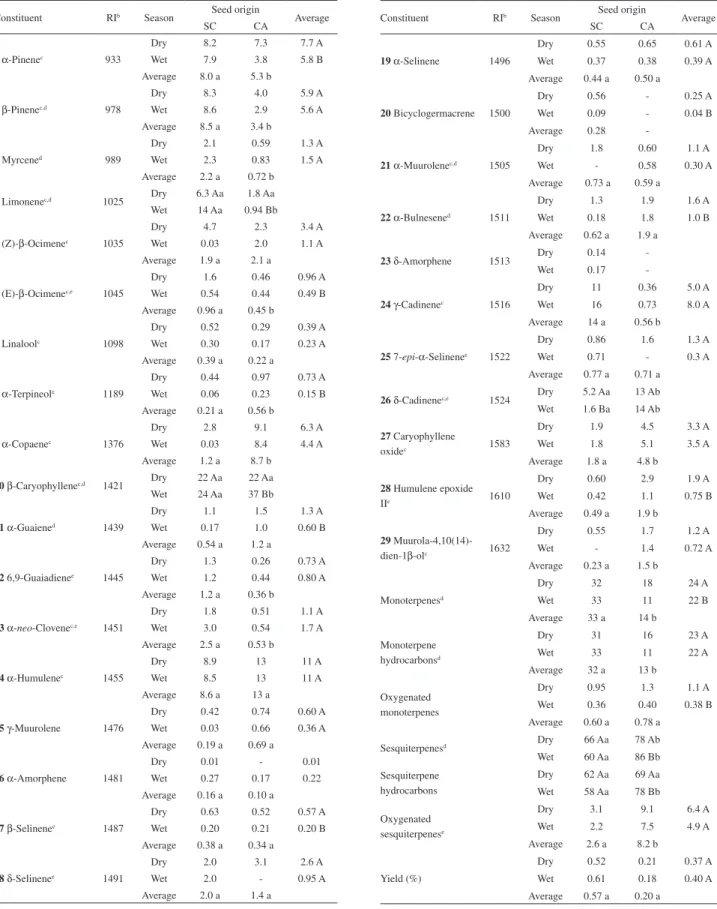
Table 1. Percentagesa (%) of essential oil constituents from cultivated E. dysenterica from seeds from two different sites and collected during dry and wet
seasons in the Brazilian Cerrado
Constituent RIb Season Seed origin Average
SC CA
1 α-Pinenec 933
Dry 8.2 7.3 7.7 A
Wet 7.9 3.8 5.8 B
Average 8.0 a 5.3 b
2 β-Pinenec,d 978
Dry 8.3 4.0 5.9 A
Wet 8.6 2.9 5.6 A
Average 8.5 a 3.4 b
3 Myrcened 989
Dry 2.1 0.59 1.3 A
Wet 2.3 0.83 1.5 A
Average 2.2 a 0.72 b
4 Limonenec,d 1025 Dry 6.3 Aa 1.8 Aa Wet 14 Aa 0.94 Bb
5 (Z)-β-Ocimenec 1035
Dry 4.7 2.3 3.4 A
Wet 0.03 2.0 1.1 A
Average 1.9 a 2.1 a
6 (E)-β-Ocimenec,e 1045
Dry 1.6 0.46 0.96 A Wet 0.54 0.44 0.49 B Average 0.96 a 0.45 b
7 Linaloolc 1098
Dry 0.52 0.29 0.39 A Wet 0.30 0.17 0.23 A Average 0.39 a 0.22 a
8 α-Terpineole 1189
Dry 0.44 0.97 0.73 A Wet 0.06 0.23 0.15 B Average 0.21 a 0.56 b
9 α-Copaenec 1376
Dry 2.8 9.1 6.3 A
Wet 0.03 8.4 4.4 A
Average 1.2 a 8.7 b
10 β-Caryophyllenec,d 1421 Dry 22 Aa 22 Aa Wet 24 Aa 37 Bb
11 α-Guaiened 1439
Dry 1.1 1.5 1.3 A
Wet 0.17 1.0 0.60 B Average 0.54 a 1.2 a
12 6,9-Guaiadienee 1445
Dry 1.3 0.26 0.73 A Wet 1.2 0.44 0.80 A Average 1.2 a 0.36 b
13 α-neo-Clovenec,e 1451
Dry 1.8 0.51 1.1 A
Wet 3.0 0.54 1.7 A
Average 2.5 a 0.53 b
14 α-Humulenec 1455
Dry 8.9 13 11 A
Wet 8.5 13 11 A
Average 8.6 a 13 a
15 γ-Muurolene 1476
Dry 0.42 0.74 0.60 A Wet 0.03 0.66 0.36 A Average 0.19 a 0.69 a
16 α-Amorphene 1481
Dry 0.01 - 0.01
Wet 0.27 0.17 0.22
Average 0.16 a 0.10 a
17 β-Selinenee 1487
Dry 0.63 0.52 0.57 A Wet 0.20 0.21 0.20 B Average 0.38 a 0.34 a
18 δ-Selinenee 1491
Dry 2.0 3.1 2.6 A
Wet 2.0 - 0.95 A
Average 2.0 a 1.4 a
Constituent RIb Season Seed origin Average
SC CA
19 α-Selinene 1496
Dry 0.55 0.65 0.61 A Wet 0.37 0.38 0.39 A Average 0.44 a 0.50 a
20 Bicyclogermacrene 1500
Dry 0.56 - 0.25 A
Wet 0.09 - 0.04 B
Average 0.28
-21 α-Muurolenec,d 1505
Dry 1.8 0.60 1.1 A
Wet - 0.58 0.30 A
Average 0.73 a 0.59 a
22 α-Bulnesened 1511
Dry 1.3 1.9 1.6 A
Wet 0.18 1.8 1.0 B
Average 0.62 a 1.9 a
23 δ-Amorphene 1513 Dry 0.14
-Wet 0.17
-24 γ-Cadinenec 1516
Dry 11 0.36 5.0 A
Wet 16 0.73 8.0 A
Average 14 a 0.56 b
25 7-epi-α-Selinenee 1522
Dry 0.86 1.6 1.3 A
Wet 0.71 - 0.3 A
Average 0.77 a 0.71 a
26 δ-Cadinenec,e 1524 Dry 5.2 Aa 13 Ab Wet 1.6 Ba 14 Ab
27 Caryophyllene
oxidec 1583
Dry 1.9 4.5 3.3 A
Wet 1.8 5.1 3.5 A
Average 1.8 a 4.8 b
28 Humulene epoxide
IIe 1610
Dry 0.60 2.9 1.9 A
Wet 0.42 1.1 0.75 B Average 0.49 a 1.9 b
29 Muurola-4,10(14)-dien-1β-olc 1632
Dry 0.55 1.7 1.2 A
Wet - 1.4 0.72 A
Average 0.23 a 1.5 b Monoterpenesd
Dry 32 18 24 A
Wet 33 11 22 B
Average 33 a 14 b Monoterpene
hydrocarbonsd
Dry 31 16 23 A
Wet 33 11 22 A
Average 32 a 13 b Oxygenated
monoterpenes
Dry 0.95 1.3 1.1 A
Wet 0.36 0.40 0.38 B Average 0.60 a 0.78 a
Sesquiterpenesd Dry 66 Aa 78 Ab
Wet 60 Aa 86 Bb Sesquiterpene
hydrocarbons
Dry 62 Aa 69 Aa Wet 58 Aa 78 Bb Oxygenated
sesquiterpenese
Dry 3.1 9.1 6.4 A
Wet 2.2 7.5 4.9 A
Average 2.6 a 8.2 b Yield (%)
Dry 0.52 0.21 0.37 A Wet 0.61 0.18 0.40 A Average 0.57 a 0.20 a
oxide (27) (4.8%), and oxygenated sesquiterpene (8.2%) revealed high amounts in samples from CA seed origin, regardless of the season. Despite the high percentage of
α-humulene (14) (8.6-13%), this constituent did not reveal any significant differences between samples from seeds obtained from two different sites and/or season.
Similar relative amounts of such major constituents are reported for clove terpenes from E. caryophyllata Thunb.13
Amounts of β-caryophyllene (10) and β-caryophyllene oxide (27) over 20% were reported for essential oils of leaves of E. involucrate DC., E. plicato-costata O. Berg., and E. schuechiana O. Berg.,14 whereas large amounts of α-pinene (1), α-copaene (9), β-caryophyllene (10), and
α-humulene (14) have been described in leaf oils of E.
zuchowskiae Barrie.15 On the other hand, smaller relative
amounts of these compounds were reported in essential oils from leaves of E. tinguyensis Camb., E. rostrifolia Legr.,14E.
caryophyllata and for different chemotypes of E. uniflora L.,16
and E. Austin-smithii Standl., E. cartagensis O. Berg., E. haberi Barrie, and E. monteverdensis Barrie.15
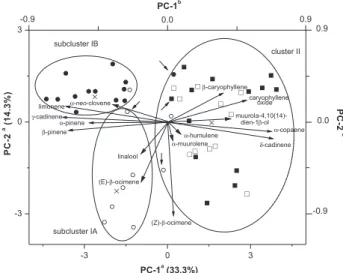
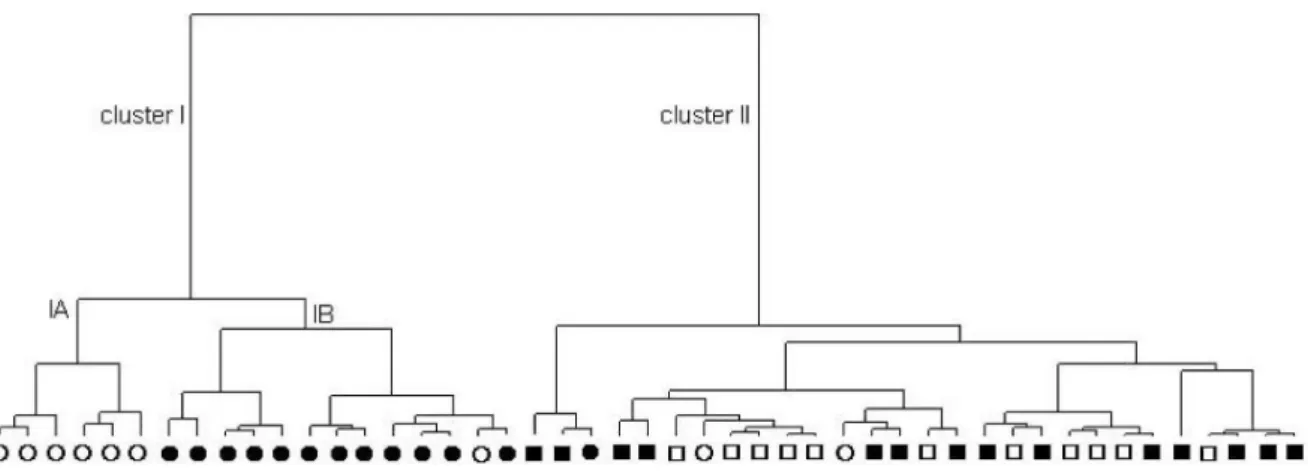
The results obtained from PCA (47 samples × 15 variables = 705 data; see Table 1) and nearest neighbour complete linkage cluster analysis using Ward’s technique from PC scores revealed a high chemical variability within the essential oils of E. dysenterica. The first PC accounts for ca. 33% of total variance and separates (p < 0.0001) samples originating from CA seeds (with significant amounts of sesquiterpenes) from samples originating from SC seeds (with significant amounts of monoterpenes), whereas the second PC (14% of total variance) distinguishes (p < 0.0001) samples from SC seed origin harvested in the dry season from those of the wet season (Figure 1).
Therefore, two main types of essential oils were found according to seed origin: cluster I included samples originating from SC seeds and cluster II included all samples from CA seed origin. This chemovariation in accordance with seed origin appears to be genetically determined because the variations of the volatile compounds found in the original population were also found in the samples analyzed in this work.10 Although samples originating
from CA seeds were clustered regardless of the season, samples from SC seed origin appear to be environmentally determined. Here, the SC samples could be enclosed in subcluster IA (SC-dry season samples), characterized by a significantly (p < 0.01) high percentage of β-pinene (2) (9.3 ± 2.6%), α-pinene (1) (9.0 ± 2.3%), (Z)-β-ocimene (5) (5.9 ± 4.2%), α-muurolene (21) (2.6 ± 2.4%), and (E)-β-ocimene (6) (1.9 ± 1.0%); and in subcluster IB (mainly SC-wet season samples) with γ-cadinene (24) (17 ± 11%), limonene (4) (14 ± 9%), β-pinene (2) (8.6 ± 5.4%), and α-neo-clovene (13) (3.2 ± 2.1%) as principal
constituents (p < 0.001). On the other hand, cluster II included samples originating from CA seeds regardless of the season, which contained significant (p < 0.002) amounts of β-caryophyllene (10) (32 ± 15%), δ-cadinene (26) (13 ± 6%), α-copaene (9) (8.1 ± 4.0%), caryophyllene oxide (27) (4.8 ± 4.4%), and muurola-4,10(14)-dien-1β-ol (29) (1.4 ± 1.2%). Percentages of oil constituents in clustered samples are shown in a supplementary information file. Figure 2 shows the similarities between individuals in terms of Euclidean distances which originated from the Cluster analysis using PC scores.
The hierarchical structure was also considered when the constituent data were coded as independent single character such as presence/absence of terpenes (47 samples × 15 variables/30 modalities), according to a recommendation by Sneath and Sokal.17 Although presence/
absence appears to be better suited for the analysis of differences among species,18 this approach allows one
to assimilate the overall trend in volatile leaf oils and to reduce the uncontrolled factors affecting quantitative variations. Multiple correspondence analyses revealed the same consistent chemical distinction between seasons and sampled populations (data not shown).
The canonical discriminant analysis (CDA) confirmed this clustering as an a priori grouping. The two-dimensional axial system that originated from the CDA distinguished the different types of oils based on the contents of (Z)-β-ocimene (5), γ-cadinene (24), and δ-cadinene (26) as Figure 1. Principal component scatterplot of E. dysenterica cultivated samples originating from seeds from Senador Canedo (SC; circle symbols) and Campo Alegre de Goiás (CA; square symbols); samples collected during dry (unshaded symbols) and wet (shaded symbols) seasons to which subclusters IA/IB and cluster II it belong. aAxes refer
to scores from the samples. bAxes refer to loadings from oil discriminant
predictor variables. The first discriminant function accounts for 87% of total variability and distinguishes samples originating from SC seeds harvested in the wet season (subcluster IB) and samples from CA seed origin (cluster II) regardless of the season (F = 18.5; DF = 6 and 84;
p < 0.0001) due to the high negative and positive scores of
γ-cadinene (24) and δ-cadinene (26), respectively. On the other hand, the second discriminant function distinguishes the population originating from SC seeds harvested in the dry season (F = 9.1; DF = 2 and 43; p < 0.0005) as a result of high positive scores of (Z)-β-ocimene (5) (subcluster IA). In addition, by using the two discriminant functions it is possible to classify correctly 87% of the samples in the original clusters (four misclassifications) by means of a Jackknife approach.19 This involves a number of slightly
reduced modifications to the parent data set, estimating parameters from each of these modified data sets and then calculating the accuracy of the predictions by each of the resulting models. The only original mismatched classification was a sample originating from a CA seed (cluster II) which had been classified as belonging to subcluster IB. Such misclassification could be caused by a lower level of 26 in the sample, which is a feature of plants originating from SC seeds. Two other misclassifications consisted of samples originally clustered as CA (cluster II), although pertaining to the SC (cluster I), in addition to one sample of subcluster IA which was reclassified in subcluster IB.
The observed chemovariations may be correlated with the genetic factor of samples originating from SC and CA seeds (cluster I from cluster II) as well as biotic pressures which could modulate the volatiles of samples cultivated from SC seeds (subclusters IA/IB), such as the influence of pollinators and herbivores or differences in environmental/ seasonal conditions.20 In the present work the harvest of
winter sample occurred in July, at the end of the dry season, simultaneously to the emission of new leaves and the peak of leafing activities,21 with a high capacity for biosynthesized
essential oils. Seasonal variations in monoterpene emission rates from Salvia fruticosa Mill have been described and the high emission during spring months was attributed to a self-protection mechanism of the plant’s defense from an increase in insect activity.22 Other variations include an
induced response to herbivore damage in order to recruit predators or herbivore parasites.23
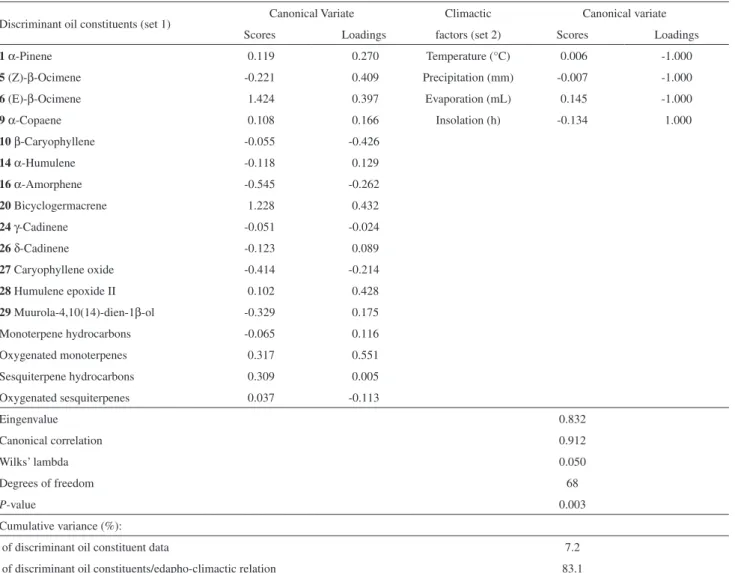
In fact, the canonical correlation analysis (Table 2) between populations and climactic factors revealed that
α-pinene (1), (Z)-β-ocimene (5), (E)-β-ocimene (6), bicyclogermacrene (20), humulene epoxide II (28), and oxygenated monoterpenes present a strong relationship with the coldest and driest habitat and are related to winter (subcluster IA). In addition, β-caryophyllene (10),
α-amorphene (16), and caryophyllene oxide (27) from the first set and temperature, precipitation, and evaporation from the second set load fairly strongly onto the first canonical variate which is related to the samples originating from CA seeds during the hot and humid summer (cluster II).
These results are in agreement with the findings of a recent study in which the chemical composition of E.
dysenterica leaf oil from SC and CA wild populations varied considerably.10 Other studies have also revealed
that contents of the majority of volatile chemical constituents varied significantly in different seasons, such as basil,12 rosemary,24Lavandula,25 mint,26 and coniferous
species.27
The observed population structure based on oil variability is in accordance with the results of spatial patterns of genetic variability among E. dysenterica
populations using morphological and isoenzimatic traits,8,28
amplified polymorphic DNA (RAPD) markers.9,29 The
genetic structure probably originated from a stochastic differentiation process with higher levels of gene flow among closer populations and decreased flow as distances increased,29 such as the stepping-stone model.30 On the
other hand, environmental characteristics among regions exercised a strong influence on population phenotypic differentiation, such as morphological and demographic characters of samples.28
Conclusions
The essential oil variability of E. dysenterica determined by GC-MS and allied to multivariate chemometric statistical techniques may reflect a genetic nature in oil composition (SC and CA chemotypes) and indicate that the observed chemical variations may also be caused by selective pressures in the different seasons for samples cultivated from SC seeds (ecotypes).
Experimental
Plant material
Leaves of cultivated E. dysenterica were collected in July 2006 (dry season) and April 2007 (wet season) from 12-year-old individuals. Leaf samples were obtained from different trees grown from the seeds of the same wild plant, which originated from the two sampling sites of Brazilian Cerrado: Senador Canedo (SC) and Campo Alegre de Goiás (CA). The cultivated individuals were grown in the form of a randomized block with three replications in a single experimental field (S 16° 35’ 39’’, W 49° 17’ 23’’, 716 m) belonging to the School of Agronomy and Food Engineering of Universidade Federal de Goiás, Goiânia, Goiás State, Brazil. Voucher (40611 and 40612) specimens are deposited at the Herbarium of Universidade Federal de Goiás (UFG).
In order to assess the chemical composition of oils, leaf samples were collected from 13 different trees grown Table 2. Canonical correlation summary of oil constituents and climactic factors with their canonical variates
Discriminant oil constituents (set 1) Canonical Variate Climactic Canonical variate
Scores Loadings factors (set 2) Scores Loadings
1 α-Pinene 0.119 0.270 Temperature (°C) 0.006 -1.000
5 (Z)-β-Ocimene -0.221 0.409 Precipitation (mm) -0.007 -1.000
6 (E)-β-Ocimene 1.424 0.397 Evaporation (mL) 0.145 -1.000
9 α-Copaene 0.108 0.166 Insolation (h) -0.134 1.000
10 β-Caryophyllene -0.055 -0.426
14 α-Humulene -0.118 0.129
16 α-Amorphene -0.545 -0.262
20 Bicyclogermacrene 1.228 0.432
24 γ-Cadinene -0.051 -0.024
26 δ-Cadinene -0.123 0.089
27 Caryophyllene oxide -0.414 -0.214
28 Humulene epoxide II 0.102 0.428
29 Muurola-4,10(14)-dien-1β-ol -0.329 0.175
Monoterpene hydrocarbons -0.065 0.116
Oxygenated monoterpenes 0.317 0.551
Sesquiterpene hydrocarbons 0.309 0.005
Oxygenated sesquiterpenes 0.037 -0.113
Eingenvalue 0.832
Canonical correlation 0.912
Wilks’ lambda 0.050
Degrees of freedom 68
P-value 0.003
Cumulative variance (%):
of discriminant oil constituent data 7.2
from SC seeds (9 samples collected in the dry season and 13 in the wet season) and 14 different trees grown from CA seeds (11 samples collected in the dry season and 14 in the wet season), all of which were dried for 7 days at 30 °C until constant weight. After being powdered, each dried phytomass (50 g) was submitted to hydrodistillation (3 h) by means of a modified Clevenger-type apparatus. At the end of each distillation oils were collected, dried with anhydrous Na2SO4, transferred to glass flasks, and kept at a temperature of −18 °C until analysis. Oil yields (%) were based on the dried weight of plant samples. All experiments were conducted in duplicate and the results are shown as mean values.
Mean monthly values of temperature and precipitation were obtained from climatological stations at UFG. The mean values for maximum and minimum temperatures (°C) for the months of July 2006 and April 2007 were 30.0 ± 2.5, 9.9 ± 1.7 (average 19.3 ± 1.7) and 32.0 ± 1.5, 16.3 ± 1.1 (average 23.2 ± 0.9), respectively. The average relative humidity and total rainfall of the months in question were 83.1 ± 4.2% and 0.0 mm and 81.7 ± 3.5%, 129.5 mm, respectively. As regards the climatic data collection, only the relative humidity failed to share significant differences at 5% probability by Student’s t test. The canonical correlation procedure was applied to both data sets concerning essential oil constituents and climactic characteristics.
Chemical analyses
Oil sample analyses were performed on a GC-MS Shimadzu QP5050A instrument under the following conditions: a CBP-5 (Shimadzu) fused silica capillary column (30 m × 0.25 mm i.d., 0.25 µm film thickness) connected to a quadrupole detector operating in the EI mode at 70 eV with a scan mass range of 40-400 m/z at a sampling rate of 1.0 scan s-1; carrier gas: He (1 mL min-1); injector and
interface temperatures of 220 °C and 240 °C, respectively, with a split ratio of 1:20. The injection volume was 0.4 µL (ca. 20% in hexane) and the oven temperature was raised from 60 °C to 246 °C with an increase of 3 °C min-1, then
10 °C min-1 to 270 °C, holding the final temperature for 5 min.
Individual components were identified by a comparison of their retention indices (RI),31 a co-injection with a C
8-C32
n-alkanes series,32 mass spectra with those of the literature,31
and a computerized MS-database using national institute of standards and technology (NIST) libraries.
Chemical variability
P r i n c i p a l c o m p o n e n t ( P C A ) a n d m u l t i p l e correspondence analyses were applied in order to examine
the interrelationships between populations and their chemical constituents such as amount or presence/absence code, respectively, using système portable d’analyse des Données numériques-SPAD.N software package, version 2.5, Centre International de Statistique et d’Informatique appliquées, France (1994). A cluster analysis was also applied to the study of similarity of samples on the basis of essential oil constituent distribution. Nearest neighbour complete linkage technique by Benzécri algorithm was used as a similarity index and hierarchical clustering was performed according to Ward’s variance minimizing method.33 For the variable selection, the threshold of
residual eigenvalues (≤ 0.70) in the original data matrix (47 samples × 29 variables) was used to establish the maximum number of variables which could be removed (17 variables).34 The 14 variables which were effectively
eliminated revealed the highest loadings in the lowest residual eigenvalues and also contributed ≤ 2% to the chemical profiles (average values).
Canonical discriminant analysis using SAS CANDISC procedure (statistical analysis system, SAS institute Inc., Cary, NC, 1996) was used to differentiate populations and clusters on the basis of oil composition. The predictive ability of canonical discriminant functions was evaluated by a Jackknife approach.19 Prior to the multivariate analysis, the data was
preprocessed by means of auto-scaling and mean centering. Oil variability and climactic factor relationships were obtained via a canonical correlation analysis implemented using the SAS CANCORR procedure. The predictive ability was evaluated by canonical redundancy analysis with a standardized variance coefficient.
Average multiple comparisons were established by two-way ANOVA (seed origin and season as factors) using SAS GLM analyses. All data were checked for homoscedasticity with the use of Hartley’s test. This test revealed significant departures from the basic assumption for the oil constituents
6, 8, 12, 13, 17, 18, 25, 26, 28, oxygenated sesquiterpene and 2-4, 10, 11, 21, 22, monoterpenes, monoterpene hydrocarbons and sesquiterpenes, which were arcsine- and rank-transformed, respectively. Whenever a difference was established a post-hoc Tukey’s test was performed. Results are shown as mean values and are joined by the standard deviation of independent measurements in some cases.
P-values below 0.05 were regarded as significant.
Acknowledgements
Supplementary Information
Supplementary data are available free of charge at http:// jbcs.sbq.org.br, as a PDF file.
References
1. Johnson, L. A. S.; Briggs, B. G.; Ann. Missouri Bot. Gard. 1984, 71, 700; Landrum, L. R.; Kawasaki, M. L.; Brittonia 1997, 49, 508.
2. Almeida, S. P.; Proença, C. E. B.; Sano, S. M.; Ribeiro, J. F.; Cerrado: Espécies Vegetais Úteis, Embrapa-CPAC: Planaltina, DF, Brazil, 1998.
3. Septímio, L. R.; A Fitoterapia Baseada em Ervas Medicinais do Cerrado, Secretaria de Intercâmbio e Projetos Especiais do Ministério da Cultura: Brasília, Brazil, 1994.
4. Lima, E. O.; Gompertz, O. F.; Giesbrecht, A. M.; Paulo, M. Q.; Mycoses 1993, 36, 333; Souza, L. K. H.; Oliveira, C. M. A.; Ferri, P. H.; Santos, S. C.; Oliveira Júnior, J. G.; Miranda, A. T. B.; Lião, L. M.; Silva, M. R. R.; Braz. J. Microbiol. 2002, 33, 247. 5. Ogunwande, I. A.; Olawore, N. O.; Ekundayo, O.; Walker, T.
M.; Schmidt, J. M.; Setzer, W. N.; Int. J. Aromatherapy 2005, 15, 147.
6. Costa, T. R.; Fernandes, O. F. L.; Santos, S. C.; Oliveira, C. M. A.; Lião, L. M.; Ferri, P. H.; Paula, J. R.; Ferreira, H. D.; Sales, B. H. N.; Silva, M. R. R.; J. Ethnopharmacol. 2000, 72, 111. 7. Santos, S. C.; Ferri, P. H.; Ribeiro, J. P.; Guimarães, D. O.; Silva,
M. O.; Garcia, A. C. F.; Pires, J. S.; Castro, A. C. M.; Silva, M. R. R.; Paula, J. R.; Rev. Bras. Planta Med. 2004, 7, 30. 8. Telles, M. P. C.; Coelho, A. S. G.; Chaves, L. J.; Diniz-Filho,
J. A. F.; Valva, F. D.; Conserv. Genet. 2003, 4, 685.
9. Zucchi, M. I.; Pinheiro, J. B.; Chaves, L. J.; Coelho, A. S. G.; Couto, M. A.; Morais, L. K.; Vencovsky, R.; Pesq. Agropec. Bras. 2005, 40, 975.
10. Duarte, A. R.; MSc Dissertation, Universidade Federal de Goiás, Brazil, 2008; Duarte, A. R.; Costa, A. R. T.; Santos, S. C.; Ferri, P. H.; Paula, J. R.; Naves, R. V.; J. Essent. Oil Res. 2008, 20, 30.
11. Chericoni, S.; Flamini, G.; Campeol, E.; Cioni, P. L.; Morelli, I.; Biochem. Syst. Ecol. 2004, 32, 423; Silva, F. G.; Oliveira, C. B. A.; Pinto, J. E. B. P.; Nascimento, V. E.; Santos, S. C.; Seraphin, J. C.; Ferri, P. H.; J. Braz. Chem. Soc. 2007, 18, 990. 12. Hussain, A. I.; Anwar, F.; Sherazi, S. T. H.; Przybylski, R.; Food
Chem. 2008, 108, 986.
13. Zheng, G. Q.; Kenney, P. M.; Lam, L. K. T.; J. Nat. Prod. 1992, 55, 999.
14. Henriques, A. T.; Sobral, M. E.; Cauduro, A. D.; Schapoval, E. E. S.; Bassani, V. L.; Lamaty, G.; Menut, C.; Bessiere, J. M.; J. Essent. Oil Res. 1993, 5, 501.
15. Cole, R. A.; Haber, W. A.; Setzer, N.; Biochem. Syst. Ecol. 2007, 35, 877.
16. Weyerstahl, P.; Weyerstahl, H. M.; Christiansen, C.; Oguntimein, B. O.; Adeoye, A. O.; Planta Med. 1988, 54, 546; Sangwan, N. K.; Verma, B. S.; Verma, K. K.; Dhindsa, K. S.; Pestic. Sci. 1990, 28, 331.
17. Sneath, P. H.; Sokal, R. R.; Principles of Numerical Taxonomy, W.H. Freeman: San Francisco, 1963.
18. Adams, R. P.; Biochem. Syst. Ecol. 1999, 27, 709. 19. Tukey, J. W.; Ann. Math. Stat. 1958, 29, 614.
20. Sturgeon, K. B.; Evolution 1979, 33, 803; Langenheim, J. H.; J. Chem. Ecol. 1994, 20, 1223; Morais, S. M.; Craveiro, A. A.; Machado, M. I. L.; Alencar, J. W.; Matos, F. J. A.; J. Essent. Oil Res. 1996, 8, 449; Figueiredo, A. C.; Barroso, J. G.; Pedro, L. G.; Scheffer, J. J. C.; In Essential Oils: Basic and Applied Research; Franz, C., Mathe, A., Buchbauer, G., eds.; Allured: Illinois, 1997, p. 95; Robles, C.; Garzino, S.; Phytochemistry 2000, 53, 71; Curado, M. A.; Oliveira, C. B. A.; Jesus, J. G.; Santos, S. C.; Seraphin, J. C.; Ferri, P. H.; Phytochemistry 2006, 67, 2363. 21. Sano, S. M.; Fonseca, C. E. L.; Ribeiro, J. F.; Oga, F. M.; Luiz,
A. J. B.; Pesq. Agropec. Bras. 1995, 30, 5.
22. Arey, J.; Crowley, D. E.; Crowley, M.; Resketo, M.; Lester, J.; Atmos. Environ. 1995, 29, 2977.
23. Dicke, M.; Hilker, M.; Bas. Appl. Ecol. 2003, 4, 3; Jurgens, A.; Feldhaar, H.; Feldmeyer, B.; Fiala, B.; Biochem. Syst. Ecol. 2006, 34, 97.
24. Celiktas, O. Y.; Kocabas, E. E. H.; Bedir, E.; Sukan, F. V.; Ozek, T.; Baser, K. H. C.; Food Chem. 2007, 100, 553.
25. Angioni, A.; Barra, A.; Coroneo, V.; Dessi, S.; Cabras, P.; J. Agric. Food Chem. 2006, 54, 4364.
26. Kofidis, G.; Bosabalidis, A.; Kokkini, S.; J. Essent. Oil Res. 2006, 16, 469.
27. Kim, J. C.; Kim, K. J.; Kim, D. S.; Han, J. S.; Chemosphere 2005, 59, 1685.
28. Trindade, M. G.; Chaves, L. J.; Genet. Mol. Biol. 2005, 28, 407.
29. Zucchi, M. I.; Brondani, R. P. V.; Pinheiro, J. B.; Chaves, L. J.; Coelho, A. S. G.; Vencovsky, R.; Genet. Mol. Biol. 2003, 26, 449.
30. Kimura, M.; Weiss, G. H.; Genetics 1964, 49, 561.
31. Adams, R. P.; Identification of Essential Oil Components by Gas Chromatography/Mass Spectrometry, 4th ed., Allured: Illinois, 2007.
32. Van Den Dool, H.; Kratz, P. D. J. A.; J. Chromatogr. 1963, 11, 463.
33. Ward, J. H.; J. Am. Stat. Assoc. 1963, 58, 238; Benzécri, J. P.; L´Analyse des Données: la Taxinomie, Tome 1, Dunod: Paris, 1980.
34. Mardia, K. V.; Kent, J. T.; Bibby, J. M.; Multivariate Analysis, Academic Press: London, 1980.
Supplementary Information
0103 - 5053 $6.00+0.00
*e-mail: [email protected]
Seasonal Influence on the Essential Oil Variability of Eugenia dysenterica
Alessandra R. Duarte,a Ronaldo R. Naves,b Suzana C. Santos,a José C. Seraphin,c and Pedro H. Ferri*,a
aLaboratório de Bioatividade Molecular, Instituto de Química, Universidade Federal de Goiás,
CP 131, 74001-970 Goiânia-GO, Brazil
bSetor de Horticultura, Escola de Agronomia e de Engenharia de Alimentos, Universidade Federal de Goiás,
CP 131, 74001-970 Goiânia-GO, Brazil
cNúcleo de Estatística Aplicada, Instituto de Matemática e Estatística, Universidade Federal de Goiás,
CP131, 74001-970 Goiânia-GO, Brazil
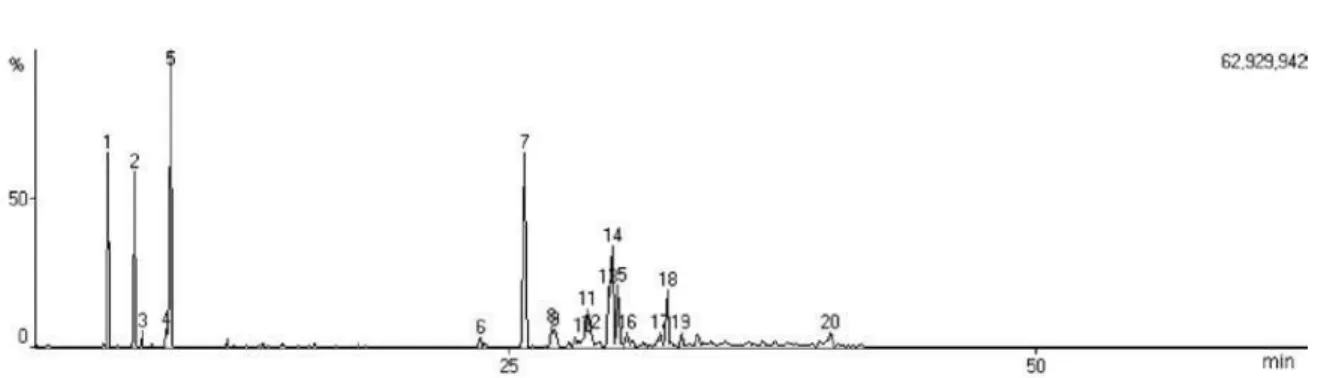
Figure S1. Total ion chromatogram (TIC) of essential oil from E. dysenterica leaves cultivated from seeds from Senador Canedo (SC) and collected
during winter.
Figure S2. Total ion chromatogram (TIC) of essential oil from E. dysenterica leaves cultivated from seeds from Senador Canedo (SC) and collected
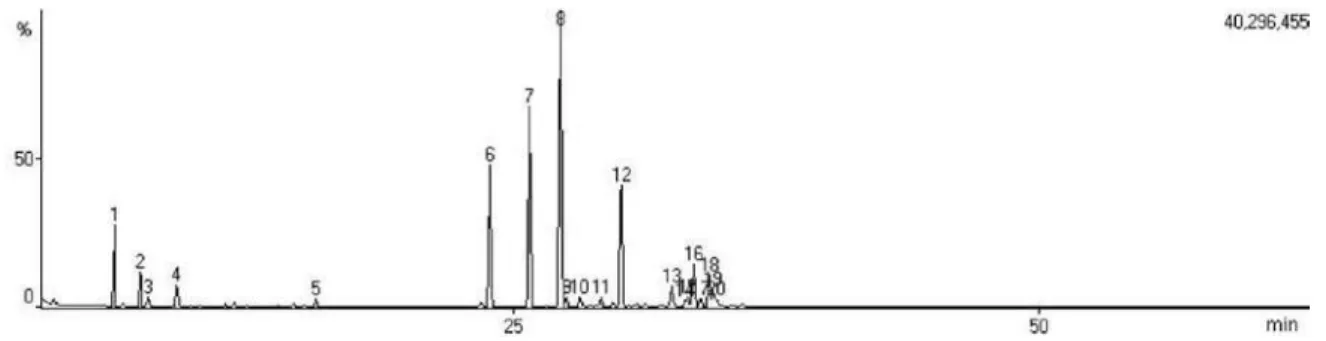
Figure S3. Total ion chromatogram (TIC) of essential oil from E. dysenterica leaves cultivated from seeds from Campo Alegre de Goiás (CA) and collected during winter.
Figure S4. Total ion chromatogram (TIC) of essential oil from E. dysenterica leaves cultivated from seeds from Campo Alegre de Goiás (CA) and collected
during summer.
Figure S5. Mass spectrum of α-pinene.
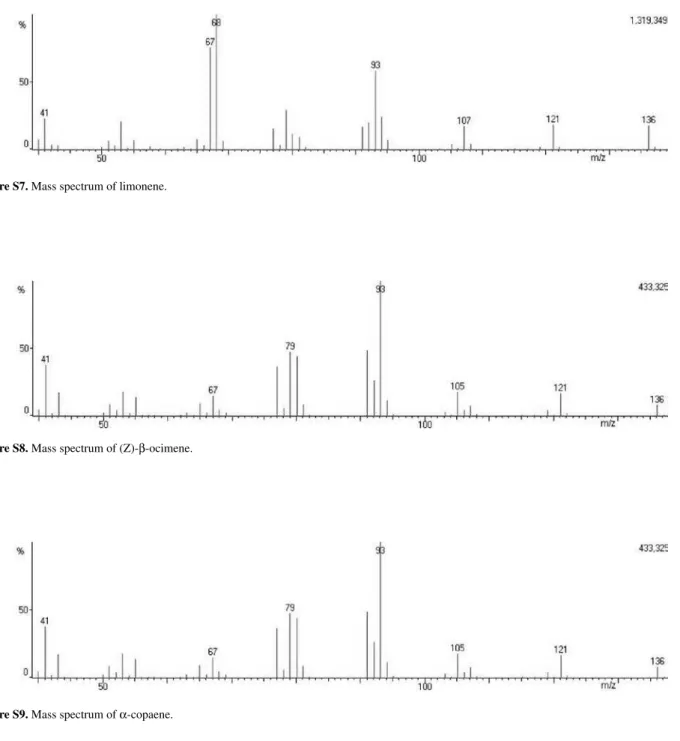
Figure S7. Mass spectrum of limonene.
Figure S8. Mass spectrum of (Z)-β-ocimene.
Figure S9. Mass spectrum of α-copaene.
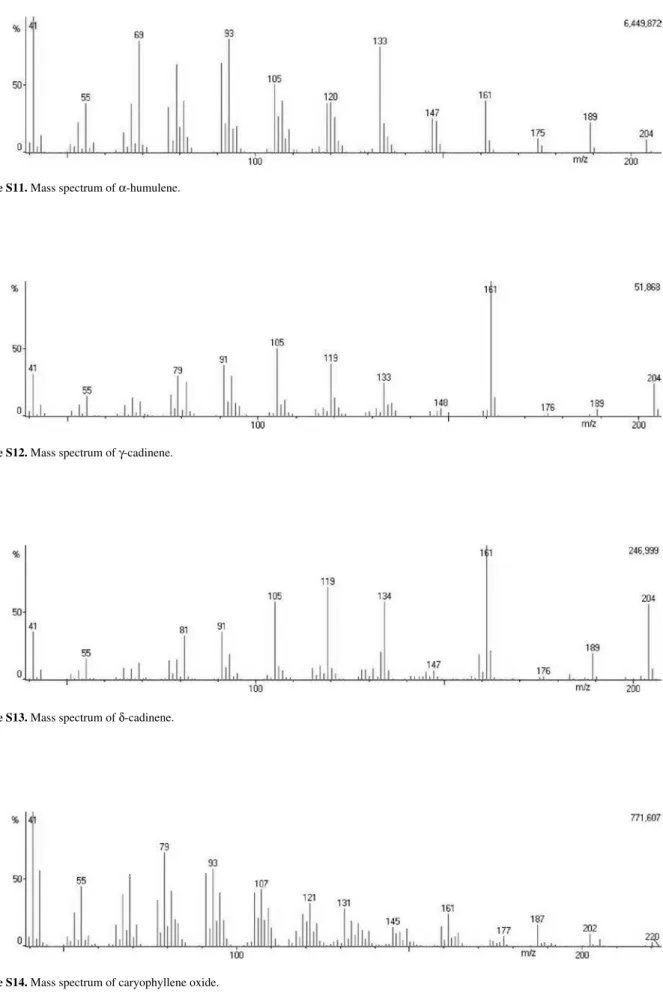
Figure S11. Mass spectrum of α-humulene.
Figure S12. Mass spectrum of γ-cadinene.
Figure S13. Mass spectrum of δ-cadinene.
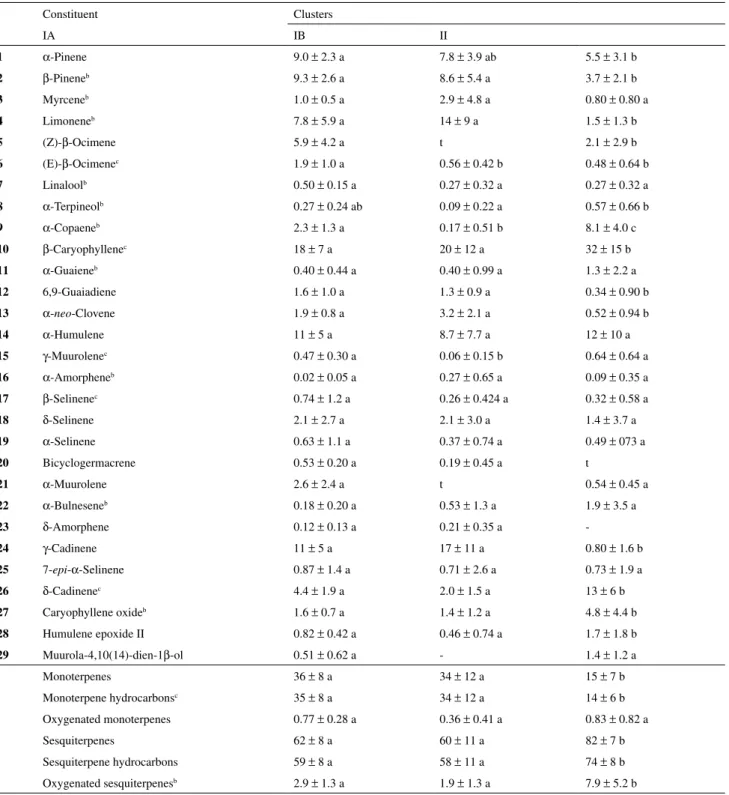
Table S1. Percentagesa of essential oil constituents in clustered samples of E. dysenterica from seeds obtained from two different sites and collected during dry and wet seasons in the Brazilian Cerrado.
Constituent Clusters
IA IB II
1 α-Pinene 9.0 ± 2.3 a 7.8 ± 3.9 ab 5.5 ± 3.1 b
2 β-Pineneb 9.3 ± 2.6 a 8.6 ± 5.4 a 3.7 ± 2.1 b
3 Myrceneb 1.0 ± 0.5 a 2.9 ± 4.8 a 0.80 ± 0.80 a
4 Limoneneb 7.8 ± 5.9 a 14 ± 9 a 1.5 ± 1.3 b
5 (Z)-β-Ocimene 5.9 ± 4.2 a t 2.1 ± 2.9 b
6 (E)-β-Ocimenec 1.9 ± 1.0 a 0.56 ± 0.42 b 0.48 ± 0.64 b
7 Linaloolb 0.50 ± 0.15 a 0.27 ± 0.32 a 0.27 ± 0.32 a
8 α-Terpineolb 0.27 ± 0.24 ab 0.09 ± 0.22 a 0.57 ± 0.66 b
9 α-Copaeneb 2.3 ± 1.3 a 0.17 ± 0.51 b 8.1 ± 4.0 c
10 β-Caryophyllenec 18 ± 7 a 20 ± 12 a 32 ± 15 b
11 α-Guaieneb 0.40 ± 0.44 a 0.40 ± 0.99 a 1.3 ± 2.2 a
12 6,9-Guaiadiene 1.6 ± 1.0 a 1.3 ± 0.9 a 0.34 ± 0.90 b
13 α-neo-Clovene 1.9 ± 0.8 a 3.2 ± 2.1 a 0.52 ± 0.94 b
14 α-Humulene 11 ± 5 a 8.7 ± 7.7 a 12 ± 10 a
15 γ-Muurolenec 0.47 ± 0.30 a 0.06 ± 0.15 b 0.64 ± 0.64 a
16 α-Amorpheneb 0.02 ± 0.05 a 0.27 ± 0.65 a 0.09 ± 0.35 a
17 β-Selinenec 0.74 ± 1.2 a 0.26 ± 0.424 a 0.32 ± 0.58 a
18 δ-Selinene 2.1 ± 2.7 a 2.1 ± 3.0 a 1.4 ± 3.7 a
19 α-Selinene 0.63 ± 1.1 a 0.37 ± 0.74 a 0.49 ± 073 a
20 Bicyclogermacrene 0.53 ± 0.20 a 0.19 ± 0.45 a t
21 α-Muurolene 2.6 ± 2.4 a t 0.54 ± 0.45 a
22 α-Bulneseneb 0.18 ± 0.20 a 0.53 ± 1.3 a 1.9 ± 3.5 a
23 δ-Amorphene 0.12 ± 0.13 a 0.21 ± 0.35 a
-24 γ-Cadinene 11 ± 5 a 17 ± 11 a 0.80 ± 1.6 b
25 7-epi-α-Selinene 0.87 ± 1.4 a 0.71 ± 2.6 a 0.73 ± 1.9 a
26 δ-Cadinenec 4.4 ± 1.9 a 2.0 ± 1.5 a 13 ± 6 b
27 Caryophyllene oxideb 1.6 ± 0.7 a 1.4 ± 1.2 a 4.8 ± 4.4 b
28 Humulene epoxide II 0.82 ± 0.42 a 0.46 ± 0.74 a 1.7 ± 1.8 b
29 Muurola-4,10(14)-dien-1β-ol 0.51 ± 0.62 a - 1.4 ± 1.2 a
Monoterpenes 36 ± 8 a 34 ± 12 a 15 ± 7 b
Monoterpene hydrocarbonsc 35 ± 8 a 34 ± 12 a 14 ± 6 b
Oxygenated monoterpenes 0.77 ± 0.28 a 0.36 ± 0.41 a 0.83 ± 0.82 a
Sesquiterpenes 62 ± 8 a 60 ± 11 a 82 ± 7 b
Sesquiterpene hydrocarbons 59 ± 8 a 58 ± 11 a 74 ± 8 b
Oxygenated sesquiterpenesb 2.9 ± 1.3 a 1.9 ± 1.3 a 7.9 ± 5.2 b
a Average based on original data ± standard deviation. b Rank- and c arcsine-transformed in ANOVA analysis. t: trace. IA: only SC seed origin-dry season
samples; IB: majority SC seed origin-wet season samples; II: all samples from CA seed origin regardless of season (see text). Averages followed by the