Article
Printed in Brazil - ©2013 Sociedade Brasileira de Química0103 - 5053 $6.00+0.00A
*e-mail: [email protected]
Uncertainty in the Determination of Glucose and Sucrose in Solutions with
Chitosan by Enzymatic Methods
Berta N. Estevinho, Amélia Ferraz, Lúcia Santos, Fernando Rocha and Arminda Alves*
Laboratório de Engenharia de Processos, Ambiente e Energia (LEPAE),
Departamento de Engenharia Química, Faculdade de Engenharia da Universidade do Porto, Rua Dr. Roberto Frias, s/n, 4200-465 Porto, Portugal
O objetivo deste trabalho foi determinar a aplicabilidade de dois métodos enzimáticos um para a quantificação da glucose e outro da sacarose em soluções aquosas contendo quitosano. Os métodos analíticos foram validados e os principais parâmetros determinados como limite de detecção, intervalo de linearidade, precisão e exatidão. A incerteza global do método enzimático da glucose foi inferior a 10% no intervalo de 700 a 2000 mg L-1, para o método de análise da sacarose
a incerteza global foi inferior a 3% para todo o intervalo de análise (100-1000 mg L-1). Apesar
da semelhança das performances com relação a outros métodos analíticos, o método enzimático provou ser mais adequado, em particular do que a cromatografia líquida de alta eficiência (HPLC), principalmente se um grande número de amostras deve ser analisado (permitindo um resultado rápido) e ainda devido às propriedades mucoadesivas do quitosano que dificultam as metodologias analíticas por HPLC, criando problemas de estabilidade na coluna cromatográfica.
The purpose of this work was to evaluate the applicability of two enzymatic methods to quantify glucose and sucrose in aqueous solutions with chitosan. The analytical methods were validated and the main parameters, as limit of detection, linearity range, precision and accuracy were determined. The global uncertainty for glucose enzymatic method was less than 10% for concentration levels between 700 and 2000 mg L-1, and for the sucrose enzymatic method, the global
uncertainty showed values less than 3% for all concentration levels analyzed (100-1000 mg L-1).
Despite the similarities of performances with respect to other analytical methods, the enzymatic method proved to be better than others, in particular high performance liquid-chromatography (HPLC), mainly if a great number of samples needs to be analyzed, allowing a quick result, and because the mucoadhesive properties of chitosan make difficult the HPLC analytical methodology, creating stability problems in the chromatographic column.
Keywords: uncertainty, enzymatic methods, glucose, sucrose, chitosan
Introduction
Chitosan is a polycationic polymer obtained
commercially by alkaline deacetylation of chitin.1,2
The chitosan molecule is a copolymer of N
-acetyl-D-glucosamine and -acetyl-D-glucosamine and differs in the
degree of N-acetylation (40-98%) and molecular weight
(50-2000 kDa).1-3 Chitin is the second most abundant
natural polymer in nature after cellulose and is found in the structure of a wide number of invertebrates (crustaceans, exoskeleton insects, cuticles) among others. Chitosan can be also considered as a biodegradable and a non-toxic product and is currently receiving a great deal of
interest for medical, pharmaceutical, industrial and food applications.1-3
The main reasons for this increasing attention to this natural product are certainly its interesting intrinsic properties associated to the reactive amino functional groups that give the potential to be used in many different fields.1,4-6
Other properties with special interest for food industry
are related to the anticholesterolemic,7,8 antioxidant9 and
antimicrobial properties9 of chitosan.
structure to form water soluble chitosan which is easily
soluble in neutral aqueous solutions.4-8
Chitosan has been widely used in pharmaceutical and food industry, for example as a carrier for drug delivery. The use of chitosan microparticles and chitosan films as controlled drug delivery systems for conventional drugs, protein drugs and bioactive compounds has attracted increasing attention since
the beginning of 1990’s.2,10-15 Chitosan can also be used as
a support for enzyme immobilization.16 On the other hand,
carbohydrates are known to play a variety of roles in the welfare of mankind. The analyses of carbohydrates are the most widespread chemical analyses that are performed within the industries of food, beverage, forage, biomass, pulp and
paper, pharmaceuticals, among others.17 These industries
intend the development of analytical methods based on low
cost, easiness of operation and portable instrumentation.18-20
An example of the importance of the control of carbohydrates is the sugar refining process (crystallization, centrifugation
or carbonation).21
Several methods and protocols have been revised and new generations of instruments have emerged to give response to the increased importance of carbohydrate analysis in the last years. Although there is a large number of analytical methods for carbohydrates, few studies include validation parameters and the uncertainty determination. Some methods with validation parameters for carbohydrates analysis, such as biosensor-based, refractometry, Fourier transform infrared spectroscopy (FTIR), enzymatic with spectrophotometry analysis and high-performance liquid chromatography (HPLC) have
been discussed by Estevinho et al.22
In the literature, the most of analytical methods for
carbohydrates analysis are enzymatic18 and chromatographic
methods,17,23-25 but, to the best of our knowledge, the only
methodology for the determination of glucose in aqueous
solutions with chitosan was developed byEstevinho et al.26
These authors studied the interference of chitosan in the analysis of glucose aqueous solutions by HPLC with evaporative light scattering detection (ELSD), considering
the advantages of this detector relatively to others.23-25 The
HPLC-ELSD methodology was considered adequate for analysis of glucose in aqueous solution in the presence of chitosan. However, the mucoadhesive properties of chitosan, which is known to interact with a large kind of molecules, make difficult the analytical methodology, particularly creating stability problems in the chromatographic column,
affecting efficiency and resolution of glucose peak.26 These
authors minimized the effects of the chitosan interactions by using a gradient programme with acetonitrile:water as eluent and special procedures between runs, for a total time of analysis of 20 min.
The objective of this work was to evaluate the applicability of an enzymatic method to quantify glucose and sucrose in solution with chitosan, minimizing the effects of the chitosan interactions, the time of analysis and the problems associated to the use of HPLC methods with chitosan. The analytical methods were validated and the main parameters, as the limit of detection, linearity range, precision, accuracy and uncertainty, were obtained.
Experimental
Reagents
All reagents were of analytical grade purity. D-Glucose was supplied by Merck (Darmstadt, Germany) (Ref. 1.08337.1000), sucrose was from Merck (Darmstadt, Germany) (Ref. 1.07687.1000), chitosan (medium molecular weight with deacetylation degree between 75 and 85% and viscosity of 200 to 800 mPa s) was purchased from Aldrich (St. Louis, USA) (Ref. 448877-50G) and acetic acid (glacial) 100% anhydrous was from Merck (Darmstadt, Germany) (Ref. 1.00063.2511).
For the preparation of the enzymatic solution used in glucose determination, the following reagents
were used: 3-(N-morpholino)propanesulfonic acid
(MOPS) with a purity degree 99.5% from Sigma
(Ref. M1254), phenol from Riedel-de Haën® (Ref. 33517),
4-aminophenazone from Riedel-de Haën® (Ref. 33528),
glucose oxidase (from Aspergillus niger) from Sigma
(Ref. G6766-10KU-023K3792), peroxidase type I (from horseradish) from Sigma (Ref. P8125-25KU-031K7465), potassium dihydrogen phosphate from Panreac (Ref. 131509.1211) and anhydrous sodium carbonate from Pronalab (Cod. 98 No. 1717).
For sucrose determination a commercial enzymatic kit from Sigma (Ref. SCA-20) was used.
Preparation of the standard and simulated samples
Glucose and sucrose standard solutions were prepared from stock solutions prepared with deionized water. Glucose calibration standards with concentrations of 50, 150, 300, 500,
700, 1000 and 2000 mg L-1 of glucose were prepared from
the stock solution of 10 g L-1 of glucose in deionized water.
Sucrose standards with concentrations of 100, 250, 500,
750 and 1000 mg L-1 of sucrose were prepared from the
stock solution, with the concentration of 1 g L-1 of sucrose,
in deionized water.
Preparation of enzymatic solutions
The glucose enzymatic solution was prepared considering the following final concentration for each
compound: 5.16 g L-1 MOPS, 1.04 g L-1 phenol, 0.16 g L-1
4-aminophenazone, 0.71 g L-1 glucose oxidase, 0.04 g L-1
peroxidase, 5.25 g L-1 potassium dihydrogen phosphate and
1.21 g L-1 anhydrous sodium carbonate.
The sucrose enzymatic solution was prepared according to the sigma kit instructions. The sucrose assay reagent and glucose assay reagent solutions were reconstituted in water.
Equipment
The equipments used were a spectrophotometer UV-Visible V-530 (Jasco) and a thermostatic bath Stuart Scientific Co. Ltd (test tube, heater SHTD, 5006, UK).
Glucose enzymatic method
This method was adapted from Skoog and Leary,27 and
was based on the utilization of enzymes that catalyze the reaction of glucose degradation with the formation of a colored compound (quinonimine), considering the following equations:
(1)
(2)
Samples and standards were prepared as described in Table 1. All samples and standards were incubated for 1 h at 37 ºC. The absorbance at 500 nm is proportional to the concentration of glucose in the sample, according to the Beer law.
Sucrose enzymatic method
For the analysis of sucrose, a commercial kit was used (Sigma sucrose assay kit). In this process, the following equations are involved:
(3)
(4)
(5)
Samples were prepared for the enzymatic reaction as described in the instructions of the sucrose assay kit (Table 2).
After 10 min of ambient temperature incubation, 2 ml of glucose assay reagent were added to the samples and incubated for more 15 min. The consequent increase in absorbance at 340 nm was directly proportional to sucrose
concentration (Beer law). The sucrose concentration (g L-1)
was determined according to the following equations:
(6)
(7)
where A represents absorbance, C the concentration of sucrose and f the dilution factor from sample preparation.
Results and Discussion
The analysis of glucose and sucrose are two of the most frequent chemical analyses in industry (food, beverages, pharmaceuticals, among others), either for quality control purposes or chemical composition evaluation, so requiring the necessity of implementing selective and sensitive analytical methods like the enzymatic methods.
An adequate and validated method for the analysis of any nutrient or compound is a fundamental step in achieving a good analytical result. Few enzymatic methods have a study of validation method, and from our knowledge, no one including the determination of uncertainty. For
example, Garbelotti et al.28 studied the determination and
validation of dietary fibers (chitosan can have the function of a fiber in human digestion) in food by an enzymatic gravimetric method. These authors determined the precision (approximately 20%), the accuracy by the analysis of the recovery (70-120%) and the coefficient of correlation of
the methods (0.9999). Liu et al.29 developed and validated
Table 1. Preparation of the samples and standards for the enzymatic reaction
Water / µL Standard / µL Sample / µL solution / mLEnzymatic
Standard − 50 − 5
Sample − − 50 5
Blank 50 − − 5
Table 2. Preparation of samples and standards for the sucrose enzymatic reaction
Sucrose assay reagent / mL
Sample / mL
Water / mL Sucrose assay reagent blank 0.1 − 0.1
Sample blank − 0.1 0.1
Glucose assay reagent blank − − 0.2
a direct enzymatic HbA1c assay for human whole blood samples, and also in this case, the validation study was limited to the determination of the precision and accuracy. Accuracy studies were completed by comparing the direct enzymatic assay to the existing HPLC and immunoassay
methods. Also, Woollard et al.30 did the enzymatic
determination of carnitine in milk and infant formula studying some validation parameters (precision and
accuracy). Zhou and Prognon31 tested the implementation
of International Conference on Harmonisation (ICH) guidelines for validation of analytical methods in the case of two enzymatic assays of determination of superoxide dismutase (SOD) activity. These authors determined precision and accuracy by the analysis of the recovery, specificity and coefficients of correlations of the methods.
The validation of the enzymatic methodologies (glucose enzymatic and sucrose enzymatic methods) were performed, not only to establish the main characteristics of the methods (linearity range, limit of detections, accuracy and precision), but also to assess the global uncertainty associated to the results.
Validation of the glucose enzymatic method
For the glucose enzymatic method, the calibration curve was obtained for 7 glucose standards with concentrations
ranging from 50 to 2000 mg L-1, whenever the samples were
measured. Figure 1 presents one of these calibration curves. The coefficients of correlation were higher than 0.998 and
the limit of detection was 39.5 mg L-1.
The intermediate precision of this method was evaluated taking into account the relative standard deviation (RSD) of all the standards, in different days, at the optimized conditions. The variation coefficient (CV in %) was 26.9% on average, the bigger contribution being from the
standards with lower concentration. The smaller standard
concentrations (50 and 150 mg L-1) had a variation
coefficient higher than 40%.
The recovery factor (Re) was defined as the ratio between the obtained concentration and the expected one. Accuracy, expressed by the percentage of recovery, was 102.6%, on average. The recovery factors ranged between 98.8 and 120%, related to the standards of 300 and
50 mg L-1, respectively.
In the present work, the bottom-up approach was used to estimate the overall uncertainty by identifying, estimating and combining all the sources of uncertainty associated to the
analytical results, as mentioned in Eurachem/Cytac.32
It is considered an overestimation of the uncertainty, but it has the advantage of weighing the individual contributions, and therefore, allowing the detection of the most significant sources.
Global uncertainty (U) combines the contributions of all
the sources of error linked to the analytical procedure and can be calculated from the following equation:
(8)
U1, U2, U3 and U4 are the uncertainties associated to
standard preparation, calibration curve, precision and accuracy, respectively.
The uncertainty associated to the standard preparation
(U1) was calculated for each standard according to
equation 9, considering the relative error associated to each mass or volume measurement and the law of propagation of uncertainty
(9)
where ∆mglucose is the uncertainty associated to the mass
measurement (mglucose), ∆V1 is the uncertainty associated to
the preparation of the standard stock solution in a volumetric
flask of 100 mL (V1), ∆V2 is the uncertainty associated to
the preparation of the standards (25 mL, V2), and ∆V3 is the
uncertainty associated to the pipetted volume (V3) of the
stock solution to prepare the different standards.
The uncertainty associated to the calibration curve (U2)
was calculated, for each standard by the calibration curve considering the following equations:
(10)
(11)
where Sy
–
x represents the standard deviation of the
linearization, b represents the slope of the regression curve,
m the number of replicates performed for each xivalue, n the
number of standards used to build the calibration curve (n = 7), yi the experimental value of y (absorbance), yical the value
of y calculated by the regression curve for the concentration
xi, yav the average of yi values, xi the concentration of standards
(x) used in the calibration and xav the average of xi values.
The uncertainty associated to the precision (U3) was
estimated considering the precision of the measurement
for each standard. In the following formula, s represents
the standard deviation of precision assays.
(12)
The uncertainty associated to the accuracy (U4) was
calculated from equation 13, where η represents the
recovery of the assays with spiked solutions at different levels:
(13)
In Figure 2, the relative weight of each individual source of uncertainty for glucose analysis is represented.
The relative contribution of these four sources is decisively dependent of the calibration levels, being the
uncertainty associated to the calibration curve (U2), the
main responsible for the correspondent variation for lower glucose concentration. For the upper glucose concentration
levels, the influences of precision (U3) and accuracy (U4)
achieved a combined contribution around 70%.
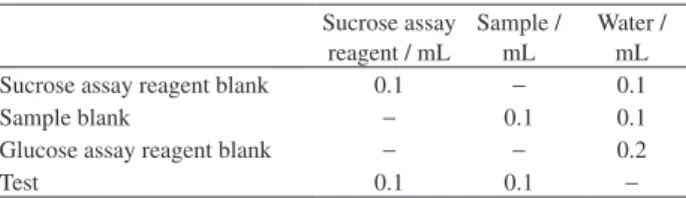
Figure 3 presents the variation of the global uncertainty with the glucose concentration levels. The global
uncertainty was less than 10% for concentration levels
between 700 and 2000 mg L-1. For lower glucose
concentrations, the uncertainty increased in an exponential
mode. For glucose concentration less than 150 mg L-1, the
values increased significantly to values higher than 25%.
This method was applied to analyze simulated samples prepared by mixing glucose with a chitosan (1% w/v) aqueous solution with 1% (v/v) acetic acid. Several simulated solutions were prepared with chitosan and glucose. The first tested solution did not have glucose and was used to evaluate if the chitosan gave any kind of response with this methodology. One can conclude that chitosan does not interfere with glucose analysis. The other solutions were tested in the range between 700 and
2000 mg L-1 in which the global uncertainty was less
than 10%. Four solutions with glucose concentrations
close to 770 mg L-1 and four other solutions with average
concentrations of 1605 mg L-1 were tested giving a recovery
factor of 104.0 and 99.9%, on average, respectively.
Validation of the sucrose enzymatic method
For the sucrose enzymatic method, the validation was done in a range of concentrations between 100 and
1000 mg L-1. The sucrose concentration was determined
from equation 6 and the limit of detection was 134.0 mg L-1.
The intermediate precision of this method was 0.6% (CV) and the accuracy, evaluated in terms of recovery factor, was 93.0%.
The global uncertainty (U) was also determined in a
bottom-upapproach, considering the contributions of all
the sources of error linked to the analytical procedure and can be calculated from equation 14. In this formula, the uncertainty associated to the error propagation of
the concentration formula (equation 6) ∆C/C and the
uncertainties associated to precision (U3) and accuracy (U4)
were considered.
Figure 3. Global uncertainty for glucose enzymatic method.
(14)
Equations 15 and 16 were obtained considering the
volume errors (∆V) associated to the dilutions in the
sample preparations and to errors associated to the final
absorbance (∆Afinal). The final absorbance was limited by
the errors associated to the sample blank (∆Asample) and to
reagent blanks (∆Asb, ∆Agarb and ∆Asarb).
(15)
(16)
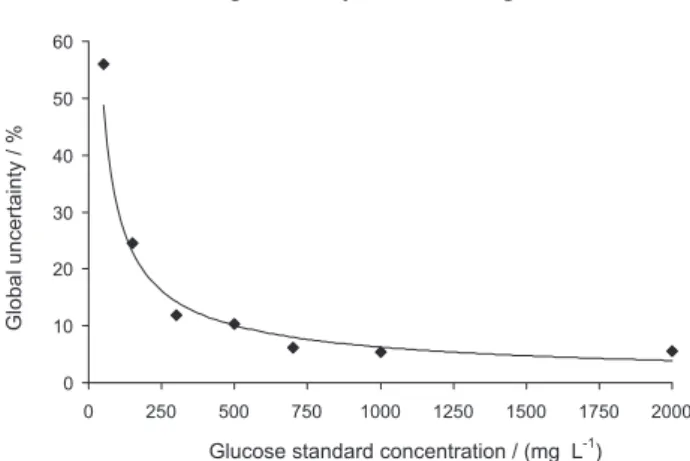
Figure 4 presents the relative weight of each individual source of uncertainty in sucrose analysis. The uncertainty associated to the error propagation of the concentration
formula is crucial for the lowest concentration
levels. The influence of U1* decreased with the increase
of the sucrose standard concentration. The influences of
precision (U3), and, mainly, of the accuracy (U4) increased
for the higher concentration of sucrose.
In Figure 5, the global uncertainty presents lower values (less than 3%) for all the analysis range (between 100 and
1000 mg L-1).
Comparing the glucose and the sucrose enzymatic method, the glucose method has a larger range of
analysis (50-2000 mg L-1) and a smaller limit of detection
(39.5 mg L-1). However, the sucrose method has a smaller
global uncertainty (less than 3%) for all the analytical range
(100-1000 mg L-1).
A similar study regarding the effect of chitosan was made for sucrose. One solution without sucrose was used
to evaluate if the chitosan gave any kind of response with this methodology. A similar conclusion to the glucose case was obtained. Several solutions with average sucrose
concentrations of 645 and 1000 mg L-1 were tested giving a
recovery factor, of 99.7 and 98.1%, on average, respectively.
Glucose enzymatic method versus glucose HPLC-ELSD method
The HPLC-ELSD method was developed by
Estevinho et al.26 for samples with chitosan and glucose.
These authors minimized the effect of the chitosan interactions by using a gradient programme with acetonitrile:water as eluent and special procedures between runs, for a total time of analysis of 20 min. The validation of the analytical methodology showed a linear response between 50 and
500 mg L-1, with coefficient of correlation of 0.999 and limit
of detection of 10.7 mg L-1. Global uncertainty associated
with the results was 4.1%, on average.
Some samples were analyzed by the two methods (enzymatic and HPLC-ELSD). Results of glucose in simulated samples obtained by the validated enzymatic method were compared with those obtained by HPLC-ELSD (Table 3).
The concentration selected to compare the two analytical methods was limited by the analytical range
of the HPLC-ELSD method (50-500 mg L-1) and by the
Figure 5. Global uncertainty for sucrose enzymatic method.
Figure 4. The relative contribution of the uncertainty sources on different calibration levels in the sucrose enzymatic method.
Table 3. Glucose concentration in samples containing chitosan given by the two methods (enzymatic and HPLC-ELSD)
Sample
(chitosan and glucose)
HPLC method / (mg L-1)
Enzymatic method / (mg L-1)
1 334.1 347.4
2 341.9 341.6
high values of the global uncertainty obtained for low concentrations of glucose for the enzymatic method
(for glucose concentrations less than 150 mg L-1, the
uncertainty values increased significantly to values higher than 25%.). By these reasons, the comparison was made
for concentrations near 300 mg L-1.
The results obtained by the two methods are very similar. The HPLC method was developed for a more
restricted range (50-500 mg L-1), presenting a smaller limit
of detection (10.7 mg L-1).
The enzymatic method for glucose presented higher values of global uncertainty than the HPLC method. However, the enzymatic method has the advantage of avoiding the problems found in the chromatographic column provoked by the mucoadhesive properties of chitosan. The use of the HPLC method has high costs involved with acquisition and maintenance of the equipment, and acquisition of solvents and columns. The enzymatic methods have smaller costs involved with the equipment. The most expensive part in the application of the enzymatic method is the acquisition of the enzymes/ enzymatic solutions.
The enzymatic method is also more flexible and simple in the utilization, allows a large number of sample analyses in a small period of time and presented less operational problems.
The applicability of the enzymatic method on the analysis of glucose/sucrose in complex chitosan samples proved to be a good option.
Conclusions
The presented enzymatic methods intended to be used as a fast way of determining the glucose and sucrose contents in solutions with chitosan.
Glucose method was developed in the range of
concentrations between 50 to 2000 mg L-1, with a limit
of detection of 39.5 mg L-1. The intermediate precision
was 26.9% (CV), on average, and the accuracy, expressed by the percentage of recovery, was 102.6%. The global uncertainty was less than 10% for concentration levels
between 700 and 2000 mg L-1.
Sucrose method was applied in the range of sucrose
concentrations between 100 and 1000 mg L-1, with a limit of
detection of 134.0 mg L-1. The intermediate precision of this
method was 0.6% (CV), the accuracy, evaluated in terms of recovery factor, was 93.0% and the global uncertainty showed values less than 3% for all concentration levels analyzed.
The enzymatic method proved to be more suitable than HPLC, mainly if a high volume of samples needs to be
analyzed, because chitosan has mucoadhesive properties that create stability problems in the chromatographic columns.
Acknowledgements
The authors wish to thank RAR - Refinarias de Açúcar Reunidas, S. A. (Porto, Portugal), for the financial support of this work and Fundação para a Ciência e a Tecnologia (FCT) for the scholarship SFRH/BDE/15649/2007.
References
1. Kumar, M. N. V. R.; React. Funct. Polym. 2000, 46, 1.
2. Mi, F.-L.; Wong, T.-B.; Shyu, S. -S.; Chang, S.-F.; J. Appl. Polym. Sci. 1999, 71, 747.
3. Guliyeva, Ü.; Öner, F.; Özsoy, Ş.; Haziroğlu ,R.; Eur. J. Pharm. Biopharm. 2006, 62, 17.
4. Aranaz, I.; Mengíbar, M.; Harris, R.; Paños, I.; Miralles, B.; Acosta, N.; Galed, G.; Heras Á.; Curr. Chem. Biol. 2009, 3,
203.
5. Bodmeier, R.; Eur. J. Pharm. Biopharm. 1997, 43, 1.
6. Skaugrud, O.; Sargent, G. In Chitin and Chitosan: Crustacean Biopolymers with Potential. In Making Profits out of Seafood
Wastes; Keller, S., ed.; Alaska Sea Grant College Program:
USA, 1990.
7. Muzzarelli, R.; Orlandini, F.; Pacetti, D.; Carbohydr. Polym.
2006, 66, 363.
8. Zhou, K.; Xia, W.; Zhang, C.; Yu, L.; LWT -- Food Sci. Technol.
2006, 39, 10, 1087.
9. Kanatt, S. R.; Chander, R.; Sharma, A.; Food Chem. 2008, 106, 521.
10. Aiedeh, K.; Gianasi, E.; Orienti, I.; Zecchi, V.;
J. Microencapsulation 1997, 14, 567.
11. Alaxakis, T.; Boadi, D. K.; Quong, D.; Groboillot, A.; O’Neill, L.; Poncelet, D.; Neufeld, R. J.; Appl. Biochem. Biotechnol. 1995, 50, 93.
12. Jameela, S. R.; Misra, A.; Jayarishnan, A.; J. Biomat. Sci. Polym. Ed. 1994, 6, 621.
13. Jameela, S. R.; Jayakrishnan, A.; Biomaterials 1995, 16, 769.
14. Ko, J. A.; Park, H. J.; Park, Y. S.; Hwang, S. J.; Park, J. B.;
J. Microencapsulation 2003, 20, 791.
15. Lim, L. Y.; Wan, L. S. C.; Thai, P. Y.; Drug Dev. Ind. Pharm.
1997, 23, 981.
16. Siso, M. I. G.; Lang, E.; Carrenõ-Gómez, B.; Becerra, M.; Espinar, F. O.; Méndez, J. B.; Process Biochem. 1997, 32, 211.
17. Gade, V. K.; Shirale, D. J.; Gaikwad, P. D.; Savale, P. A.; Kakde, K. P.; Kharat, H. J.; Shirsat, M. D.; React. Funct. Polym. 2006, 12, 1420.
19. Beilmann, B.; Langguth, P.; Häusler, H.; Grass, P.;
J. Chromatogr., A 2006, 1107, 204.
20. Schiller, M.; Heydt, H. V. D.; März, F.; Schmidt, P. C.;
J. Chromatogr., A 2002, 968, 101.
21. Bento, L. S. M.; Sá, S.; Carbohydr. Polym. 1998, 37, 257. 22. Estevinho, B. N.; Ferraz, A.; Rocha, F.; Santos, L.; Alves, A.;
J. Sep. Sci. 2009, 32, 3116.
23. Karlsson, G.; Winge, S.; Sandberg, H.; J. Chromatogr., A2005, 1092, 246.
24. Nogueira, L. C.; Silva, F.; Ferreira, I. M. P. L. V. O.; Trugo, L. C.; J. Chromatogr., A 2005, 1065, 207.
25. Wei, Y.; Ding, M.-Y.; J. Chromatogr., A 2000, 904, 113.
26. Estevinho, B. N.; Ferraz, A.; Rocha, F.; Alves, A.; Santos, L.;
Anal. Bioanal. Chem. 2008, 391, 1183.
27. Skoog, D. A.; Leary, J. L.; Principles of Instrumental Analysis, 4th ed.; Saunders College Publishing: New York, USA, 1992.
28. Garbelotti, M. L.; Marsiglia, D. A. P.; Torres, E. A. F. S.; Food Chem. 2003, 83, 469.
29. Liu, L.; Hood, S.; Wang, Y.; Bezverkov, R.; Dou, C.; Datta, A.; Yuan, C.; Clin. Biochem. 2008, 41, 576.
30. Woollard, D. C.; Indyk, H. E.; Woollard, G. A.; Food Chem.
1997, 59, 325.
31. Zhou, J. Y.; Prognon, P.; J. Pharm. Biomed. Anal. 2006, 40, 1143.
32. Ellison, S. L. R.; Rosslein, M.; Williams, A.; Eurachem/CITAC
Guide: Quantifying Uncertainty in Analytical Measurement,
1st ed.; Eurachem: Teddington: UK, 1995.
Submitted: June 28, 2012