Brazilian Journal of Physics, vol. 34, no. 2A, June, 2004 455
Galaxy Luminosity Function: A New Analytic Expression
J. S. Alcaniz
1,2and J. A. S. Lima
21Departamento de F´ısica, Universidade Federal do Rio Grande do Norte, C.P. 1641, 59072-970, Natal-RN, Brasil
2Instituto de Astronomia, Geof´ısica e Ciˆencias Atmosf´ericas, Universidade de S˜ao Paulo,
Rua do Mat˜ao, 1226, Cidade Universit´aria, 05508-900, S˜ao Paulo, SP, Brazil
Received on 17 January, 2003
We propose a new analytic approximation for the luminosity function of galaxies. The suggested expression behaves like the Schechter function at the faint end (φ ∼ L
α
) but departs considerably at the bright end (L >> L∗). We argue here that such a behavior may provide a better fit for the current observational data than does the Schechter function. Its practical interest is stressed by considering roughly the data set provided by the Stromlo-APM redshift survey. Implications on the estimates of the matter density parameter from mass-to-light ratio are also briefly discussed.
The galaxy luminosity function (GLF) is a key quan-tity for any study of galaxy evolution and one of the most important astrophysical tools in practical cosmology. It de-scribes the distribution of galaxies with different intrinsic lu-minositiesL(or magnitudesM), and since the main source of data coming from the distant past is provided by the light emitted (or scattered) by ordinary matter, the GLF also sup-plies the primary information about the baryonic content of the Universe.
Over the years, many attempts have been done for deter-mining the shape of the GLF (Zwicky 1957; Kiang 1961; Abell 1965; Arakelyan & Kalloglyan 1975). Such stud-ies culminated with an elegant analytic form proposed by Schechter (1976) which nowadays is usually referred to as the general Schechter luminosity function. In the introduc-tion of his popular paper, Schechter also emphasized some of the main applications of the GLF (see also Felten 1977; 1985; Sandageet al.1979; Binggeliet al.1988). In the field of cosmology, this quantity is essential to determine evolu-tionary effects on the galaxy number counts (Loh & Spillar 1986; Yoshi & Takahara 1988); to analyze the spatial dis-tribution of galaxies from redshift surveys (da Costaet al.
1988; Efstathiouet al. 1988; Lovedayet al. 1992; Blan-ton et al. 2001); to constrain models of galaxy formation (Frenket al.1988); to study statistics of gravitational lenses (Fukugita & Turner 1991; Kochanek 1996); and since al-most all galaxy surveys are limited by apparent magnitude, an estimate of the GLF is also of fundamental importance for the analysis of the large-scale structure in the Universe (Efstathiou 1997). In the last few years, a considerable ef-fort has also been invested in determining the shape of the GLF for different morphologies or spectral types as well as any dependence it may have on environment (Binggeliet al.
1988; Willmer 1997; Marzkeet al. 1998; Christlein 2000; Madgwicket al.2001).
The galaxy luminosity function,φ(L), is defined by the differential expressiondn(L) = φ(L)dL, wheredn(L)is the number of galaxies per unit volume with luminosity in the rangeLtoL+dL. The luminosity function of galaxies can be fitted by a Schechter-type distribution
φ(L)dL=φ∗
L
L∗ α
exp
−L L∗
d
L
L∗
, (1)
whereL∗ is the characteristic luminosity,αis an arbitrary pure number andφ∗is a normalization parameter whose di-mension is the number density of galaxies. This expression has not been deduced from first principles, and as such, the free parameters must be determined from astronomical ob-servations. As widely known, all these parameters are sen-sitive on the kind of galaxy being sampled.
Let us now consider the following luminosity distribu-tion
φ(L)dL=φ∗
L L∗
α
1−(η−1)L
L∗ η−11
d
L L∗
,
(2) whereη is a new adjustable dimensionless parameter. This expression has been chosen so that in the limitη → 1 the standard Schechter expression is recovered. Formally, this result follows directly from the known identitylimd→0(1 +
dy)d1 = exp(y)(Abramowitzet al. 1972). Therefore, for generic values ofη = 1, the new GLF is a product of two power laws instead of an exponential multiplied by a power law.
For values ofη > 1, the positiviness of the argument appearing in the second power factor of (2) defines natu-rally a maximum value for the absolute luminosity, namely
Lmax = L∗/(η−1). The existence of this cut-off implies
456 J.S. Alcaniz and J.A.S. Lima
22 20 18 16 6 4 2
log
10
φ
(M)
η = 0.7 η = 0.92 η = 1.0 η = 1.1 η = 1.2
22 20 18 16
M
η = 0.7 η = 0.95 η = 1.0 η = 1.1 η = 1.2
22 20 18 16
η = 0.7 η = 0.95 η = 1.0 η = 1.1 η = 1.2 All Galaxies
E/S0 Galaxies
Sp/Irr Galaxies
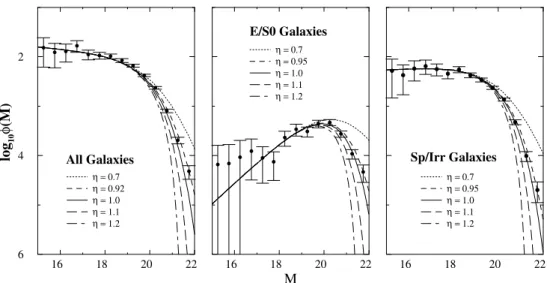
Figure 1. Luminosity function from the Stromlo-APM redshift survey. Fits in the three panels are to (a) the full galaxy sample, (b) the early-type subsample, and (c) the late-type galaxy subsample. The solid curves show Schechter function (η= 1). The dotted lines in each panel show how the fits change for the selected values ofηwith the other parameter assuming the same values estimated in the quoted reference. In all these cases, the exponential Schechter function is a critical curve within a large class of possible power law distributions. Curves withη >1fall off before the exponential while those withη <1fall more slowly.
value ofη >1decreases faster than the standard Schechter function. However, in the complementary range (η ≤ 1) which which includes in particular the Schechter form for
η = 1, one may see that the cut-off is absent. The extended GLF approaches zero at the bright end more slowly than the Schechter distribution which is defined in terms of the exponential function. Note also that for low luminosities (L << L∗), the Schechter function and the new distribu-tion present exactly the same behavior determined by the slope parameterα(φ∼Lα). This means that the family of
η-distributions proposed here essentially alters the behav-ior of the Schechter function at high luminosities. In other words, a given value of the slope parameterαcan now be matched to a large class of asymptotic approaches to the bright end, which is described by a continuous parameter
η. Conversely, for a givenηfitting the bright end of a given sample, the freedom onαstill remains available at the faint end. In this way, the low and high-Ldomains are now play-ing a more symmetrical role in the sense that both are free to be conveniently adjusted. It should be noticed that a “quasi-Schechter” exponential behavior can be readily obtained for
ηslightly different from unity.
In point of fact, astronomers prefer a magnitude repre-sentation for the GLF becauseφ(M)is more directly related to observations thanφ(L). In terms of magnitude the new distribution reads:
φ(M)dM = 0.921φ∗100.4(M∗−M)(α+1)
(3)
× 1−(η−1)100.4(M∗−M)
1
η−1
dM,
whereM∗ is a fiducial magnitude (defined byL∗) which yields the position of the knee appearing in the logφ(M)
curves whose inclinations (at the faint end) are determined by the possible values ofα. As an initial step, our aim here is to show that the proposed expression may be a more conve-nient approximation for the galaxy luminosity function than the usual Schechter function. In what follows, the features of this new function will be discussed more quantitatively in connection with the data set provided by the Stromlo-APM redshift survey (Lovedayet al1992).
In Fig. 1 we display thelog10φ(M)-M plane based on
the extended GLF for some selected values of theη parame-ter corresponding to: (a) the full sample of galaxies, (b) the early-type subsample (E/SO), and (c) the late-type galaxy subsample (Sp/Irr). In each picture, solid lines account for the best-fitting provided by a pure Schechter function (η = 1) whose parameters were determined using two dif-ferent estimators by Lovedayet al.(1992). The dotted lines show how the Schechter fit changes for the selected values ofηwith the remaining parameters assuming the same val-ues estimated in the quoted reference. In all these cases, the exponential Schechter function is a critical curve within a large class of possible power law distributions. Curves with
η >1fall off before the exponential while those withη <1 fall off more slowly. As remarked before, all curves coin-cide at low luminosities (φ ∼Lα) regardless of the values
assumed by theηparameter1.
At this point we analyze to what extent theη param-eter changes the estimates of the matter density in the Uni-verse. This question is a natural one because theηparameter appearing in the extended luminosity function modifies the mean luminosity density. It should be recalled that the rel-ative contribution of the dark matter component in a given scale is usually specified by the M/L ratio in the blue band.
Brazilian Journal of Physics, vol. 34, no. 2A, June, 2004 457
0.6 0.8 1.0 1.2 1.4
0.0 0.1 0.2 0.3 0.4
0.6 0.8 1.0 1.2 1.4
0.0 0.1 0.2 0.3 0.4
0.6 0.8 1.0 1.2 1.4
0.0 0.1 0.2 0.3
0.40.6 0.8 1.0 1.2 1.4
0.0 0.1 0.2 0.3 0.4
α = −1.11
M* = −19.50
α = −1.11
M* = −19.57
α = −1.11
M* = −19.80
α = −1.11
M* = −20.0
Density matter parameter
η parameter
Mass−to−light ratio ~ 300h
(a) (c)
(b) (d)
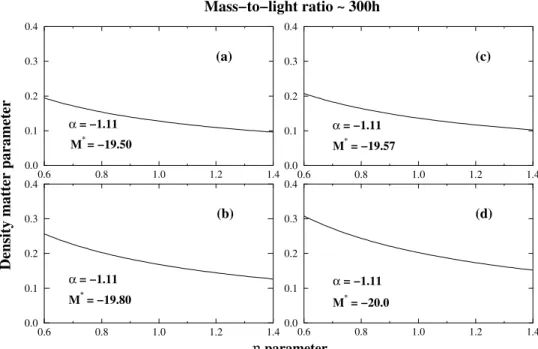
Figure 2. Mass-to-light ratio and the density parameter. The four panels show the dependence ofΩmas a function the indexηfor some selected values ofM∗. Note that in the four panels, theαparameter assumes a fixed value whileM∗is slightly varied. They show that for a fixed value ofηthe value ofΩmincreases withM∗. In all panels we see that smaller values ofηlead to greater values ofΩm. This overall behavior holds regardless of the values assumed by the parametersαandM∗.
Typically, for the largest virialized systems (rich clusters of galaxies) this ratio (in solar units, M⊙/L⊙), falls on the interval M/L ∼ 300±100h (Carlberget al. 1996; Bachall 2000; Wilsonet al. 2001). Parenthetically, this re-sult still remains in agreement with the first measurements from the Coma cluster for which M/L ∼ 300h(Zwick 1933), and seems to be rather independent of the veloc-ity dispersion and other intrinsic parameters. Fixing this value for the mass-to-light ratio, Ωm can be estimated
as-suming that all the galaxies share the sameM/Lratio and that mass traces light on large scales. In this case, a sub-sequent integration over the observed luminosity density yieldsΩm ≃0.2(Bachall 2000). When combined with the
inflationary paradigm (ΩTotal = 1), such a result means that
nearly 80% of the mass in the Universe cannot be associated to the presence of galaxies. How is this result affected by theηparameter?
In order to answer this question we first observe that for values ofη ≥1andη ≤1, the mean luminosities per unit volume are given, respectively, by
Lη≥∞ =
Lmax
o
Lφ(L
L∗)d(
L L∗) =
= φ∗L∗Γ(α+ 2) Γ(
1
η−1)
(η−1)α+3Γ(α+ 3 + 1
η−1)
,
(4)
Lη≤∞ = ∞
o
Lφ(L
L∗)d(
L L∗) =
= φ∗L∗Γ(α+ 2) Γ(
1
1−η −α−2)
(1−η)α+2Γ( 1 1−η)
, (5)
whereΓis the usual gamma function. As one may check, by considering the identitylim|z|→∞z−aΓ(a + z)/Γ(z) = 1 (Abramowitzet al. 1972), the standard resultL = Γ(α+ 2)φ∗L∗ (see, for instance, Peebles 1993) is readily recov-ered as a limiting case of the above expressions (η → 1). Thus, since the critical mass density of the Einstein-de Sit-ter model isρcrit= 2.78×10¹¹h2M⊙Mpc−3, the mass-to-light ratio required to close the Universe can easily be found by combiningρcritandL.
In Fig. 2 we fixM/L = 300hM⊙/L⊙ (Bahcall 2000) andφ∗ = 1.12×10⁻²hMpc−3(Lovedayet al. 1992) and
displayΩmas a function of the indexη. In the four
pan-els, the parameterαhas been fixed by the value obtained for the pure Schechter function whileM∗is slightly varied. We see that for a fixed value ofηthe value ofΩmincreases
withM∗. For instance, for η = 0.91andM∗ = −19.50 we findΩm ≃ 0.13whereas for the same value ofη and
M∗=−19.80we haveΩ
m≃0.19. As a general behavior
we see that the smaller the values ofηthe greater the values ofΩm.
458 J.S. Alcaniz and J.A.S. Lima
shape parameters will appear in a forthcoming communi-cation.
Acknowledgments
This work was partially suported by the Conselho Nacional de Desenvolvimento Cient´ıfico e Tecnol´ogico (CNPq), CNPq (62.0053/01-1-PADCT III/Milenio), Pronex/FINEP (no. 41.96.0908.00) and FAPESP (00/06695-0)
References
[1] G.O. Abell, ARA&A,3, 1 (1965).
[2] M. Abramowitz & I. A. StegunHandbook of Mathematical Functions, Dover, NY, 1972.
[3] M.A. Arakelyan & A.T. Kalloglyan, Soviet Astr. Astron.13, 953 (1975).
[4] N.A. Bahcall, Phys. Rep333, 233 (2000).
[5] B. Binggeli, A. Sandage, & G.A. Tammann ARA&A,26, 509 (1988).
[6] M.R. Blantonet al., Astron. J.121, 2358 (2001).
[7] R.G. Calberget al., Astrop. J.462, 32 (1996).
[8] D. Christlein, Astrop. J.545, 145 (2000).
[9] L.N. da Costa, P.S. Pellegrini, W.L.W. Sargent, J. Tonry, M. Davis, A. Meiksin, & D.W. Latham, Astrop. J. 327, 544 (1988).
[10] G. Efstathiou, inCosmologie et structure `a grande ´echelle, Eds. R. Schaeffer, J. Silk, M. Spiro, & J. Zinn-Justin, Else-vier, 133, 1997.
[11] G. Efstathiou, R.S. Ellis, & B.A. Peterson MNRAS,232, 431 (1988).
[12] J.E. Felten, Astron. J.82, 861 (1977).
[13] J.E. Felten, Comm. Astrophys.11, 53 (1985).
[14] C.S. Frenket al., Astrop. J.327, 507 (1988).
[15] M. Fukugita & E.L. Turner, MNRAS253, 99 (1991).
[16] T.D. Kiang, MNRAS,122, 263 (1961).
[17] C. Kochaneck, Astrop. J.466, 638 (1996).
[18] J.A.S. Limaet al.2003, in preparation
[19] E. Loh & E. Spillar, Astrop. J.307, L1 (1986).
[20] J. Loveday, B.A. Peterson, G. Efstathiou, & S.J. Maddox, As-trop. J.390, 338 (1992).
[21] Madgwicket al.2001, MNRAS, in press, astro-ph/0107197
[22] R.O. Marzke, L.N. da Costa, P.S. Pellegrini, C.N.A. Willmer, & M.J. Geller, Astrop. J.503, 617 (1998).
[23] P.J.E. Peebles. 1993, Principles of Physical Cosmology, Princeton UP, 1993.
[24] A. Sandage, G.A. Tamman, & A. Yahil, Astrop. J.232, 352 (1979).
[25] P.L. Schechter, Astrop. J.203, 297 (1976).
[26] C.N.A. Willmer, Astron. J.114, 898 (1997).
[27] G. Wilson, N. Kaiser & G.A. Luppino, Astrop. J.556, 601 (2001).
[28] Y. Yoshii & F. Takahara, Astrop. J.326, 1 (1988).
[29] F. Zwicky, Morphological Astronomy, Berlin: