Vertical and temporal dynamics of phytoplanktonic associations
and the application of index assembly in tropical semi-arid
eutrophic reservoir, northeastern Brazil
Dinâmica vertical e temporal de associações fitoplanctônicas e aplicação do índice de
assembleia em reservatório eutrófico tropical semi-árido, nordeste do Brasil
Pryscila Cynara Soares Vieira1, Maria Marcolina Lima Cardoso2
and Ivaneide Alves Soares da Costa1
1Laboratório de Microbiologia Aquática, Departamento de Microbiologia e Parasitologia, Centro de Biociências, Universidade Federal do Rio Grande do Norte – UFRN, Campus Universitário, s/n, BR 101,
Lagoa Nova, CEP 59072-000, Natal, RN, Brazil e-mail: [email protected]; [email protected]
2Laboratório de Ecologia Aquática, Departamento de Ecologia, Centro de Biociências, Universidade Federal do Rio Grande do Norte – UFRN, Campus Universitário, s/n, BR 101, Lagoa Nova,
CEP 59072-000, Natal, RN, Brazil e-mail: [email protected]
Abstract:Aim: To determine the composition and biomass of functional groups around the vertical and temporal gradient correlated with environmental conditions and apply the index Q in a water-supply reservoir. Methods: Water samples were collected monthly (n = 92) between 2009 and 2011 in two points of the dam for physicochemical and biological analysis. Results: The pH, dissolved oxygen and water temperature showed significant differences between the photic and aphotic zones (p<0.05). The vertical variation of dissolved oxygen and water temperature, showed a profile of stratification. The phytoplankton community was represented by 11 functional groups: S1, M, H1, Lo, P, F, SN, J, W2, MP and R. Conclusions: The vertical variations were less pronounced than the temporal variations in the phytoplankton community. The Q index pointed out poor water quality, corresponding to the current state of eutrophication in the reservoir and it was sensitive to responsive to environmental and hydrodynamic changes in these systems, demonstrating to be an appropriate tool for monitoring and evaluating the quality of water in tropical semi-arid reservoirs.
Keywords: phytoplankton functional groups; stratification; Q index; reservoir; Cyanobactaria.
Resumo:Objetivo: determinar a composição e a biomassa dos grupos funcionais nos gradientes vertical e temporal, correlacionando com as condições ambientais e aplicar o índice Q num reservatório usado para abastecimento humano. Métodos: Amostras de água foram coletadas mensalmente (n=92) entre 2009 e 2011, em dois pontos do reservatório para análises físicoquímicas e biológicas. Resultados: O pH, oxigênio dissolvido e temperatura da água apresentaram diferenças significativas entre as zonas eufótica e afótica (p<0.05). A variação vertical do de oxigênio dissolvido e temperatura da água, mostrou um perfil de micro-estratificação. A comunidade fitoplanctônica foi representada por 11 grupos funcionais: S1, M, H1, Lo, P, F, SN, J, W2, MP e R. Conclusões: Variações verticais foram menos pronunciadas do que as variações temporais na comunidade fitoplanctonica. O índice Q apontou má qualidade da água, que corresponde ao estado atual da eutrofização no reservatório e foi sensível a capacidade de resposta às mudanças ambientais e hidrodinâmicas do reservatório, mostrando ser um instrumento adequado para monitoramento de reservatórios em região tropical semi-árido.
Many reservois in the semi-arid region in northeastern Brazil are eutrophic and eventually hypereutrophic (Bouvy et al., 1999, 2000; Eskinazi-Sant´Anna et al., 2006; Panosso et al., 2007; Sousa et al., 2008; Costa et al., 2009). An important morphometric characteristic of reservoirs in semi-arid regions is the high ratio between the drainage basin and the area of the reservoir itself (Thornton & Rast, 1993), together with a negative balance between precipitation and evaporation rates, these factors affect several ecological processes in these ecosystems (Sousa et al., 2008). This means that they tend to have high concentrations of nutrients, suspended solids and salts, favoring eutrophication, siltation and salinization (Sousa et al., 2008).
This condition is favorable and affects the structure of the phytoplankton and zooplankton communities in this region (Eskinazi-Sant´Anna et al., 2013; Dantas et al., 2012; Costa et al., 2009; Sousa et al., 2008). The occurrence of different phytoplankton populations with pronounced vertical variation in biomass and dominance of cyanobacteria, are generally influenced by the synergy between the mixing regime and nutrients, especially nitrate, as well as hydrology, temperature, and light (Huszar et al., 2000; Bouvy et al., 1999, 2000, 2001, 2003; Moura et al., 2007; Costa et al., 2006b; 2009).
Historical data on the reservoir Armando Ribeiro Gonçalves revealed increasing eutrophic conditions (Costa et al., 1998, 2006a, b; 2009; Vieira et al., 2011; Sousa et al., 2008), constant occurrences of hepatotoxic cyanobacteria as Microcystis aeruginosa (Kützing) Kützing,
Planktothrix agardhii (Gomont) Anagnostidis & Komárek, Cylindrospermopsis raciborskii
(Woloszynska) Seenayya & Subba Raju and,
Anabaena circinalis Rabenhorst ex Bornet & Flahault (Costa et al., 1998, 2006a, b, 2009) and zooplankton community dominated by rotifers and copepods (Eskinazi-Sant’Anna et al., 2007, 2013). However, studies on temporal and vertical scales of the of phytoplanktonic functional groups and Q index to assess the quality of water bodies using these groups have not yet been carried out in this reservoir. We hypothesized that the trophic state, rainy and dry seasons, affect the phytoplankton dynamics, because of the availability of light and nutrients, turbidity, precipitation and water retention. It was also hypothesized that phytoplankton is a good bioindicator of the ecological status in a semi-arid water-supply reservoir.
1. Introduction
The phytoplankton community is the focus of biological data when it comes to eutrophication effects for multiple reasons such as the rapid response along the increase in nutrients availability and the strong influence that this community composition has on the quality of water (Reynolds, 1998, 2006). The physical structure of the environment and the availability of nutrients are the most important variables likely to influence phytoplankton communities (Reynolds, 1980). During its annual dynamics, phytoplankton undergoes various successional stages, and its composition can reach the equilibrium at shorter or longer periods (Padisák et al., 2003). According to Salmaso (2003), temporal changes in the composition of phytoplankton may represent a complex environmental gradient of annual succession. Studies have shown how the environment and the increase or decrease of a number of different factors, culminating in the dominance of cyanobacteria (Reynolds, 2006; Bonilla et al., 2012; Bouvy et al., 2003), influences the spatial and temporal distribution of phytoplankton and its patterns. Several studies have attempted to explain the success of cyanobacteria in freshwater ecosystems, with different environmental characteristics (Kosten et al., 2012; Romo et al., 2012; Costa et al., 2009; Molica & Azevedo, 2009; Fernandes et al., 2009).
Reynolds et al. (2002) used environmental factors to establish a functional classification able to reflect these species ecology. However, in a review by Padisák et al. (2009), the phytoplankton species were grouped into 38 assemblies, designated by alphanumeric codes, based on their survival strategies, tolerances and sensitivities.
In these terms, we attempted to investigate how environmental conditions during the dry and rainy seasons affect the dynamics of functional groups between the photic and aphotic zones, and applied the Q index for water quality evaluation. We believe in the potential of the assemblage Index (Q) as a promising tool in assessing the ecological status of the reservoirs in the semi-arid regions, offering an important contribution to understanding the ecology of the phytoplankton and to demand environmental monitoring programs for bioindicators in this region.
2. Material and Methods
2.1. Study area
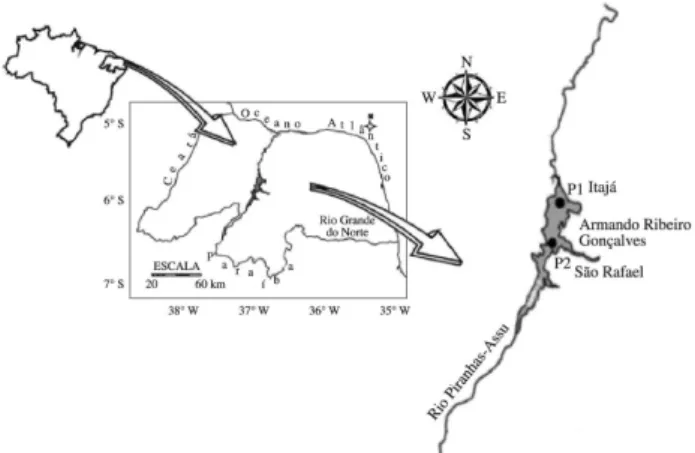
The present study was carried out in the Armando Ribeiro Gonçalves (ARG) Dam, (05° 14’ 30” S and 36° 43’ 00” W) located in the Brazilian Northeast, of in the state of Rio Grande do Norte, fully inserted in the semi-arid region and intensely subjected to constant water deficits with average annual rainfall ranging from 400 to 800mm (Figure 1). It is the largest reservoir for irrigation in Latin America (19,200ha) and supplies up to 79.6% of the total volume of water in the state, enabling human consumption for more than 400 000 inhabitants. It has maximum storage capacity of 2.4 million m3, average depth of
12.3 meters, maximum depth of 40 meters, and it is surrounded by agricultural and urban areas. This system was warm water and eutrophic polymictic standard as well as high mean water retention (3.6 years) (Costa et al., 2009). This system is an important water supply for human consumption, and also for irrigation, since it is used for agrocivil, aquaculture, recreational and industrial activities and domestic supply.
2.2. Sampling and abiotic variables
Water samples (n = 92) were collected monthly from April 2009 to October 2011, covering both the dry and rainy seasons, at two points along the longitudinal axis of the reservoir (Figure 1): P1 (lentic and deeper region), located in the city of Itajá and P2 (region of semi-lentic transition), located in the city of São Rafael. The samples were collected at each point at six different depths throughout the water column; three of them were collected in the euphotic zone while the other three were collected in the aphotic zone. Subsequently, the water samples were integrated to form a single representative rate for each compartment aphotic and euphotic from each point.
In each sampling, the transparency of the water column was estimated by the Secchi disk depth extinction. Vertical profiles of turbidity, temperature, hydrogen potential (pH), dissolved oxygen concentration and electric conductivity were performed with multiparameter probe. The photic zone (Zeuf) was calculated as three times the water transparency measured by Secchi disc (Cole, 1994) and the Zeuf/Zmax ratio was used as an index of light availability in the water column (Jensen et al., 1994).
Concentrations of total nitrogen and total phosphorus in the water were obtained by spectrophotometry according to APHA (2000) recommendations. The determination of total phosphorus was reached by the method of ascorbic acid after the samples digestion with potassium persulphate and total nitrogen by oxidation of nitrogen compounds to nitrate, according to Valderrama (1981).
For chlorophyll-a determination, 250ml samples were filtered on filter Whatman 934-AH 25 mm diameter, with the aid of a filtration ramp
and a vacuum pump. Extraction was carried out with 10 ml of 100% ethanol overnight (Lorenzen, 1967). The concentrations were determined spectrophotometrically (665 and 750nm) according to the method of Jespersen & Christoffersen (1987). The reservoirs’ trophic state was obtained using the index proposed by Carlson trophic modified (Toledo Junior, 1990) for tropical environments.
2.3. Phytoplankton analysis and Assemblage Index (Q)
Samples for phytoplankton composition determination were collected in vertical and horizontal hauls with a plankton net (20 µM) and fixed with 4% formaldehyde. Aiming species quantification, samples were collected with Van Dorn bottles and preserved with Lugol solution. The quantification followed Utermöhl (1958) and the count of individuals (cells, colonies and filaments) occurred in random fields, with error lower than 20%, confidence coefficient of 95% as Lund et al. (1958) criteria. The number of fields varied among samples and count completion was considered when the 100th individual from the dominant species was count. For samples with phytoplankton bloom, the count continued until the 400th, following the same criterion, for a 10% environment error (Chorus & Bartram, 1999).
The biovolume was obtained by geometric approximation, multiplying each species density by its mean cell volume, considering, whenever possible, the average size of 30 individual samples of each species (Hillebrand et al., 1999).
Phytoplankton functional groups were defined according to Reynolds et al. (2002) and Padisák et al. (2009) for species that contributed to at least 5% of biovolume on at least one sample. These species were considered as dominant.
The index assembly (Q) developed by Padisák et al. (2006) was used to assess the environmental status of the reservoir, considering the following 5 degrees classification: 0-1: bad; 1-2 tolerable; 2-3; medium; 3-4: good and 4-5: excellent.
2.4. Statistical analyses
A Principal Component Analysis (PCA) was used to ordinate the 92 sample units and 12 abiotic variables (volume, output, water retention, TP, TN, TN/TP, pH, conductivity, dissolved oxygen, temperature, water transparency and precipitation) with the purpose of reducing the dimensionality of the data and describing the relationship between
these variables. From the PCA, a linear correlation matrix was performed of the abiotic variables to determine spatial and temporal conditions of the abiotic variables.
A Canonical Correspondence Analysis (CCA) was performed in order to evaluate the relationship between the functional groups phytoplankton and abiotic variables analyzed. Abiotic data and chlorophyll-a were standardized to exclude the effects of measuring units and prepare them to be used in PCA and CCA. For that purpose, data was transformed (ln x+1) to adjust the criteria of normality and homogeneity of variance. To eliminate variables we used the results of PCA and Spearman correlation between abiotic variables.
A covariance analysis (ANCOVA) was performed, using the rain index as the co-variable, to detect if the differences among abiotic variables and chlorophyll-a between both aphotic and photic zone were influenced by the preciptation. In order to compare the differences between these variables, the ANOVA bi-fatorial was conducted. We permormed a logistic regression model (similar to the linear regression model, but the response variable is binary) with the purpose of reducing effects of zeros in the data of the biomass of functional groups. The logistic regression was used to identify significant variations these groups according to rainfall data and both aphotic and photic zone, and to adjust the criteria of homogeneity of variance. Therefore, the biovolume data is processed on presence and absence and applied regression. Calculations of the probability occurrence were carried out using the follwing Equation 1:
∑
= − β + β
+ 0 i i
1
P(X) ( X )
1 e (1)
Where P (X) is the probability of occurrence of the functional group to the X event, β0 and βi are parameters to be estimated from sample data. From this, all zeros are excluded and held a generalized linear model (GLM), with Gamma function, for relations that were significant. All analysis were performed in R (1.15.0) software.
3. Results
3.1. Abiotic variables
transparency, and hypereutrophic considering the values of phosphorus and chlorophyll-a.
High concentrations of total phosphorus and total nitrogen, chlorophyll-a, total biomass phytoplankton and low water transparency also high temperature were observed in the two points in the
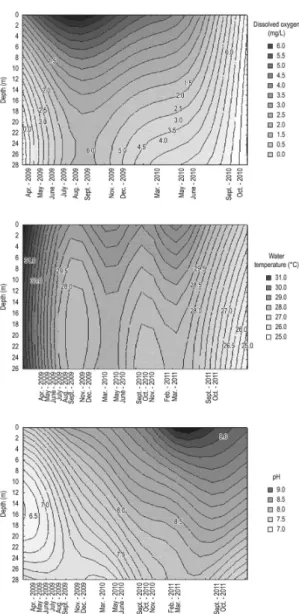
reservoir (Table 1). The hottest months occurred during the rainy season, which always happened in the first half of the studied years. Average monthly precipitation ranged from 0.0 mm to 253.2 mm. The pH, dissolved oxygen and water temperature were significantly different between the photic and aphotic zone and were higher in the photic zone. The thermal pattern of the water column showed seasonal microstratification with differences below 1 °C from 5 meters deep on, during the rainy season (May-June).
The vertical variation of the water temperature ranged at about 1 °C between the photic and aphotic zones. Temporal variation reached 4 °C, with minimum of 27 °C and maximum of 31 °C. The distribution pattern was the type profile clinograde with oxygen deficit at the bottom of the reservoir. Oxycline from 10 meters depth was observed during the rainy season (May-June) in the two years of study (Figure 3). The highest dissolved oxygen concentrations were measured in July 2009, when a Microcystis aeruginosa bloom occurred. The reservoir’s chemical characteristics were directly influenced by high algal productivity during the bloom, which coincided with the highest values of total phosphorus, and one of the lowest values of water transparency (Table 1).
ANCOVA analysis, using the pecipitation as covariable, was conducted to detect the differences
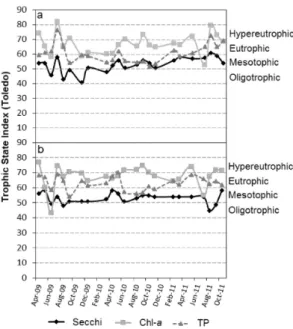
Figure 2. The Modified Carlson’s Trophic State Index (Toledo Junior, 1990), showing the temporal variation of transparency (Secchi), chlorophyll-a (CHL) and Total phosphorus (TP) for points 1 (a) and 2 (b) at Armando Ribeiro Gonçalves reservoir between 2009 and 2011.
Table 1. Mean and standard deviaton of the abiotic and biotic variables in the Armando Ribeiro reservoir between 2099 and 2011.
Itajá São Rafael
Photic Zone Aphotic Zone Photic Zone Aphotic Zone
Med (± dp) Med (±dp) Med (±dp) Med (±dp)
Volume (m3) 2.105.855.048
(236.827.824)
-2.105.855.048
(236.827.824)
-Output (m3 s–1) 18.8 (2.9) - 18.8 (2.9)
-Water retention (years) 3.6 (0.4) - 3.6 (0.4)
-Zm (m) - 25 (2.4) - 19 (3.2)
Transparency (m) 0.9 (0.4) - 0.9 (0.2)
-Preciptation (mm) 139.7 - 85.1
-Conductivity (µS.cm–1) 119.7 (45.2) 14.1 (3.8) 123 (45.5) 14.4 (3.6)
pH 8.6 (0.7) 7.8 (0.6) 8.5 (0.7) 7.9 (0.5)
Water temperature (°C) 30.9 (7.7) 28.2 (0.9) 29.2 (1.2) 28.5 (1) TN (µg.L–1) 577.1 (251.6) 669.3 (222) 771.4 (349.3) 783.7 (329.2) TP (µg.L–1) 92.8 (47.7) 87.1 (36.3) 103.3 (30.2) 100.7 (20.7)
TN/TP (µg.L–1) 7.6 (4.4) 9.2 (6.3) 8.1 (3.8) 8.2 (4.2)
D i s s o l v e d O x y g e n (mg.L–1)
4.6 (2.3) 3.0 (1.6) 5.1 (2.6) 3.6 (1.9)
Chlorophyll a (µg.l–1) 48.0 (36.7) 41.5 (26) 47.2 (22.5) 35.5 (17.3)
Q Index 0.2 (0.5) 0.2 (0.5) 0.5 (1.0) 0.1 (0.3)
To t a l p h y t o p l a n k t o n biomass (mm3.l–1)
38.4 (31.0) 22.1 (22.1) 30.3 (31.5) 22.1 (15.8)
among abiotic variables and chlorophyll-a between both aphotic and photic zone showed that the temperature varied between both aphotic and photic zone and their difference was greater with increased by the rainfall (Table 2).
The availability of light in the water column, expressed by transparency in the Zeu:Zmax ratio, showed, at point 1, an average transparency of 0.9 m, ranging between 0.5 m and 2 m during the sample period, indicating high turbidity. The photic zone (Zeuf) reached a maximum of 6 m deep, not reaching the bottom of the reservoir in any of the samplings. The Zeu:Zmax ratio was also reduced ranging from 6 to 27%. The largest value was recorded in November 2009. At point 2, the transparency values ranged between 0.6 and 1.5m, a
Figure 3. Diagram of depth and time isoclines of dis-solved oxygen (mg.L¯¹), water temperature (°C) and pH at point 1 at Armando Ribeiro Gonçalves Reservoir.
Table 2. ANCOVA synthesis to detect if the differ-ences among abiotic variables and chlorophyll-a between both aphotic and photic zones were influenced by the preciptation.
Preciptation Zone
Variável F P F P
TP 0.031 ns 0.274 ns
TN 0.725 ns 0.597 ns
TN/TP 1.435 ns 0.135 ns
pH 1.775 ns 20.76 *
Conductivity 0.534 ns 0.951 ns Dissolved Oxygen 1.035 ns 9.304 * Water temperature 5.34 * 15.6 * Chlorophyll a 0.018 ns 2.56 ns *Significant values (TN= Total Nitrogen; TP= Total Phosphorus; TN/TP= ratio of Total Nitrogen e Total Phosphorus)
similar pattern as found in point 1, average values of 0.9 m. The photic zone (Zeuf) reached a maximum at 4.5m depth, also not reaching the bottom of the reservoir in any of the samplings. The Zeu:Zmax ratio was reduced as well, ranging between 8 and 23%.The highest value was recorded in August 2009 (Table 1).
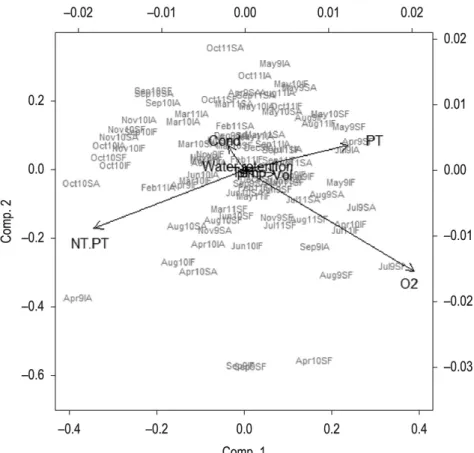
In the PCA analysis, the two first axis together explained 72, 9% of the total variance of the abiotic variables data. The first axis explained 51, 5% of the variance of the data, whereas the second axis explained 21, 4% of this variance. The correlation of the abiotic variables were calculated and showed that most significant negative correlation with the first axis were the concentrations TN, TN/TP ratio, whereas the highest positive correlations were the concentrations dissolved oxygen and TP, water volume and output. The second axis showed a strong positive correlation with the concentration dissolved oxygen, followed by the ratio TN/TP and conductivity (Table 3). It can be observed in the ordination diagram that the sample did not show zone grouping patterns (photic and aphotic) or collection point (Itajá and San Rafael), only a few grouping of months (Figure 4).
3.2. Phytoplankton functional groups
The phytoplankton community was represented by 63 taxonomic categories and identified 11 functional groups: S1, M, H1, Lo, P, F, SN,
J, W2, MP and R, with mean values of total
Phytoplankton functional groups biomass ranging between 22 mm3.l–1 and 38 mm3.l–1 during the
phytoplankton in both samples from the two points. Cyanobacteria were represented by six functional groups (S1, H1, Lo, SN and M and R)
(Table 4). Among the groups, the S1, represented by cyanobacteria Planktothrix agardhii, was the most
Table 3. Correlation coefficients between abiotic variables and the three PCA first axes.
Axis 1 Axis 2 Axis 3
Volume -0.65* -0.10 -0.05 Output 0.45* -0.15 -0.14 Water retention 0.04 0.11 0.14
TP 0.67* 0.22* 0.65*
TN -0.45* -0.21* 0.58*
TN/TP -0.86* -0.46* 0.19
pH 0.04 -0.08 0.39*
Conductivity -0.15 0.31* 0.48* Dissolved Oxygen 0.76* -0.63* 0.00 Water temperature 0.22* -0.17 -0.04 *Significant values (TN= Total Nitrogen; TP= Total Phosphorus; TN/TP= ratio of Total Nitrogen e Total Phosphorus)
Figure 4. Principal Components Analysis (PCA) of abiotic variables (Cond. = conductivity; NT= total nitrogen; pH= hydrogen potential; PT= total phosphorus; Runoff = Output; Water retention= residence time; Vol. = volume; O2= dissolved oxygen; NT.PT= ratio of Total Nitrogen e Total Phosphorus) at Armando Ribeiro Gonçalves Reservoir from April 2009 to October 2011. (figure codes follow the order: month, year, point (I= Itajá; S= San Rafael), Zone (A for aphotic and F for photic).
adapted to the environmental conditions of the reservoir, and represented more than 90% of total biovolume in the first month of the study (Apr/09). From May 2009 on, its relative contribution decreases sharply, reaching 0% between June to August 2009. After that, this biovolume went through some oscillations rising to achieve stability from June 2010 through the end of the study (Oct/11), reaching 97.5% of the total biovolume. The Spearman test (p<0.05) conducted on the biovolume of the S1 group and abiotic variables showed a significant negative correlation with volume (r=-0.35) and dissolvid oxigen (r=-0.40), and a positive correlation with TN/TP (r=0.46). The
M Group, formed by the cyanobacteria Microcystis aeruginosa and Sphaerocavum brasiliense Azevedo & C.L.Sant’Anna, was also very representative in the reservoir. Its highest biovolume values occurred while S1 group was less representative in the phytoplankton – from June to September 2009. The S1 group showed the opposite from the functional group M, which demonstrated significant positive correlation with the volume of the reservoir (r = 0.26), TP (r = 0.44), dissolvid oxigen O2 (r = 0.53) and negative correlation with TN (r = -0.21), TN/TP (r = -0.22), pH (r = -0.24) and conductivity (r = -0.28).
The H1 group was represented by Anabaena circinalis and Aphanizomenon gracile (Lemmermann) Lemmermann species, which were presented only in March and April 2010. This group showed correlation with TN/TP and dissolvid oxigen (r = -0.20 and r = 0.20, respectively).
The group SN, which was represented only by
Cylindrospermopsis raciborskii was present from September 2009 to February 2011, notably in March 2010, when it was dominant and contributed to 42% to the total biovolume in phytoplankton. It showed highest negative correlation with volume, output, TP and dissolvid oxigen, and was positive correlated with TN and TN/TP.
Coelosphaerium evidentermarginatum P. Azevedo & C. L. Sant’Anna was the most representative of the Lo group, and its contribution was relatively higher in December 2009 (42% of biovolume). The R group (represented by Planktothrix mougeotii,
Anagnostidis & Komárek) was unrepresentative, with quantitative data only in the first month of the study (Apr/09). Lo, J and R revealed no significant correlation with any variable studied.
The J, P and F groups were not very prominent and were represented by one species each (Coelastrum microporum, Nägeli in A. Braun, Closterium kuetzingii var. onychosporum West & G.S.West and Botryococcus braunii Kütz, respectively) all chlorophytes. The group P revealed positive correlation with volume and output and was negative correlated with TN and pH. The funcional group F revealed similar pattern to group P.
The euglenophytes were represented by
W2 Group, formed by Trachelomonas Ehrenberg.
Its representation increased in May 2009, and was a negative correlated with total nitrogen, TN/TP ratio and pH. The MP Group, formed by the diatom
Cocconeis sp. Ehrenberg, contributed little to the
Table 4. Main Phytoplankton species with their taxonomic biomass and functional groups, and respective F for the Armando Ribeiro Gonçalves reservoir between 2009 and 2011.
Funcional
group Phytoplankton species Taxonomic Group
F (Factor)
Biomass (mm3.l–1)
funcional groups*
M Microcystis aeruginosa Cyanobacteria 0 3.1
Sphaerocavum brasiliense Cyanobacteria 0
H1 Aphanizomenongracile Cyanobacteria 1 0.5
Anabaena circinalis Cyanobacteria 1
S1 Planktothrix agardhii Cyanobacteria 0 19.4
Lo Coelosphaerium
evidentermarginatum
Cyanobacteria 5 0.13
SN Cylindrospermopsis raciborskii Cyanobacteria 0 1.3
R Planktothrix mougeotii Cyanobacteria - 0.10
P Closterium kuetzingii Chlorophyceae 5 0.18
J Coelastrum microporum Chlorophyceae 1 0.01
F Botryococcus braunii Chlorophyceae 5 0.18
MP Cocconeis sp. Bacillarophyceae 5 0.01
W2 Trachelomonas sp. Euglenophyceae 0 0.02
total biovolume throughout the study and pH was the only variable correlated with it (r = -0.24).
The functional groups did not show significant variation of the occurrence and biovolume between the photic and aphotic zones, according to the results of model logistic regression. However, the functional groups S1 and SN showed significant variation with precipitation (p = 0.035 and
p = 0.004, respectively). The functional group
S1 occurred in both periods of rain and drought.
The functional group SN increased the occurrence probability (74%) with reduced rainfall. The generalized linear model (GLM) results indicated that although the groups S1 and SN have shown significant variation with rainfall data regarding its presence and absence, the biovolume was not significantly associated with rainfall (p = 0.203 and
p = 0.373, respectively) (Table 5).
The results of the CCA indicate that the first two axes of the ordination explained 95.2% of the total variance effect on functional groups. The most significant variables on the first axis were dissolved oxygen, total nitrogen and conductivity. The pH, water retention, output and total phosphorus were the strongest significant on the second axis (Figure 6). The functional groups M, H1, M, W2,
R, P, Lo, J and MP showed stronger correlation
on the first axis and were positively correlated with dissolved oxygen, total phosphorus and output. Negative correlation was observed to total nitrogen and conductivity. The group SN was associated to
increased water retention and reduced pH and TP. Table 6 shows that all the relationships on both axes were considered significant by the permutation test in the first two axes (F=44.2; p<0.01 and F=5. 23; p<0.02, respectively).
3.3. The assemblage index (Q)
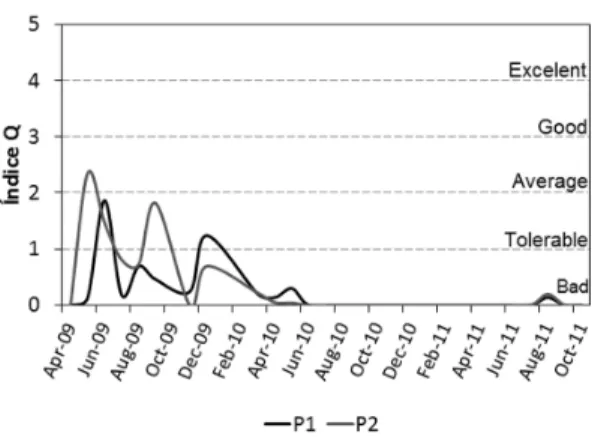
The results of the system’s ecological state evaluation by the Q index showed poor water quality for the two investigated points (Figure 7). The factor F weights for each functional group identified appear in Table 4. The evaluation of point 1 ranged between tolerable and bad ratings, being tolerable in June 2009, which was characterized by
a more equitable distribution of biovolume among
S1, M, H1, Lo, P, J and SN groups. From June 2010 on, the Q index application revealed bad rates, influenced by the dominance of the functional group S1, represented by Planktothrix agardhii. Point 2 showed results ranging from average rates to poor. The average stage occurred at the beginning
Table 5. Results of Model Logistics Regression (GLM) to identify variations between zones (aphotic and photic) and precipitation (season rain) in the presence and absence of functional groups. Only significant values are shown.
Season rain (precipitation)
Zone (photic and aphotic)
Phytoplakton funcional group β Std. Error p-value β Std. Error p-value
S1 0.295 0.140 0.035 0.164 0.573 0.774
SN -0.324 0.115 0.004 -0.200 0.448 0.654
Figure 6. Canonical Correspondence Analysis (CCA) ap-plied to abiotic (Cond.= condutivity; TN= total nitrogen; pH= hydrogen potential; TP= total phosphorus, Output; O2= dissolved oxygen; Water retention=residence time and functional groups (S1, M, H1, Lo, P, F, SN, J, W2, MP e R) at Armando Ribeiro Gonçalves Reservoir from April 2009 to October 2011.
of the study period (May/09), which is explained by the presence of different functional groups (M, H1,
Lo, F, SN and P). Followed by a phase that oscillated between tolerable and bad (June - Dec/09). In 2010 and 2011, Point 2 was rated as poor due to higher biomass of SN, and especially S1 group.
4. Discussion
Tropical aquatic ecosystems are subject to seasonal variations that induce physical and chemical changes (Fonseca & Bicudo, 2008). A similar pattern was described by Costa et al. (2006b, 2009) and Chellappa et al. (2009) studies in this same reservoir. As expected, the rain affected the thermal pattern of the water, and temperature was higher in the photic zone during this period. As shown in other studies, meteorological phenomena like wind and rain, play an important role in the ecology of phytoplankton in reservoirs (Calijuri et al., 2002), changing the thermal pattern (Dantas et al., 2011). The rain raises the level of water systems, causes sediment resuspension reducing the availability of light and algal biomass, generating changes in the composition of the different algae associations
in tropical systems (Dantas et al., 2008). On the other hand, higher algal biomass levels occur when the reservoirs’ volume is low and these algae are favored by the thermal movement of nutrients and resuspension (Arfi, 2005).
Change in water temperature and dissolved oxygen allowed the definition of a vertical profile based on the mixing conditions of the reservoir. The high temperatures recorded contributed to microstratifications occurrence, condition in which small differences in temperature (<0.5°C) provide significant variations in the density of water (Payne, 1986). It is assumed that the stratification period for dissolved oxygen is due to the low flow and little mixing of water masses in the limnetic region. It is also assumed that the destratification of dissolved oxygen is due to the high flow, promoting homogenization along the water column. The same explanation applies to the temperature behavior along the depth. In places with frequent changes in wind direction, a permanent destratification occurs, especially in shallow water bodies (Von Sperling, 1999), changing the daily standard stratification.
Temperature is a key parameter for understanding the dynamics of aquatic systems to be determinant in ecological maintenance, its variation with depth (occurrence of thermal stratification), for example, can be used to characterize the structure of the physical characteristics of the reservoirs (Alcântara & Stech, 2011). Temperature has a vertical behavior that affects the availability of light and nutrients, and is determinant to phytoplankton seasonal dynamics (Becker et al., 2009). Von Sperling (1999) points out that the study of the reservoir’s circulation and stratification dynamics, as well as its connection with the morphometric and hydrological characteristics of a lake or reservoir is essential for a basic understanding of the water body structure and a better understanding of the way morphometric parameters act on the aquatic ecosystem functioning.
Cyanobacteria dominated the phytoplankton community in the Armando Ribeiro reservoir. The predominance of one particular group is generally related to environmental conditions such as nutrient concentration, geographic location and morphology of ecosystems (Moura et al., 2007). Many factors, such as temperature, light, the ability to regulate position in the water column, reduced tolerance to underwater light and high pH, affinity for phosphorus, low affinity for nitrogen, dominating in systems with reduced ratio of total phosphorus and nitrogen, as well as the ability to fix molecular
Table 6. CCA synthesis for 7 abiotic variables and func-tional groups of the first two axes and their respective cumulative proportions of the variance explained.
Axis 1 Axis 2
Proportion Explained 0.851 0.108 Cumulative proportion 0. 851 0.952 Biplot scores for constraining variables
pH -0.360 -0.745
Water retention 0.095 0.288
TN -0.569 -0.117
TP 0.510 -0.580
Dissolved Oxygen 0.762 -0.352
Condutivity -0.495 0.089
Output 0.382 -0.440
Functional Groups Scores
S1 -0.364 -0.072
M 1.082 -0.240
H1 0.336 0.085
Lo 0.279 0.177
J 0.239 0.210
P 0.506 0.324
F 0.460 0.065
SN -0.015 0.388
R 0.311 0.142
W2 0.266 0.224
MP 0.233 0.208
nitrogen, resistance to predation and microbiological interactions may be involved in the ecological success of cyanobacteria (Bouvy et al., 2001; Becker et al., 2009; Bittencourt-Oliveira et al, 2010; Dantas et al., 2011; Dolman et al., 2012; Kosten et al., 2012).
The temporal variation of phytoplankton was, as a whole, characterized by the replacement of cyanobacterial species. From April/09 to May/09 there was a dominance of Planktothrix agardhii (group S1). From June to September 2009 species from group M were highlighted (Microcystis aeruginosa and Sphaerocavum brasiliense). These two species are morphologically close because they form large colonies, differing from each other due to the characteristics of hollow colonies presented by S. brasiliense. M. aeruginosa as one of the most cited species in eutrophic reservoirs in northeastern Brazil (Dantas et al., 2008, 2011; Bittencourt-Oliveira et al., 2010; Moura et al., 2011) and one of the most important species of the phytoplankton community in this reservoir (Costa et al., 2006b, 2009; Chellappa et al., 2009; Câmara et al., 2009). Although S. brasiliense has not appeared in the same proportion as M. aeruginosa, it was also among the descriptors species of the community. The two taxa have similar ecological requirements, since they were accommodated in the same functional group M by Reynolds et al. (2002) and Padisák et al. (2006), by having buoyancy control that enables migration in the water column, causing tolerance to the fluctuations in stratification and mixing in low-latitude environments.
From October/09 Microcystis aeruginosa density was gradually diminished and a more diverse population was established with some cyanobacterial species co-existence (groups S1, SN, M, Lo, and H1), this period lasted until May/10. Crossetti & Bicudo (2008) have reported that destratification is related to a change in algal structure, with other cyanobacteria replacement of the same group. In research conducted by Dantas et al. (2011), the destratification hindered the formation of algal blooms and increased competition between species.
The next phase was characterized by the
Planktothrix agardhii dominance and codominance of Cylindrospermopsis raciborskii and occurred in the end of 2010. These filamentous cyanobacteria species commonly form blooms in eutrophic freshwaters reservoirs and share certain physiological characteristics that allow them to flourish in similar environmental conditions (Bonilla et al., 2012). Although C. raciborskii have not appeared in the
same abundance as P. agardhii, it was also among the descriptor species of the community and the two taxa, although belonging to different functional groups present some similar ecological attributes such as sensitivity to flow, and are typical in mixed environments tolerant to lack of light conditions.
The biomass of the species and community composition varies in terms of stratification and destratification (Dantas et al., 2008; Bittencourt-Oliveira et al., 2011). In these studies,
Cylindrospermopsis raciborskii dominated during stratification, and was replaced by Planktothrix agardhii during destratification. Borics et al. (2000) reported the replacement of C. raciborskii by
P. agardhii with the disappearance of C. raciborskii
followed by reductions in water temperature. In this work, the presence of SN group represented by
C. raciborskii, was negatively associated with the volume, output, and total phosphorus and dissolved oxygen, and positively linked with total nitrogen and TN/TP ratio. This codon is adapted to hot mixed environments, being tolerant to conditions of light and nutrients deficit, and it is sensitive to flow. This may explain the negative relationship with output, volume and total phosphorus.
On February 2011, there was a strong predominance of Planktothrix agardhii, which persisted until the end of the study. Thus, the study indicated P. agardhii as a phytoplankton keystone species in Armando Ribeiro reservoir during the two and a half years of study. It was among the most frequent species, reaching greater dominance and superseding other taxa throughout the year 2011, and influenced the patterns of diversity throughout the study period. The negative correlation in group S1 with the volume and dissolved oxygen can be explained by the fact that this codon only includes cyanobacteria adapted to mixed turbid environments, low light, and when the water volume of the reservoir increases, turbidity decreases. In turbid environments, oxygen is generally low explaining the inverse relationship.
increased densities of P. agardhii (Moura et al., 2007).
The P group showed positive correlation with the volume and output and a negative correlation with total nitrogen and pH. This group is found in continuous or semi-continuous mixed layer of 2–3 m in thickness habitats, and higher trophic states (Padisák et al., 2009). The
F group showed similar correlation pattern to the P group, except for one factor that had a positive correlation with this codon, the dissolved oxygen. It is typical of deeply bright mixed mesotrophic environments (Padisák et al., 2009), tolerating low nutrient concentrations and high turbidity (Reynolds et al., 2002). Dantas et al. (2011) studying two reservoirs in Pernambucano semiarid, found that during periods of destratification, other divisions of algae coexisted with cyanobacteria, especially during periods of thermal instability.
Some phytoplankton groups such as euglenoids, were present throughout the study period, though in small proportions. The W2 Group had negative correlation with total nitrogen, TN/TP ratio and pH. This codon is found in meso-eutrophic ponds, even temporary (Padisák et al., 2009; Reynolds et al., 2002), maybe this could explain the negative relationships found. The pH was the only variable correlated with MP group, the individuals in this group are often found in turbid shallow lakes frequently stirred up, inorganic (Padisák et al., 2006, 2009).
Similarly to that reported by Crossetti & Bicudo (2008), the Q index satisfactorily reflected the changes in phytoplankton composition, presenting inversely proportional values to the dominance of functional groups M, SN, S1. Padisák et al. (2006),
demonstrating that the Q index does not give preference to any particular human impact which greatly increases the application fields. These authors discussing the use of the Q index applied to a shallow lake in Hungary with assessment categories based on algal biomass published by Mischke (2003) concluded that the answers provided by the Q index were more realistic than the biomass and chlorophyll-a.
In this study, as in Crosseti & Bicudo (2008), the Q index presented good results as a trophic index, indicating that phytoplankton can be successfully used as an indicator of ecological status in monitoring processes of the reservoirs in the semi-arid regions. The perfect functioning of the Q index in water quality determination through phytoplankton groups in Armando Ribeiro
Gonçalves Reservoir, which is an impacted deep tropical system, suggests the need for studies in other tropical systems with characteristic functional groups in order to improve their evaluation.
The phytoplankton functional groups approach was important to complement information on characteristic taxa adaptation and tolerance of semiarid reservoirs and represented the first application of the Assemblage Index to northeastern Brazil. In this study, it reaveled dominance of species adapted to turbid, warm and eutrophic environments as functional groups S1 and SN. The tendencies proclaimed in this study indicated in general that the vertical variations were less pronounced than the temporal variations in the populations of cyanobacteria and phytoplankton community.
In summary, the Q index pointed bad ecological conditions, corresponding to the current state of eutrophication in the Armando Ribeiro Gonçalves reservoir and it was sensitive and responded adequately to the environmental and hydrodynamic changes in these systems, indicating its appropriateness as a tool for monitoring and evaluating the quality of tropical semi-arid water reservoirs.
Acknowledgements
The authors thank CAPES (Coordenação de Aperfeiçoamento de Pessoal de Nível Superior) for the financial support given to Pryscila Vieira and to the Project PROCAD/NF (Cooperação Acadêmica/ Novas Fronteiras), through a partnership between the PRODEMA/UFRN (Programa de Pós-Graduação em Desenvolvimento e Meio Ambiente/ Universidade Federal do Rio Grande do Norte) and PPGRN/UFCG (Programa de Pós-graduação em Recursos Naturais/Universidade Federal de Campina Grande). CNPq (Conselho Nacional de Desenvolvimento Científico e Tecnológico), the resources allocated to CT-HIDRO/CT-SAÚDE (576887/2008-0) Project: Water and Health in Semi-Arid Region.
References
ALCÂNTARA, E.H. and STECH, J.L. Desenvolvimento de modelo conceitual termodinâmico para o reservatório hidrelétrico de Itumbiara baseado em dados de satélite e telemétricos. Ambiente & Água, 2011, 6(2), 157-179.
ARFI, R. Seasonal ecological changes and water level variations in the Sélingué Reservoir (Mali, West Africa). Physics and Chemistry of the Earth, 2005, 30(6-7), 432-441. http://dx.doi.org/10.1016/j. pce.2005.06.010.
BECKER, V., HUSZAR, V.L.M. and CROSSETTI, L.O. Responses of phytoplankton functional groups to the mixing regime in a deep subtropical reservoir.
Hydrobiologia, 2009, 628(1), 137-151. http://dx.doi. org/10.1007/s10750-009-9751-7.
BITTENCOURT-OLIVEIRA, M.C., SANTOS, D.M. and MOURA, N.A. Toxic cyanobacteria in reservoirs in northeastern Brazil: detection using a molecular method. Brazilian Journal of Biology, 2010, 70(4), 1005-1010. http://dx.doi.org/10.1590/S1519-69842010000500012. PMid:21180905
BITTENCOURT-OLIVEIRA, M.C., MOURA, A.N., HEREMAN, T.C. and DANTAS, E.W. Increase in straight and coiled Cylindrospermopsisraciborskii
(Cyanobacteria) populations under conditions of thermal destratification in a shallow tropical reservoir. Journal Water Resource and Protection, 2011, 3(04), 245-252. http://dx.doi.org/10.4236/ jwarp.2011.34031.
BONILLA, S., AUBRIOT, L., SOARES, M.C.S., GONZÁLEZ-PIANA, M., FABRE, A., HUSZAR, V.L.M., LÜRLING, M., ANTONIADES, D., PADISÁK, J. and KRUK, C. What drives the distribution of the bloom-forming cyanobacteria Planktothrix agardhii and Cylindrospermopsis raciborskii? FEMS Microbiology Ecology, 2012, 79(3), 594-607. http://dx.doi.org/10.1111/j.1574-6941.2011.01242.x. PMid:22092489
BORICS, G., GRIGORSZKY, I., SZABÓ, S. and PADISÁK, J. Phytoplankton associations in a small hypertrophic fishpond in East Hungary during a change from bottomupto top-down control.
Hydrobiologia, 2000, 424(1), 79-90. http://dx.doi. org/10.1023/A:1003948827254.
BOUVY, M., FALCÃO, D., MARINHO, M., PAGANO, M. and MOURA, A. Occurrence of Cylindrospermopsi (Cyanobacteria) in 39 Brazilian tropical reservoirs during the 1998 drought. Aquatic Microbial Ecology, 2000, 23, 13-27. http://dx.doi. org/10.3354/ame023013.
BOUVY, M., MOLICA, R., OLIVEIRA, S., MARINHO, M. and BEKER, B. Dynamics of a toxic cyanobacterial bloom (Cylindrospermopsis raciborskii) in a shallow reservoir in the semiarid region of northeast Brazil. Aquatic Microbial Ecology, 1999, 20(3), 285-297. http://dx.doi.org/10.3354/ ame020285.
BOUVY, M., PAGANO, M. and TROUSSELLIER, M. Effects of a cyanobacterial bloom (Cylindrospermopsis raciborskii) on bacteria and zooplankton communities in Ingazeira reservoir (northeast Brazil). Aquatic
Microbial Ecology, 2001, 25(3), 215-227. http:// dx.doi.org/10.3354/ame025215.
BOUVY, M., NASCIMENTO, S.M., MOLICA, R.J.R., FERREIRA, A., HUSZAR, V. and AZEVEDO, S.M.F.O. Limnological features in tapacurá reservoir (northeast Brazil) during a severe drought. Hydrobiologia, 2003, 493(1-3), 115-130. http://dx.doi.org/10.1023/A:1025405817350. CALIJURI, M.C., SANTOS, A.C.A. and JATI, S.
Temporal changes in the phytoplankton community structurein a tropical and eutrophic reservoir (Barra Bonita, S.P. – Brazil). Journal of Plankton Research, 2002, 24(7), 617-634. http://dx.doi.org/10.1093/ plankt/24.7.617.
CÂMARA, F.R.A., LIMA, A.K.A., ROCHA, O. and CHELLAPPA, N.T. The role of nutrient dynamics on the phytoplankton biomass (chlorophyll-a) of a reservoir-channel continuum in a semi-arid tropical region. Acta Limnologica Brasiliensia, 2009, 21(4), 431-439.
CATHERINE, A., QUIBLIER, C., YÉPRÉMIAN, C., GOT, P., GROLEAU, A., VINÇON-LEITE, B., BERNARD, C. and TROUSSELLIER, M. Collapse of a Planktothrix agardhii perennial bloom and microcystin dynamics in response to reduced phosphate concentrations in a temperate lake. FEMS Microbiology Ecology, 2008, 65(1), 61-73. http:// dx.doi.org/10.1111/j.1574-6941.2008.00494.x. PMid:18462398
CHELLAPPA, N.T., CÂMARA, F.R. and ROCHA, O. Phytoplankton community: indicator of water quality in the Armando Ribeiro Gonçalves reservoir and Pataxó channel, Rio Grande do Norte, Brazil. Brazilian Journal of Biology, 2009, 69(2), 241-251. http://dx.doi.org/10.1590/S1519-69842009000200003. PMid:19675924
CHORUS, I. and BARTRAM, J. Toxic cyanobacteria in water: a guide to the public health consequences, monitoring and management. London: E & FN Spon, 1999.
COLE, G.A. Textbook of limnology. Illinois: Waveland Press, 1994.
COSTA, I.A.S., CHELLAPPA, N.T. and ARAÚJO, M.F.F. Estudo do fitoplâncton da barragem Engenheiro Armando Ribeiro Gonçalves, Assu-RN.
Acta Limnologica Brasiliensia, 1998, 10(1), 67-80. COSTA, I.A.S., SANTOS, A.P., SILVA, A.A.L.,
MELO, S.G., PANOSSO, R.F. and ARAÚJO, M.F.F. Floração de Algas Nocivas: ameaça às águas Potiguares. Revista Fundação de Apoio a Pesquisa do Rio Grande do Norte, 2006a, 1(4), 14-16.
northeast Brazil. Brazilian Journal of Biology, 2006b, 66(1), 29-41.
COSTA, I.A.S., CUNHA, S.R.S., PANOSSO, R.F., ARAÚJO, M.F.F., MELO, J.L.S. and ESKINAZI-SANT’ANNA, E.M. Dinâmica de cianobactérias em reservatórios eutróficos do semi-árido do Rio Grande do Norte. Oecologia Brasiliensis, 2009, 13(2), 382-401.
CROSSETTI, L.O. and BICUDO, C.E.M. Adaptations in phytoplankton life strategies to improsed change in shallowurban tropical eutrophic reservoir, Garças Reservoir over 8 years. Hydrobiologia, 2008, 614(1), 91-105. http://dx.doi.org/10.1007/s10750-008-9539-1.
DANTAS, E.W., MOURA, A.N., BITTENCOURT-OLIVEIRA, M.C., ARRUDA NETO, J.D.T. and CAVALCANTI, A.D.C. Temporal variation of the phytoplankton community at short sampling intervals in the Mundaú reservoir, Northeastern Brazil. Acta Botanica Brasilica, 2008, 22(4), 970-982. http:// dx.doi.org/10.1590/S0102-33062008000400008. DANTAS, Ê.W., MOURA, A.N. and
BITTENCOURT-OLIVEIRA, M.C. Cyanobacterial blooms in stratified and destratified eutrophic reservoirs in semi-arid region of Brazil. Anais da Academia Brasileira de Ciencias, 2011, 83(4), 1327-1338. http:// dx.doi.org/10.1590/S0001-37652011000400019. PMid:22146960
DANTAS, E.W., BITTENCOURT-OLIVEIRA, M.C. and MOURA, A.N. Dynamics of phytoplankton associations in three reservoirs in northeastern Brazil assessed using Reynolds’ theory. Limnologica, 2012, 42(1), 72-80. http://dx.doi.org/10.1016/j. limno.2011.09.002.
DOLMAN, A.M., RÜCKER, J., PICK, F.R., FASTNER, J., ROHRLACK, T., MISCHKE, U. and WIEDNER, C. Cyanobacteria and cyanotoxins: the influence of nitrogen versus phosphorus. PLoS ONE, 2012, 7(6), e38757. http://dx.doi.org/10.1371/ journal.pone.0038757. PMid:22719937
ESKINAZI-SANT ’ANNA, E.M., PANOSSO, R.F., ATTAYDE, J.L., COSTA, I.S., ARAUJO, M., SANTOS, C.M. and MELO, J.L.S. Águas Potiguares: oásis ameaçados. Ciência Hoje, 2006, 231, 1-5.
ESKINAZI-SANT’ANNA, E.M., MENEZES, R., COSTA, I.S., PANOSSO, R.F., ARAÚJO, M.F. and ATTAYDE, J.L. Composição da comunidade zooplanctônica em reservatórios eutróficos do semi-árido do Rio Grande do Norte. Oecologia Brasiliensis, 2007, 11(3), 410-421. http://dx.doi.org/10.4257/ oeco.2007.1103.10.
ESKINAZI-SANT’ANNA, E.M., MENEZES, R., COSTA, I.S., ARAÚJO, M., PANOSSO, R. and ATTAYDE, J.L. Zooplankton assemblages in eutrophic reservoirs of the Brazilian semi-arid.
Brazilian Journal of Biology, 2013, 73(1), 37-52. http://
dx.doi.org/10.1590/S1519-69842013000100006. PMid:23644787
FERNANDES V.O., CAVATI B., OLIVEIRA L.B. and SOUZA, B.D.A.S. Ecologia de cianobactérias: Fatores promotores e consequências das florações.
Oecologia Brasiliensis, 2009, 13, 247-258.
FONSECA, B.M. and BICUDO, C.E.M. Phytoplankton seasonal variation in a shallow stratified eutrophic reservoir (Garças Pond, Brazil). Hydrobiologia, 2008, 600(1), 267-282. http://dx.doi.org/10.1007/s10750-007-9240-9.
GEMELGO, M.C.P., MUCCI, J.L. and NAVAS-PEREIRA, D. Population dynamics: seasonal variation of phytoplankton functional groups in brazilian reservoirs (Billings and Guarapiranga, São Paulo). Brazilian Journal of Biology, 2009, 69(4), 1001-1013. http://dx.doi.org/10.1590/S1519-69842009000500004. PMid:19967171
H I L L E B R A N D , H . , D Ü R S E L E N , C . - D . , KIRSCHTEL, D., POLLINGHER, U. and ZOHARY, T. Biovolume calculation for pelagic and benthic microalgae. Journal of Phycology, 1999, 35(2), 403-424. http://dx.doi.org/10.1046/j.1529-8817.1999.3520403.x.
HUSZAR, V.L.M., SILVA, L.H.S., MARINHO, M., DOMINGOS, P. and SANT ’ANNA, C . L . Cy a n o p r o k a r y o t e a s s e m b l a g e s i n eight productive tropical Brazilian waters.
Hydrobiologia, 2000, 424(1), 67-77. http://dx.doi. org/10.1023/A:1003996710416.
JESPERSEN, A.M. and CHRISTOFFERSEN, K. Measurements of chlorophyll-a from phytoplankton using ethanol as extraction solvent. Archiv fuer Hydrobiologie, 1987, 109(3), 445-454.
JENSEN, J.P., JEPPESEN, E., OLRIK, K. and KRISTENSEN, P. Impact of nutrients physical factors on the shift from cyanobacterial to clorophyte dominance in shallow Danislakes. Canadian Journal of Fisheries and Aquatic Sciences, 1994, 51(8), 1692-1699. http://dx.doi.org/10.1139/f94-170.
KOSTEN, S., HUSZAR, V.L.M., BÉCARES, E., COSTA, L.S., DONK, E., HANSSON, L.-A., JEPPESEN, E., KRUK, C., LACEROT, G., MAZZEO, N., MEESTER, L., MOSS, B., LÜRLING, M., NÕGES, T., ROMO, S. and SCHEFFER, M. Warmer climates boost cyanobacterial dominance in shallow lakes. Global Change Biology, 2012, 18(1), 118-126. http://dx.doi. org/10.1111/j.1365-2486.2011.02488.x.
LORENZEN, C.J. Determination of Chlorophyll and pheo-pigments: spectrophotometric equations.
Limnology and Oceanography, 1967, 12(2), 343-346. http://dx.doi.org/10.4319/lo.1967.12.2.0343. LUND, J.W.G., KIPLING, C. and LECREN, E.D.
by counting. Hydrobiologia, 1958, 11(2), 143-170. http://dx.doi.org/10.1007/BF00007865.
MISCHKE, U. Cyanobacteria associations in shallow polytrophic lakes: influence of environmental factors.
Acta Oecologica, 2003, 24, S11-S23. http://dx.doi. org/10.1016/S1146-609X(03)00003-1.
MOLICA, R. and AZEVEDO, S. Ecofisiologia de cianobactérias produtoras de cianotoxinas. Oecologia Brasiliensis, 2009, 13, 229-246.
MOURA, A.N., BITTENCOURT-OLIVEIRA, M.C., DANTAS, Ê.W. and ARRUDA NETO, J.D.T. Phytoplanktonic Associations: A Tool to Understand Dominance Events in a Tropical Brazilian Reservoir.
Acta Botanica Brasilica, 2007, 21(3), 641-648. http:// dx.doi.org/10.1590/S0102-33062007000300011. MOURA, A.N., DANTAS, E.W., OLIVEIRA, H.S.
and BITTENCOURT-OLIVEIRA, M.C. Vertical and temporal dynamics of cyanobacteria in the Carpina potable water reservoir in northeastern Brazil. Brazilian Journal of Biology, 2011, 71(2), 451-459. http://dx.doi.org/10.1590/S1519-69842011000300015. PMid:21755163
PA D I S Á K, J., B O R I C S, G., F E H É R, G., GRIGORSZKY, I., OLDAL, I., SCHMIDT, A. and ZÁMBÓNÉ-DOMA, Z. Dominant species and frequency of equilibrium phases in late summer phytoplankton assemblages in Hungarian small shallow lakes. Hydrobiologia, 2003, 502(1-3), 157-168. http://dx.doi.org/10.1023/ B:HYDR.0000004278.10887.40.
PADISÁK, J., BORICS, G., GRIGORSZKY, I. and SORÓCZKI-PINTÉR, É. Use of phytoplankton assemblages for monitoring ecological status of lakes within the Water Framework Directive: The assemblage index. Hydrobiologia, 2006, 553(1), 1-14. http://dx.doi.org/10.1007/s10750-005-1393-9. PADISÁK, J., CROSSETTI, L.O. and
NASELLI-FLORES, L. Use and misuse in the application of the phytoplankton functional classification: a critical review with updates. Hydrobiologia, 2009, 621(1), 1-19. http://dx.doi.org/10.1007/s10750-008-9645-0.
PANOSSO, R., COSTA, I.A.S., SOUZA, N.R., ATTAYDE, J.L., CUNHA, S.R.S. and GOMES, F.C.F. Cianobactérias e cianotoxinas em reservatórios do Estado do Rio Grande do Norte e o potencial controle das florações pela tilápia do Nilo (Oreochromis niloticus). Oecologia Brasiliensis, 2007, 11(3), 433-449. http://dx.doi.org/10.4257/oeco.2007.1103.12. PAYNE, A.L. The ecology of tropical lakes and rivers. New
York: John Wiley & Sons, 1986.
REYNOLDS, C.S. Phytoplankton assemblages and their periodicity in stratifyimg lakes systems. Holarctic Ecology, 1980, 3, 141-159.
REYNOLDS, C.S. What factores influence the species composition of phytoplankton in lakes of different throphic status? Hydrobiologia, 1998, 369(370), 11-26.
REYNOLDS, C.S., HUSZAR, V., KRUK, C., NASELLI-FLORES, L. and MELO, S. Towards a functional classification of the freshwater phytoplankton. Journal of Plankton Research, 2002, 24(5), 417-428. http://dx.doi.org/10.1093/ plankt/24.5.417.
REYNOLDS, C.S. The ecology of phytoplankton. New York: Cambridge University Press, 2006.
ROMO, S., SORIA, J., FERNÁNDEZ, F., OUAHID, Y. and BARÓN-SOLÁ, Á. Water residence time and the dynamics of toxic cyanobacteria. Freshwater Biology, 2012, 52(3), 513-522.
SALMASO, N. Life strategies, dominance patterns and mechanisms promoting species coexistence in phytoplankton communities along complex environmental gradients. Hydrobiologia, 2003, 502(1-3), 13-36. http://dx.doi.org/10.1023/ B:HYDR.0000004267.64870.85.
SOUSA, W., ATTAYDE, J.L., ROCHA, E.D.S. and ESKINAZI-SANT’ANNA, E.M. The response of zooplankton assemblages to variations in the water quality of four man-made lakes in semi-arid northeastern Brazil. Journal of Plankton Research, 2008, 30(6), 699-708. http://dx.doi.org/10.1093/ plankt/fbn032.
THORNTON, J.A. and RAST, W. A test of hypotheses relating to the comparative limnology and assessment of eutrophication in semi-arid man-made lakes. In Y. STRASKRABA, J.G. TUNDISI and A. DUNCAN, orgs. Comparative reservoir limnology and water quality management. London: Kluwer Academic Publishers, 1993, pp. 1-24.
TOLEDO JUNIOR, A.P. Informe preliminar sobre os estudos para a obtenção de um índice para a avaliação simplificada do estado trófico de reservatórios de regiões quentes tropicais. São Paulo: CETESB, 1990. Relatório Técnico.
UTERMÖHL, H. ZurVervollkommnung der quantitativen Phytoplankton-Methodik. Mitteilungen der international Vereinigung der theoretische und angewandte. Limnologie, 1958, 5, 567-596.
VALDERRAMA, J.C. The simultaneous analysis of total nitrogen and total phosphorous in natural waters.
Marine Chemistry, 1981, 10(2), 109-122. http:// dx.doi.org/10.1016/0304-4203(81)90027-X. VIEIRA, P.C.S., SILVA, A.P.C. and COSTA, I.A.S.
Variações na distribuição do fitoplâncton e em variáveis limnológicas na Barragem Armando Ribeiro Gonçalves/RN. In E.M.X. FREIRE, G. CÂNDIDO and P. VIEIRA, orgs. Múltiplos olhares sobre o semiárido brasileiro: perspectivas interdisciplinares.
Natal: EDUFRN, 2011. p. 11-35.
VON SPERLING, E. Morfologia de lagos e represas. Belo Horizonte: Segrac, 1999.