article
Zooplankton communities as eutrophication bioindicators in tropical reservoirs
Antonio Jose´ Gazonato Neto1,2, Lidiane Cristina da Silva1, Angelo Augusto Saggio1& Odete Rocha1
1
Departamento de Ecologia e Biologia Evolutiva, Universidade Federal de Sa˜o Carlos, Via Washington Luiz Km 235, CEP 13565-905, Sa˜o Carlos, SP, Brazil.
2
Corresponding author: Antonio Jose´ Gazonato Neto, e-mail:neto_gazonato@hotmail.com
GAZONATO NETO, A.J., SILVA, L.C., SAGGIO, A.A., ROCHA, O Zooplankton communities as
eutrophication bioindicators in tropical reservoirs. http://dx.doi.org/10. 1590/1676-06032014001814
Abstract:Eutrophication is a process characterized by an increase in the aquatic system productivity, which causes profound changes in the structure of its communities. Owing to the high environmental sensitivity of planktonic species, the study of their communities can indicate the deterioration of the environment. The Jaguari and Jacareı´ reservoirs are part of the Cantareira System, supplying water to Sa˜o Paulo inhabitants and that has been affected by several forms of continuous human interference. Here we analyze some properties of the zooplankton community as bioindicators of eutrophication and water quality change.In situphysical and chemical measurements were carried out, water was collected for analysis and quantitative zooplankton samples were taken at eight sites in the two reservoirs, in both seasons, dry and rainy. Species were identified and their numerical abundances and biomasses were determined and used to estimate two biological indices. The overall trophic state and zooplankton structure, the Calanoida/Cyclopoida ratio and the k-dominance curves were associated with the disturbance levels, mainly represented by nutrient river inputs and by water level fluctuations. The Jaguari Reservoir was more eutrophicated than the Jacareı´ Reservoir, as evidenced by the obtained indices values. The zooplankton community properties used as indicators of the reservoir trophic state were useful monitoring tools.
Keywords: zooplankton, ABC curves, Calanoida/Cyclopoida ratio, Cantareira System, environmental impact.
GAZONATO NETO, A.J., SILVA, L.C., SAGGIO, A.A., ROCHA, OComunidades zooplanctoˆnicas como bioindicadoras de eutrofizac¸a˜o em reservato´rios tropicais. http://dx.doi. org/10.1590/1676-06032014001814
Resumo: A eutrofizac¸a˜o e´ um processo caracterizado pelo aumento da produtividade do sistema aqua´tico, o que provoca profundas alterac¸o˜es na estrutura de suas comunidades. Devido a` alta sensibilidade ambiental das espe´cies planctoˆnicas, o estudo de suas comunidades pode indicar a deteriorac¸a˜o do ambiente. Os reservato´rios Jaguari e Jacareı´ sa˜o parte do Sistema Cantareira, que fornece a´gua para os habitantes de Sa˜o Paulo e que tem sido afetado por diversas formas de contı´nua interfereˆncia humana. Neste trabalho vamos analisar algumas propriedades da comunidade zooplanctoˆnica como bioindicadoras de eutrofizac¸a˜o e alterac¸a˜o da qualidade da a´gua. Foram realizadas medic¸o˜esin situde varia´veis fı´sicas e quı´micas, amostras de a´gua foram coletadas para ana´lises e amostras quantitativas de zooplaˆncton foram coletadas em oito localidades compreendendo os dois reservato´rios, em duas estac¸o˜es, seca e chuvosa. As espe´cies foram identificadas e suas abundaˆncias nume´ricas e biomassas foram determinadas e utilizadas para estimar dois ı´ndices biolo´gicos. O estado tro´fico e a estrututa do zooplaˆncton, a relac¸a˜o Calanoida / Cyclopoida e as curvas de k-dominaˆncia foram associados com os nı´veis de perturbac¸a˜o, representada principalmente pela entrada de nutrientes transportados pelo rio e pelas flutuac¸o˜es no nı´vel da a´gua. O Reservato´rio Jaguari se encontrava mais eutrofizado do que o Reservato´rio Jacareı´, como evidenciado pelos ı´ndices obtidos. As propriedades da comunidade zooplanctoˆnica utilizadas como indicadoras do estado tro´fico dos reservato´rios foram u´teis como ferramentas de monitoramento.
Palavras-chave: Zooplankton, curvas ABC, raza˜o Calanoida/Cyclopoida, Sistema Cantareira, impacto ambiental.
Biota Neotropica. 14(4): e20140018.
Introduction
Eutrophication is a detrimental process that can occur in aquatic ecosystems characterized by the enrichment of nutri-ents, mainly nitrogen and phosphorus, leading to increased productivity of the system (Serafim-Ju´nior 2010). This process causes changes in communities that may threaten the conserva-tion of aquatic species and, because it is generally associated with some type of pollution, also poses risks to all living beings that directly or indirectly make use of the contaminated water or consume the organisms.
Such an alteration in the trophic state of a water body usually causes profound changes in the structure of plankton communities (Matsumura-Tundisi & Tundisi 2005), which is the reason why the interpretation of biological events in these populations and qualitative and quantitative analysis of their structures allows the degree of deterioration of the water body as a whole to be assessed (Pinto-Coelho et al. 2005, Silva 2011).
Characteristically, the zooplankton community is composed of highly sensitive organisms that respond to a large number of environmental changes in relatively short periods of time. Moreover, because this community is more developed in lentic aquatic systems, studies of its structure and population dynamics can be very useful tools in the analysis of the environmental disturbances to which these water bodies are subjected (Sampaio et al. 2002, Eskinazi-Sant’anna 2013).
An increase in zooplankton biomass has been related by many authors to a rising level of eutrophication, since, to a large extent, a higher trophic state will lead to increased resource availability, which, in turn, leads to growth in the biomass of zooplankton populations (Serafim-Ju´nior et al. 2010, Bonecker et al. 2007).
Besides recording biomass as a quantitative parameter, another community property used to indicate the trophic condition of the water body is the set of ratios between component populations of the zooplankton (rotifers, copepods and cladocerans) given that these ratios are also affected by eutrophication (Sampaio et al. 2002, Sendacz et al. 2006, Bini et al. 2007).
Studies performed by Gannon & Stemberger (1978) and Tundisi (1988) have associated lower proportions of calanoid to cyclopoid copepods and cladocerans with eutrophic environments. One generalization usually made in relation to zooplankton size structure and trophic state of water bodies is that species with larger bodies such as Calanoida (pre-dominantly herbivores), occur primarily in oligotrophic environments, where there is a predominance of nanophyto-plankton (Hillbricht-Ilkowska 1977, Echevarria et al. 1990), whereas the Cyclopoida occur at higher density in meso-eutrophic environments, owing to their ability to handle larger food particles (Pace 1986, Santos-Wisniewski & Rocha 2007). Water quality in tropical reservoirs can also be indicated by using specific species of cyclopoid as indicators (Silva, 2011).
The aim of this study was to relate the zooplankton communities structure with the trophic state and chemical and physical water properties of the Jaguari and Jacareı´ reservoirs, through the analysis of spatial and temporal changes in numerical abundance and biomass of the community as a whole and in the proportion of bioindicator groups.
Material and Methods
1. Study area
The Jaguari and Jacareı´ reservoirs, located at 22692’33.78’’ S and 46641’74.94’’ W (Figure 1), are interconnected and part of Cantareira System, considered one of the largest water-supply systems in the world. In 2008, this system supplied a major portion of the population of the Sa˜o Paulo Metropolitan Region, the most populous urban area in Brazil, with approximately 8.8 million people. The Jaguari-Jacareı´ system provides 45% of the water in the Cantareira System, used entirely for the purpose of supplying water (ISA 2007).
Changes in the land use and occupation of the surrounding area, essentially rural in the 1970s, but now occupied by residential developments and leisure activities reflected in the deterioration of the water quality in some of the main tributaries of the basin. The environmental monitoring of the Cantareira system detected two eutrophic sites on the Jaguari River and a hypereutrophic site on the Jacareı´ River, both with trend towards increasing eutrophication over time (ISA 2007). Despite a great increase in organic pollution in the Jacareı´ River, the Jacareı´ Reservoir has remained oligotrophic at most points, owing possibly to the dilution caused by the large volume of water stored in this reservoir and by the low residence time of the water.
2. Sampling and Data Analysis
In situphysical and chemical measurements, water samples for analysis and quantitative zooplankton samples were taken at eight points in the two reservoirs (Figure 1), three in the Jaguari and five in the Jacareı´ Reservoir. The geographical location of these points was determined with a Garmin GPS, model 130 SOUNDER. Samples were collected in two seasons and contrasting water levels, due to the operation of the reservoirs (outflow control), one in August 2012 (dry season and high water level) and another in March 2013 (rainy season and low water level). All measurements and samplings were carried out in the interval between 9 a.m. and 4 p.m.
The transparency of the water column checked by readings of the Secchi Disk and depth measurements were performed. The extent of the euphotic zone was calculated by multiplying the Secchi depth reading by the factor 3.0. The pH, electrical conductivity (mS cm-1), dissolved oxygen concentration (mg L-1)
and temperature of the water (6C) were measured with a HORIBA U-10 multisensor. Data were collected every 0.5 or 1.0 m according to the sampling point depth.
Data on rainfall and air temperature were retrieved from the website of the Brazilian National Institute of Meteorology (INMET - http://www.inmet.gov.br), based on readings at the meteorological station of Monte Verde, MG, the closest to the reservoirs.
The spectrophotometric methods used for the analysis of nutrients were those described by Golterman et al. (1978) and Mackereth et al. (1978).
Chlorophyll concentrations were determined by extraction with 90% acetone, as described in Golterman et al. (1978). Calculations were carried out as indicated by Nush et al. (1980). Semi-quantitative samples of zooplankton were collected using plankton net of 68mm mesh aperture, by vertical hauls.
The collected volume of water was calculated by multiplying the area of the net mouth by the trawl depth. After sampling, the material was preserved in 4% formaldehyde solution.
The zooplankton were identified to genus or species level under a ZeissHmicroscope with camera lucida and magnifica-tion up to 1,000 times, and had their sizes measured by a computerized image acquisition system. For taxonomic identi-fication, dissections were performed, slides mounted and the following keys and specialized bibliography were used: Edmondson 1959, Koste 1978, Reid 1985, Nogrady et al. 1993, Elmoor-Loureiro 1997, Nogrady & Segers 2002, Segers & Shiel 2003, Silva & Matsumura-Tundisi 2005.
To determine the numerical abundance of each taxon, samples were analyzed in a gridded acrylic plate under a stereoscopic LeicaHMZ6 microscope at 50 times magnification.
Counts were performed on subsamples of variable size, according to species abundance, and for the least abundant species the count was performed on the whole sample. For the Rotifera species and for Copepoda nauplii, subsamples of 1 mL were counted in a Sedgewick-Rafter chamber under an optical microscope, at up to 1,000 times magnification. Once identified and counted, population densities were calculated and expressed as number of individuals per cubic meter of water (ind.m-3).
Body size measurements (about 20 individuals of each species or genus per sample) were made under an optical microscope with an ocular micrometer and together with corresponding population density data, were used to estimate the biomass, expressed in mg of dry weight per cubic meter
(mg dw.m3).
Biomasses of Cladocera and Copepoda were calculated with the standard linear equation for the double logarithmic regression proposed by Bottrell et al. (1976), which relates the body length (mm) of individuals in a given taxonomic group (Cladocera and Copepoda) to their dry weight (mg).
The following equations were used: lnW = 1.7512 ++ 2.6530 lnL for cladocerans and LnW = 1.9526 ++ 2.3990 lnL for copepods.
The biomass of each group (Cladocera or Copepoda) was calculated as the sum of the biomass of individual populations. Copepoda was subdivided into two sub-groups, viz. the sub-orders Calanoida and Cyclopoida.
The biomass of Rotifera species was determined by the technique described by Ruttner-Kolisko (1977), in which the biovolume is calculated by specific formulas for the geometrical shape closest to the shape of each species or developmental phase.
Two indices were used as biological indicators of the trophic state of the reservoir or disturbances in particular compart-ments of the reservoirs.
The first was the ratio CA/CY (Calanoida/Cyclopoida) between the numerical densities of populations belonging to the sub-orders Calanoida and Cyclopoida, which was assessed as a possible bioindicator of the trophic state in the various portions of the reservoirs.
The second index was the shape of the ABC curves (Warwick, 1986) representing the accumulated numerical abundance and biomass of all populations present in a given community, which can be an indicator of environmental perturbation. The W parameter of the ABC curves was obtained from the expression W =S(Bi-Ai) / [50 (S-1)], where Bi is the biomass value of each sequence of species (i) on the ABC curve, Ai is the abundance of each sequence of species (i) on the ABC curve and S is the number of species. This index allows the degree of disturbance of these environments to be expressed quantitatively. Positive values indicate an undis-turbed environment; negative values suggest disundis-turbed commu-nities and values near zero indicate moderate disorders: the value of W can range from -1 to 1.
To compare species diversity between the sampled sites in the Jaguari and Jacareı´ reservoirs, the following indices were calculated: Richness (number of taxa recorded), Shannon-Wiener diversity index (H’), Dominance index (D’) and Evenness or Pielou Equitability index (J).
The beta diversity, that informs the heterogeneity of the sampled stations relative to the species richness, was estimated from theb-1 index of Harrison et al. (1992).
The Canonical Correspondence Analysis (CCA) was employed to seek correlations between the environmental variables and the density and biomass of zooplankton groups, through the CANOCO 3:12 program (Ter Braak & Sˇmilauer 2002). During the analysis, the significance of correlation between environmental and biotic parameters was tested by a Monte Carlo test with 999 random permutations, and p#0.5 as the criterion of significance.
Results
In August 2012, the rainfall values (mm) were the lowest in that year, since from mid July until the first sampling date (August) there was very little precipitation (1 mm) and given that in the three months before this sampling the total precipitation in the reservoirs was 363 mm. The second sampling, conducted at the beginning of March 2013, reflected the large amount of rain that had fallen since October 2012, with a rainfall of 938 mm recorded in the three months preceding the data gathering, of which 335 mm was from the previous month. The lowest air temperatures (6C) in the year 2012 were recorded in the period between May and October with an average of 146C in the previous three months to the first collection. From the end of October until March 2013, the average temperature in the three months before the second sampling was higher, being 206C.
According to data provided by the water authority, SABESP, the maximum operational volume of both reservoirs working in a coupled mode is 1047.9 hm3. In August 2012 (low rainfall and high water level), the volume of this operating system reached 73.81% of the maximum capacity, while in March 2013 (high rainfall and low water level) it was 59.19%. The average flow rate for the dry period was 31.5 m3/s and, for the rainy season, 24.9 m3/s, resulting in residence times of 284 and 288 days, respectively.
Table 1 presents the values of physical and chemical variables measured at various points in the Jaguari and Jacareı´ reservoirs. It was found that seven of the eight sampling sites had lower trophic state indices in the dry than in the rainy season. At the first sampling, seven of the eight points were characterized as oligotrophic (TSI # 44) and only one point, located in the Jaguari reservoir, was mesotrophic (TSI range = 44 to 54). In the second sampling, however, five sites were
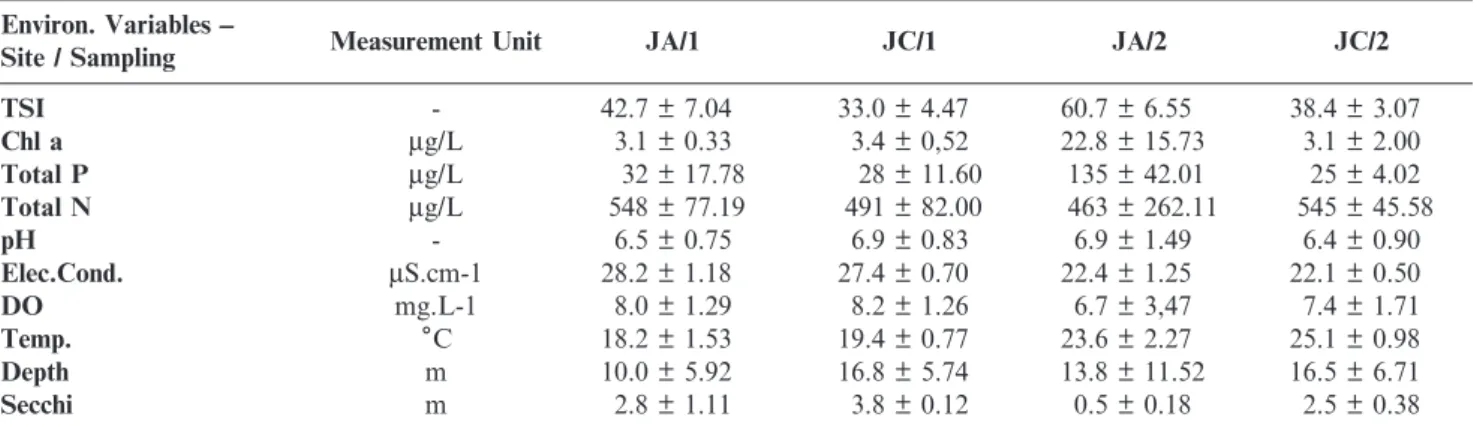
Table 1. Values of Trophic State Index (TSI) of Carlson, modified by Lamparelli, 2004, chlorophylla, total phosphorus and total nitrogen concentrations, pH, electrical conductivity, dissolved oxygen, water temperature, depth of the water column and the Secchi disk with their respective standard deviations, recorded at the sampling sites in Jaguari (JA) and Jacareı´ (JC) Reservoirs, in August 2012 (dry) and March 2013 (rainy season). The numbers following the abbreviations JC and JA refer to the first (1) and second (2) sampling.
Environ. Variables ––
Site / Sampling Measurement Unit JA/1 JC/1 JA/2 JC/2
TSI - 42.7 ± 7.04 33.0 ± 4.47 60.7 ± 6.55 38.4 ± 3.07
Chl a mg/L 3.1 ± 0.33 3.4 ± 0,52 22.8 ± 15.73 3.1 ± 2.00
Total P mg/L 32 ± 17.78 28 ± 11.60 135 ± 42.01 25 ± 4.02
Total N mg/L 548 ± 77.19 491 ± 82.00 463 ± 262.11 545 ± 45.58
pH - 6.5 ± 0.75 6.9 ± 0.83 6.9 ± 1.49 6.4 ± 0.90
Elec.Cond. mS.cm-1 28.2 ± 1.18 27.4 ± 0.70 22.4 ± 1.25 22.1 ± 0.50
DO mg.L-1 8.0 ± 1.29 8.2 ± 1.26 6.7 ± 3,47 7.4 ± 1.71
Temp. 6C 18.2 ± 1.53 19.4 ± 0.77 23.6 ± 2.27 25.1 ± 0.98
Depth m 10.0 ± 5.92 16.8 ± 5.74 13.8 ± 11.52 16.5 ± 6.71
classified as oligotrophic, all located in the Jacareı´ reservoir, while among the three located in the Jaguari reservoir, one site was mesotrophic and two were eutrophic (TSI range = 54 to 74).
It was observed that in the dry period, the amplitude of variation in the nutrient concentrations in the reservoirs was lower than in the rainy season. In the latter period, there were higher peaks of phosphorus, chlorophyllaand total nitrogen concentrations in the Jaguari Reservoir. Also in this reservoir there was a fall in Secchi Disk depth readings in the second sampling.
The dissolved oxygen concentrations in the water recorded in the dry period ranged between 7.1 and 9.1 mg L-1, while in the rainy season the range was lower, from 5.6 to 8.7 mg L-1. The electrical conductivity of the water ranged between 26.7 and 30.4 mS.cm-1 in the dry season and between 21 and
23.5 mS.cm-1 in the rainy. In the rainy season the average
temperature was higher at all points, while the pH decreased at six points, relative to the dry season.
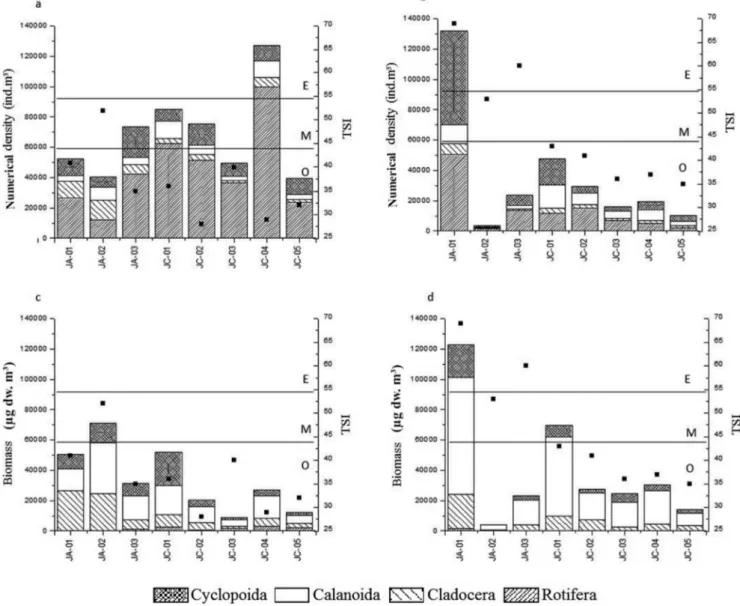
Total densities of zooplankton and also those of each group are shown in Figures 2a and 2b, for the dry and rainy periods, respectively. In general, densities were higher in samples collected in August 2012, with the exception of site JA-01, in which density was also high in March 2013, owing the large numbers of cyclopoid copepods. It was also observed that rotifers were numerically dominant at seven of the eight sites in the samples collected during the dry season, while in the rainy season this occurred at only three points and numbers were generally lower.
Figures 2c and 2d present the biomass values for total zooplankton and for each component group. It can be observed that in the dry season (Figure 2c), the total biomass of zooplankton was higher at sites JA-01 and JA-02, but lower at point JC-03. In the samples taken during the rainy season
Figure 2. Values of total numerical density (ind.m-3) and total biomass (
mg dw. m3) of the main components of the zooplankton community groups
(Figure 2d), the total biomass was high at site JA-01, close to the influx of the Jaguari river.
The highest biomass of cladocerans in the samples collected in August 2012 (low rainfall) occurred near the Jaguari river entry-point (JA-01 and JA-02), while in March 2013 (high rainfall), the biomass of this group was high only at JA-01. In the sampling carried out in March 2013, Calanoid copepods reached a higher biomass than in August 2012 at almost all sites and the highest biomass among all the taxonomic groups (Calanoida, Cyclopoida, Cladocera and Rotifera). Biomasses of all groups were highest at the most eutrophic point, JA -01. Unlike the numerical density, the biomass of Rotifera was the lowest of all groups of zooplankton at all sites in both seasons. During the dry season, the lowest richness in Jaguari Reservoir was recorded in the upstream part of the Jaguari reservoir (JA-01, JA-02), with a total of 13 species, while at the other sampling sites richness varied between 18 and 21 species; dominance index values were 0.62 and 0.39 at JA-01 and JA-02, while at the remaining sites these ranged from 0.16 to 0.24. The equitability index at JA-01 was 0.37, the lowest value recorded, while at the other sites it ranged from 0.60 to 0.73. The Shannon-Wiener index for the zooplankton community was 0.95 at JA-01 and 1.56 at JA-02, while at other sites it varied from 1.81 to 2.15 (Table 2).
The heterogeneity value obtained through the beta diversity index was 15%, which reveals great similarity of the zooplank-ton diversity among the Jaguari and Jacarei reservoirs, especially among the Copepoda and the Cladocera; however, some differences were observed in the Rotifera taxonomic composition: seven species occurred only in the Jacareı´ reservoir (Ascomorpha ecaudis, Asplanchna sieboldi, Keratella americana,Keratella lenzi,Conochillus dossuarius,Trichocerca similis and Conochillus coenobasis), whereas the remainder occurred in both reservoirs, except for Trichocerca Capuccina, which occurred only in the Jaguari reservoir.
During the dry season, copepods of the order Cyclopoida were dominant at most sites, with values of the ratio CA/CY lower than 1.0. At the few sites where the dominance of the
order Calanoida was observed, the numerical densities of both groups were similar resulting in values of the ratio close to 1.0 (Table 3).
In the rainy season, when a lower water level is maintained in the reservoir, the lowest values of the Calanoida / Cyclopoida ratio (close to 0.0) were obtained at the sites with the highest trophic state index in the Jaguari reservoir, indicating a decrease in the abundance of Calanoida copepods at these sites. At the remaining sites ratios near 1.0 were recorded; however, there was dominance of Calanoida Copepoda in some parts of the Jacareı´ reservoir, especially at JC-02, where the value of CA/CY was 1.94 (Table 3).
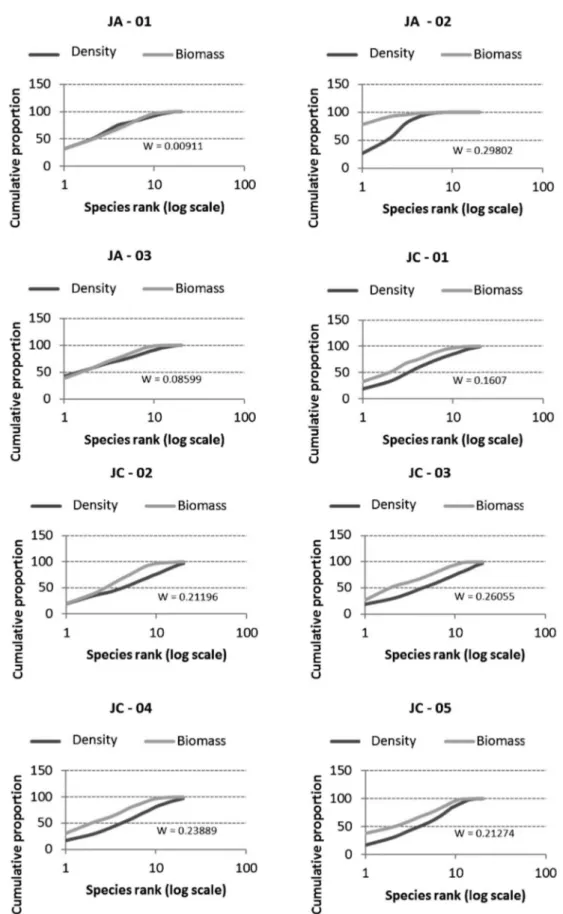
For zooplankton sampled in August 2012 (Figure 3) it is observed that, although the two ABC curves are close, the numerical abundance curve is located above the biomass curve at all sampling sites, indicating slightly disturbed environments, with intermediate conditions. For the sampling conducted in March 2013 (Figure 4), the biomass curve is located above the numerical abundance curve at most sites, indicating undisturbed environments, with the exception of JA-01 and JA-03, where the abundance curve practically covers the biomass curve (w,0.09), suggesting that these are slightly disturbed habitats. In the dry season, it was found that all values of the W index were negative, ranging from -0.14 to -0.031, while in the rainy season, all values were positive and ranged from 0.01 to 0.3 (Figures 3 and 4).
In the CCA conducted relating the numerical density and the abiotic variables (Figure 5a) it was observed that the first two axes explained 77.9% of the data variability. There is a positive correlation between TSI, chlorophyll a, temperature and total phosphorus with the zooplankton groups Copepoda and Cladocera and also with the rainy period. On the other hand the numerical densities of Rotifera were positively correlated with the values of dissolved oxygen and total nitrogen and also with the dry period.
Regarding the CCA analysis applied to the biomass and environmental variables values (Figure 5b), the first two axes had an explicability of 53.6%. A positive correlation between the Copepoda biomass and the variables TSI, chlorophyll a,
Table 2. Values of the components of diversity (species richness and evenness) and the Shannon-Wiener Diversity and Dominance Indices for zooplankton species in the Jaguari and Jacareı´ reservoirs during Aug 2012 (dry season) and Mar 2013 (rainy season). The numbers following the abbreviations JC and JA refer to the numbering of the sampling sites.
1stsampling JA-01 JA-02 JA-03 JC-01 JC-02 JC-03 JC-04 JC-05
Richness 13 13 18 19 21 18 21 20
Dominance 0.62 0.39 0.24 0.16 0.16 0.20 0.17 0.18
Shannon-Wiener 0.95 1.56 1.91 2.15 2.06 1.81 1.97 2.06
Evenness 0.37 0.60 0.66 0.73 0.68 0.63 0.65 0.69
2ndsampling JA-01 JA-02 JA-03 JC-01 JC-02 JC-03 JC-04 JC-05
Richness 18 5 12 16 13 11 18 20
Dominance 0.14 0.38 0.24 0.13 0.40 0.14 0.12 0.14
Shannon-Wiener 2.43 1.11 1.78 2.39 1.51 2.15 2.47 2.46
Evenness 0.84 0.69 0.71 0.86 0.59 0.90 0.85 0.82
Table 3. Calanoid:cyclopoid copepods density ratio (CA/CY) in zooplankton communities sampled in August 2012 (dry) and March 2013 (rainy season) in Jaguari (JA) and Jacareı´ (JC) reservoirs. The numbers following the abbreviations JC and JA refer to the numbering of the sampling sites.
CA/CY RATIO JA-01 JA-02 JA-03 JC-01 JC-02 JC-03 JC-04 JC-05
1stsamp. 0.35 1.16 0.24 1.27 0.44 0.36 1.05 0.28
total phosphorus and temperature was found. The biomasses of the Rotifera and Cladocera groups were correlated with the concentrations of total nitrogen and dissolved oxygen.
Discussion
Many Brazilian reservoirs undergo large annual fluctua-tions in the water level, partially determined by climatic forces but mainly by the operation of the dam. This was the case in Barra Bonita reservoir, the uppermost in the reservoir cascade along the Tieteˆ River basin (Matsumura-Tundisi & Tundisi 2005). Its water level is fully controlled in order to regulate the levels in the downstream reservoirs, as well as the amount of hydroeletricity produced, one of the main zooplankton com-munities modifiers (Bini et al. 2007). A similar situation was observed in the Jaguari and Jacareı´ reservoirs in the present study, where, during the dry season, the reservoirs levels were high, reaching 73.81% of their maximum capacity, whereas in the rainy season they were only 59.19% full. Thus, the water level was more related to the changes in the amount of water extracted for the public supply than to the natural inputs from the catchment basin.
The increasing trophic state of Jaguari Reservoir (RJA) in the rainy season was evidenced by the increase in the concentration of chlorophyll a at two of the three sites sampled and the significant increase in the concentration of total phosphorus, due to the continuous inflow of the Jaguari River, which receives domestic untreated sewage and thus represents the main point source of pollution and disturbance in this reservoir (ISA 2007); the increase of eutrophication in the rainy period, as well the strong relationship between this increase with the total phos-phorus and chlorophyllaconcentrations was evidenced by both CCA analyses conducted. On the basis of these variables, this reservoir was classified as eutrophic in the rainy period.
At the sites located in the Jacareı´ reservoir (RJC), the values of TSI were relatively similar between the two sampling dates and RJC was classified as oligotrophic at all points. Although this reservoir receives the organically polluted waters of the Jacareı´ River, its much larger volume of water (compared to RJA) results in great dilution of the nutrients transported by the river and also carried in runoff from the disturbed catchment basin (ISA 2007).
The decrease in the water transparency (Secchi disk) in the rainy season is another indication of the increase in the trophic state of Jaguari Reservoir. However, the high inorganic turbidity of water in tropical reservoirs can, in some periods and depending on the activities occurring in the basin, affect the reliability of this measure of the trophic state, which should not be used alone (Mercante & Tucci-Moura 1999).
Zooplankton densities in the reservoirs were lower at seven of the eight sites sampled during the rainy season, possibly due to dilution by the greater volume of water and partially by the removal of populations by the downstream outflow (water extraction system operation). The only site at which a high density of zooplankton was found was near the entrance of the Jaguari river, probably reflecting the higher trophic conditions suggested by the high phosphorus and chlorophyll concentra-tions (TSI value = 69). The fall in zooplankton at the end of the rainy season has also been observed in other reservoirs, as in the Guarapiranga reservoir, by Sendacz et al. (2006), and the Barra Bonita reservoir, by Tundisi et al. (2008).
For the Jaguari and Jacareı´ reservoirs the highest concen-trations of nutrients were observed during periods of high water level. Tundisi et al. (2008) indicated that, in the Barra Bonita reservoir, the highest concentration of nutrients occurs at the beginning of the rainfall, due to entrainment of soil particles from runoff and via tributaries; however, after some time, a diluting effect may occurs because of the increased volume of
water, reducing the concentration of nutrients. This may explain why, despite the high rates of TSI during the rainy season, caused by the importing of nutrients, zooplankton communities have low densities, possibly due to dilution caused by excess rainfall.
A direct relationship was found between the values of zooplankton biomass and trophic levels in the reservoirs in both periods and at almost all sampling sites, except at JC-03 and JC-05 during the dry season, at which the high density of nauplii, possibly due to a reproductive peak, resulted in a lower copepod population biomass, and at JA-02 during the rainy season, which had low chlorophyll concentrations, suggesting that low food availability may have been a limiting factor for community growth, despite the high concentration of nitrogen, an indicator of the presence of sewage carried in the Jaguari river inflow. This close relationship between the values of biomass and TSI was also observed by Bonecker et al. (2007) in three reservoirs in Parana´ State.
In the samplings carried out during the dry season, at seven of the eight points, there was a numerical dominance of rotifers, a relationship that is noticeably established by the CCA, not only by the numerical density, but also by the Rotifera biomass, which was strongly related to the dry period too. The dominance of rotifers at most sites is possibly a consequence of an unstable environment, which enhance r-strategists growth (Matsumura-Tundisi & Tundisi 2005). The higher biomass in both periods was associated with Copepoda Calanoida, except at the main river entrance points JA-01 and JC-01, a feature expected for oligotrophic water bodies, as reported by Pinto-Coelho et al. (2005), who concluded that the Calanoida are good indicators of oligotrophy.
In contrast, in the meso-eutrophic Guarapiranga Reservoir Sendacz et al. (2006) reported that the Cyclopoida were the main contributors to the biomass in the reservoir during the dry period, a fact commonly observed in other eutrophic Brazilian reservoirs, like Barra Bonita, SP (Santos-Wisniewski & Rocha 2007).
Under the more eutrophic conditions of sites 01 and JA-02 during the dry season and JA-01 during the rainy season, the highest cladoceran biomasses were observed, a response similar to that reported by Bonecker et al. (2007) and Serafim-Ju´nior et al. (2010) that observed an increase in Cladocera biomass and abundance at points with highest trophic state condition. This strong relationship between the Cladocera and the most eutrophic period and variables, like total phosphorus and chlorophylla, is evidenced by the CCA.
The values of the four diversity related indices reflected the disturbance caused by the Jaguari River nutrient input on the zooplankton community at the sites located in the upper portion of the reservoir, especially during the dry season, indicating the imbalance in the community concerned. In the Jacareı´ reservoir, on the other hand, there are lower levels of dominance and higher values of evenness and Shannon-Wiener index, indicating a less disturbed body of water, possibly due to the greater volume of water in this reservoir .The values found for the richness of species in the zooplankton communities of the Jaguari and Jacareı´ reservoirs were low compared to those reported by Silva (2011) whereas the evenness of species populations found in this study was high compared to those obtained by the same author.
The taxonomic differences observed for Rotifera between the reservoirs is possibly due to the greater spatial heterogeneity
observed in the Jacareı´ reservoir, which may bear a higher number of species, especially rotifers, that have a short life cycle, fast adaptation to environmental variations and higher turnover rates, which makes them a more representative group in freshwater environments and good indicators of the trophic level in these environments (Serafim-Ju´nior et al. 2010, Bini et al. 2007). Besides these characteristics the lowest trophic level of the Jacareı´ reservoir allows greater taxonomic diversity.
The zooplankton community structure did change with the changes of trophic conditions over the reservoirs. Relative numbers and biomass of Calanoids decreased and those of Cyclopoids increased at sites under more eutrophic conditions, thus resulting in lower values of Calanoida-Cyclopoida ratios. This pattern has been reported before for other Brazilian reservoirs (Tundisi 1988, Santos-Wisniewski & Rocha 2007, Sendacz et al. 2006) and elsewhere for both, tropical, and subtropical water bodies (Pace 1986, Caramujo & Boavida 2000), namely that the presence of calanoid copepods relates to a low trophic level in the habitat, while cyclopoid copepods are favored in the more productive areas of higher trophic state. The higher proportion of calanoids in oligotrophic waters is due to the herbivorous-filter feeding habit of most species belonging to this group, especially in adulthood; and such feeding is based on nano-phytoplankton, which is replaced by micro-phytoplankton in environments of higher trophic state. In eutrophic environments, with the fall in the population density of Calanoida, we observe the dominance of Cyclopoida, which are mostly carnivorous and prey on smaller species of Rotifera and Cladocera, usually more abundant at higher levels of nutrients (Matsumura-Tundisi & Tundisi 1976, Nogueira 2001).
The k-dominance curves for the zooplankton community in the different compartments of the Jaguari and Jacareı´ reservoirs indicated that during the dry season this environment was disturbed or polluted, since the numerical density curve was raised above the biomass curve, especially at sites located in the Jaguari reservoir, possibly because the low rainfall augmented the constant supply of nutrients from the Jaguari river. For the zooplankton sampled in the rainy season, the raising of the biomass curve over the density at most sites, indicates that the environment was undisturbed, which is probably due to the dilution caused by the rains and the dam operation. A similar result was observed by Arantes-Ju´nior (2011) in his study of the zooplankton community in the Madeira river in various hydrological cycles, where the numerical curves were raised in most samples collected during periods of low water and flooding (with lower depths, low light and high concentrations of suspended solids). However, during periods of high depth and rates of flow due to high rainfall, the biomass curves overlapped, indicating lower disturbance than in other periods. In the rainy season, however, the k-dominance curves obtained for the zooplankton at the Jaguari river entrance and at the downstream compartment (sites JA-01 and JA-03) show an overlapping of the lines, indicating moderate perturbation, resulting from the constant supply of nutrients coming from the river Jaguari and consequent eutrophication, corroborated by the corresponding trophic indices.
1986). Sonoda (2011) also applied these parameters to microcrustaceans in the Tropeiros lake and found that near the littoral zone the numerical curve was above the biomass curve and the value of W negative, indicating a community in a disturbed habitat. For the limnetic region, the biomass curve was higher than the numeric curve and W was positive, indicating that the community environment was undisturbed. The author explains that the region near the land suffers greater outside influence and, being a shallower region, it may be affected more by turbulence, due to sediment suspension, besides other factors.
In the case of Jaguari and Jacareı´ reservoirs, the main disturbances were due to the combined effects of two factors: eutrophication and controlled changes in the water level due to variations in the water extraction.
In conclusion, it can be seen that biological indices can be used to assess the effects of various environmental disorders, which alter the number and biomass of the zooplankton in a similar manner.
Acknowledgments
We thank CAPES (Coordination for the Improvement of Higher Education Personnel) for the grant to the first author and SABESP (Sanitation and Water Supply Company of Sa˜o Paulo State) for research financial support and local infrastructure.
References
ARANTES-JUNIOR, J.D. 2011. Estudo limnolo´gico de um trecho do me´dio Rio Madeira (regia˜o de Porto Velho - RO), com eˆnfase na comunidade zooplanctoˆnica. Tese de doutorado, Universidade Federal de Sa˜o Carlos, Sa˜o Carlos.
BINI, L.M., VIEIRA, L.C.G., MACHADO, J. & VELHO, L.F.M. 2007. Concordance of Species Composition Patterns among Microcrustaceans, Rotifers and Testate Amoebae in a Shallow Pond. Hydrobiologia 92(1):9––22, http://dx.doi.org/10.1002/ iroh.200610865
BONECKER, C.C., NAGAE, M.Y., BLETLLER, M.C.M., VELHO, L.F.M. & LANSAC-TOˆ HA, F.A. 2007. Zooplankton biomass in tropical reservoirs in southern Brazil. Hydrobiologia 579(1):115–– 123,http://dx.doi.org/10.1007/s10750-006-0391-x
BOTTRELL, H.H., DUNCAN, A., GLIWICZ, Z., GRYGIEREK, E., HERZIG, A., HILLBRICHT-ILKOWSKA, A., KURASAWA, H., LARSSON, P. & WEGLENSKA, T.A. 1976. Review of some problems in zooplankton production studies. Norw. J. Zoo 24:419––456.
CARAMUJO, M.J. & BOAVIDA, M.J. 2000. The crustaceans communities of River Tagus Reservoirs, zooplankton structure as reservoir trophic state indicator. Limnetica 18:37––56.
CARLSON, R.E. 1977. A trophic state index for lakes. Limnol. Oceanogr 22(2):361––369, http://dx.doi.org/10.4319/lo.1977. 22.2.0361
ECHEVARRIA, F., CARRILO, F.J., SANCHEZ-CASTILLO, P., CRUZ-PIZARRO, L. & RODRIGUES, J. 1990. The size-abundance distribution and taxonomic composition of plankton in a oligotrophic, high mountain lake (La Caldera, Sierra Nevada, Spain). J. Plankton Res 12(2):415––422, http://dx.doi.org/10.1093/ plankt/12.2.415
EDMONDSON, W.T. 1959. Freshwater Biology. 2 ed. John Wiley & Sons Inc, New York.
ELMOOR-LOUREIRO, L.M. 1997. Manual de identificac¸a˜o de Clado´ceros lı´mnicos do Brasil. Ed. Universa, Brası´lia.
ESKINAZI-SANTANNA, E.M., MENEZES, R., COSTA, I.S., ARAU´ JO, M., PANOSSO, R. & ATTAYDE, J.L. 2013.
Zooplankton assemblages in eutrophic reservoirs of the Brazilian semi-arid. Braz. J. Biol 73(1):37––52, http://dx.doi.org/10.1590/ S1519-69842013000100006
GANNON, J.E. & STEMBERGER, R. 1978. Zooplankton (especially crustaceans and rotifers) as indicators of water quality. T. Am. Microsc. Soc 97:16––35,http://dx.doi.org/10.2307/3225681
GOLTERMAN, H.L., CLYMO, R.S. & OHNSTAD, M.A.M. 1978. Methods for physical and chemical analysis of freshwaters. 2 ed. Blackwell Scientific Publications, Oxford.
HARRISON, S., ROSS, S.J. & LAWTON, J.H. 1992. Beta diversity on geographic gradients in Britain. J. Anim. Ecol 62:151––158,http:// dx.doi.org/10.2307/5518
HILLBRICHT––ILKOWSKA, A. 1977. Trophic relations and energy flow in pelagic plankton. Pol. Ecol. Stud.
INMET –– Instituto Nacional de Meteorologia. http://www.inmet.gov. br (accessed in 01/07/2013)
ISA –– INSTITUTO SO´ CIO AMBIENTAL. 2007. Um olhar sobre o maior manancial de a´gua da Regia˜o Metropolitana de Sa˜o Paulo –– Resultados do diagno´stico socioambiental participativo do Sistema Cantareira. Sa˜o Paulo.
KOSTE, W. 1978. Rotatoria die radertiere mitteleuropas, U¨ beiordnung Monogononta. Berlim: Gebriider Berntra¨ger.
LAMPARELLI, M.C. 2004. Grau de trofia em corpos d’a´gua do Estado de Sa˜o Paulo: avaliac¸a˜o dos me´todos de monitoramento. Tese de doutorado, Universidade de Sa˜o Paulo, Sa˜o Paulo. MACKERETH, F.J.H., HERON, J. & TALLING, J.F. 1978. Water
analysis: some revised methods for limnologists. 2 ed. Freshwater Biological Association, Michigan.
MATSUMURA-TUNDISI, T. & TUNDISI, J.G. 1976. Plankton studies in a lacustrine environment. Oecologia 25(3):265––270,
http://dx.doi.org/10.1007/BF00345103
MATSUMURA-TUNDISI, T. & TUNDISI, J.G. 2005. Plankton richness in a eutrophic reservoir (Barra Bonita Reservoir, SP, Brazil). Hydrobiologia 542(1):367––378, http://dx.doi.org/10.1007/ s10750-004-9461-0
MERCANTE, C.T.J. & TUCCI-MOURA, A. 1999. Comparac¸a˜o entre os ı´ndices de Carlson e de Carlson modificado aplicados a dois ambientes aqua´ticos subtropicais, Sa˜o Paulo, SP. Acta Limnol. Bras. 11(1):1––14.
NOGRADY, T. & SEGERS, H. 2002. The Asplanchnidae, Gastropodidae, Lindiidae, Microcodinidae, Synchaetidae, Trochosphaeridae. Guides to the Identification of the Microinvertebrates of the Continental Waters of the World. Backhuys Publishers BV, DordrechtThe Netherlands.
NOGRADY, T., WALLACE, R.L. & SNELL, T.W. 1993. Rotifera: biology, ecology and systematic. In Guides to the identification of the microinvertebrates of the continental waters of the world (DUMONT, H.J.F., ed.). Netherlands: SPB Academic Publishing, v.1, p.1––142. NOGUEIRA, M.G. 2001. Zooplankton composition, dominance and
abundance as indicators of environmental compartmentalization in Jurumirim Reservoir (Paranapanema River), Sa˜o Paulo, Brasil. Hydrobiologia 455(1––3):1––18, http://dx.doi.org/10.1023/ A:1011946708757
NUSH, E.A. 1980. Comparison of different methods for chlorophyll and phaeopigments determination. Hydrobiologia 14:14––36. PACE, M.L. 1986. An empirical analysis of zooplankton community
size structure across lake trophic gradients. Limnol. Oceanogr 31(1):45––55,http://dx.doi.org/10.4319/lo.1986.31.1.0045
PINTO-COELHO, R.M., BEZERRA-NETO, J.F. & MORAIS-JR, C.A. 2005. Effects of eutrophication on size and biomass of crustacean zooplankton in a tropical reservoir. Braz. J. Biol 65(2):325––338. REID, J.W. 1985. Chave de identificac¸a˜o para as espe´cies continentais
sulamericanas de vida livre da Ordem Cyclopoida (Crustacea, Copepoda). Universidade de Sa˜o Paulo, Sa˜o Paulo.
RUTTNER-KOLISKO, A. 1977. Suggestions for biomass calculation of plankton rotifers. Arch. Hydrobiol 8(7):1––76.
SAMPAIO, E.V., MATSUMURA-TUNDISI, T. & TUNDISI, J.G. 2002. Composition and abundance of zooplankton in the limnetic zone of seven reservoirs of the Paranapanema River, Brasil. Braz. J. Biol 62(3):525––545,http://dx.doi.org/10.1590/S1519-69842002000300018
SANTOS-WISNIEWSKI, M.J. & ROCHA, O. 2007. Spatial distribu-tion and secondary producdistribu-tion of Copepoda in a tropical reservoir: Barra Bonita, SP, Brazil. Braz. J. Biol. 67(2):223––233, http:// dx.doi.org/10.1590/S1519-69842007000200007
SEGERS, H. & SHIEL, R.J. 2003. Microfaunal diversity in a biodiversity hotspot: new rotifers from Southwestern Australia. Zool. Stud 42(4):516––521.
SENDACZ, S., CALEFFI, S. & SANTOS-SOARES, J. 2006. Zooplankton biomass of reservoirs in different trophic conditions in the State of Sa˜o Paulo, Brasil. Braz. J. Biol 66(1b):337––350,
http://dx.doi.org/10.1590/S1519-69842006000200016
SERAFIM-JU´ NIOR, M., PERBICHE-NEVES, G., DE BRITO,L., GHIDINI, A.R. & CASANOVA, S.M. 2010. Variac¸a˜o espac¸o-temporal de Rotifera em um reservato´rio eutrofizado no sul do Brasil. Iheringia Ser. Zool 100(3):233––241.
SILVA, W.M. 2011. Potential use of Cyclopoida (Crustacea, Copepoda) as trophic state indicators in tropical reservoirs. Oecologia 15(3):511–– 521,http://dx.doi.org/10.4257/oeco.2011.1503.06
SILVA, W.M. & MATSUMURA-TUNDISI, T. 2005. Taxonomy, ecology, and geographical distribution of the species of the genus Thermocyclops Kiefer, 1927 (Copepoda, Cyclopoida) in Sa˜o Paulo state, Brazil, with description of a new species. Braz. J. Biol 65(3):521––531.
SONODA, S.L. 2011. Transposic¸a˜o e fragmentac¸a˜o do Rio Piumhi (Bacia do rio Sa˜o Francisco, MG): Varia´veis Limnolo´gicas e Microcrusta´ceos zooplanctoˆnicos da Lagoa dos Tropeiros. Tese de doutorado, Universidade Federal de Sa˜o Carlos, Sa˜o Carlos. TER BRAAK, C.J.F. & SˇMILAUER, P. 2002. Canoco reference
manual and CanoDraw for Windows user’s guide: software for canonical community ordination. Microcomputer Power, Ithaca, New York.
TUNDISI, J.G. 1988. Limnologia e manejo de represas. Universidade de Sa˜o Paulo, Sa˜o Paulo.
TUNDISI, J.G., MATSUMURA-TUNDISI, T. & ABE, D.S. 2008. The ecological dynamics of Barra Bonita (Tieteˆ River, SP, Brazil) reservoir: implications for its biodiversity. Braz. J. Biol 68(4):1079–– 1098,http://dx.doi.org/10.1590/S1519-69842008000500015
WARWICK, R.M. 1986. A new method for detecting pollution effects on marine macrobenthic communities. Mar. Biol 92(4):557––562,
http://dx.doi.org/10.1007/BF00392515