2518
Ec o n o m ic S c ie n c e s
Экономические науки
UDC 31
Eth n ic ity Ch a n ge s in B a c ka Re gio n : H is to ric al Co n d itio n s a n d Cu rre n t S ta te
1Bojan Đerčan 2Tamara Lukić 3Milka Bubalo-Živković
4Branislav Đurđev
1University in Novi Sad, Serbia
Department of Geography, Tourism and Hotel Management, Faculty of Science, Trg Dositeja Obradovića 3, 21000 Novi Sad
Teaching Assistant
E-mail:
2University in Novi Sad, Serbia
Department of Geography, Tourism and Hotel Management, Faculty of Science, Trg Dositeja Obradovića 3, 21000 Novi Sad
Associate Professor
E-mail:
3University in Novi Sad, Serbia
Department of Geography, Tourism and Hotel Management, Faculty of Science, Trg Dositeja Obradovića 3, 21000 Novi Sad
Associate Professor
E-mail:
4University in Novi Sad, Serbia
Department of Geography, Tourism and Hotel Management, Faculty of Science, Trg Dositeja Obradovića 3, 21000 Novi Sad
Full Professor
E-mail:
Abs tra c t. The paper is an attempt to observe, analyze and present ethnic characteristics of the area in a complex manner, to indicate their unity and mutual dependence, and highlight the differences from an objective point of view with the aim of finding solutions for specific problems. The aim of this paper is to analyze the ethnic composition of the area of Vojvodina part of Bačka, with special emphasis on the end of XX and beginning of XXI century. By combining historical-demographic and modern approaches in analysis of ethnicity in the region we came to the conclusion that the Serbs, Hungarians, Slovaks, Croats are the largest ethnic groups in the territory of Bačka. Although the process of ethnic homogenization is dominant, there are no ethnically pure regions, and heterogeneity in the ethnic structure of the population is the main feature of Bačka.
2519
In tro d u ctio nSince the seventies ethnicity has became the subject of numerous studies in the social sciences, but the phenomenon seems to still elude precise definition and interpretation. Ethnic boundaries in the modern world at the same time are strengthened and normalized, and ethnicity is fundamentally interwoven into the cultural and political processes. Power relations, political concepts of state sovereignty and modern political communities intersect with the concept of ethnic origin and divisions (Eriksen, 2002; Brubaker, 2004; Hall, 2004).
Multi-ethnicity is a reality for most societies, today. Intertwining of ethnic, religious, linguistic boundaries is considered to be a significant feature of the region encompassing the Vojvodina (Đerčan et al., 2011a). An issue of the interpretation and understanding of ethnic identity and power relations that are intertwined with them has not only theoretical and scientific consequences, but also very significant consequences in the social and political spheres, particularly in the Balkans. All of this is base for attempts of scientists to contribute to a better understanding of the meaning and the way in which ethnic divisions and identification function (Garment, 1993; Walter, 2004).
Formation of modern demographics, primarily ethnic characteristics of Backa, is influenced by a number of social-geographic factors. Among them of a primary importance are socio- historical factors i.e. colonization and other forms of planning, stimulated settlements and population displacements followed by wars, personal and property insecurity, border changes and the economy as well as modern urban processes. Coming to Backa, residents from emigrating, mainly neighboring countries, settled in areas where their predecessors settled - the pioneers of colonization (Bukurov, 1957). In these areas their language was spoken and cultures and traditions were fostered and thus they fit into the new environment painlessly. Such colonization created ethnic map of Bačka such as today, despite the intense mixing of the population, there is the spatial differentiation of the dominant ethnic groups in this region (Bubalo-Živković and Đerčan, 2008; Bubalo-Živković et al., 2012).
P la c e a n d re s e a rc h m e th o d s
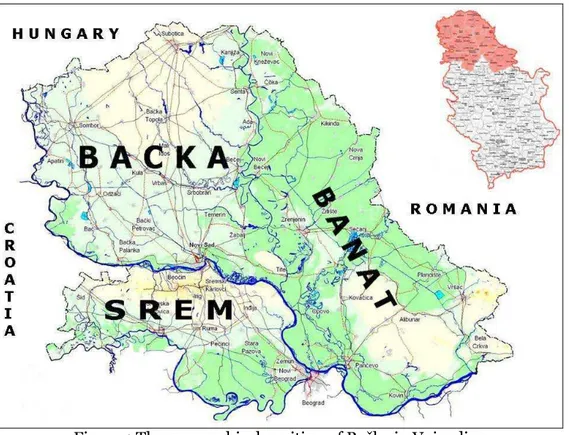
Position of Bačka can be viewed from historical and geographical perspectives. The territory of Bačka is a historical-geographic area in the north of Serbia, and a small part of the territory of Bačka spreads in neighboring Hungary. As a historical region it goes back to the Middle Ages, when it was composed of two major administrative areas: Bačka and Bodrog county. After the expulsion of the Turks, the two counties have been restored, and they quickly merged into one administrative unit Bacs-Bodrog County. Until the end of World War II, this territory, based in Sombor, existed under one name - Backa. After the delimitation with Hungary (at the end of World War II), the northern part of Bačka was annexed to Hungary and the rest to the former Kingdom of Serbs, Croats and Slovenians (Jankulov, 1961; Cvetanović and Đerčan, 2009).
2520
Figure 1 The geographical position of Bačka in Vojvodina
On the territory of Bačka, which covers an area of 8,956 km2, according to the census 2011
997 673 inhabitants lived or 111 inhabitants per km2. In the study area there are 20 municipalities
and cities: Subotica, Bačka Topola, Mali Iđoš from the North Bačka district, Kanjiža, Senta and Ada from the North Banat district, Sombor, Apatin, Kula and Odžaci from the West Bačka district, and Vrbas Bečej, Srbobran, Temerin, Žabalj, Titel, Novi Sad, Bač, Bačka Palanka and Bački Petrovac from the South Bačka District.
In connection with the study of changes in the ethnic composition of the population in Vojvodina there are difficulties specific to demographic research focused on the distant past. The primary factor that we have to keep in mind is the fact that ethnicity or nationality of the population for the state power, until the second half of the nineteenth century, was not of particular importance (Bubalo-Živković et al., 2011). The authorities for fiscal and defensive reasons was interested primarily in number, economic power and maybe in religion of the population, and the character of most medieval and modern censuses were consistent with these priorities (Veselinović, 1986; Gavrilović, 1991), as evidenced by numerous military, tax, urban and church records. A further problem is the fact that relatively few lists covered the whole area researched, were implemented with a unique methodology and purpose. Therefore, we can conclude that, except for the last three decades of the nineteenth century and the census in 1910 until the present time, there are only lists of people which provide indirect, partial, temporary and unsystematic information on the subject of our research, and demographic and ethnic changes can not be traced with certainty and precision (Đere, 2004).
One of the problems that arise when studying ethnic composition of the population in Bačka is a methodological census gap. Using the census data, care should be taken that there are no fully comparable definitions of permanent i.e. total population in census 2002 and earlier censuses. In Censuses 1971, 1981 and 1991, in addition to the population of the country, a permanent population also included Yugoslav citizens who worked abroad, as well as family members who stayed with them abroad.
2521
Bačka, with separated municipalities with an absolute (>50%) and relative (<50%) ethnic majority. In the paper the ArcGIS 9.2 software by ESRI Company has been used.
Re s u lts a n d d is c u s s io n
Due to the highly favorable geographical position, good natural conditions and important natural resources, the territory of Bačka was for centuries an attractive place for settlement of people (Bubalo-Živković and Đerčan, 2008).
Good natural conditions for living in this area have caused that territory of Bačka is, as well as other parts of Vojvodina, affected by constant movement of the population. The main causes are of economic, social, religious, ethnic or political character. It happened the involuntarily or voluntarily, collectively or individually, spontaneously or planned (Kicošev et al., 2006; Đerčan et al., 2010).
There are numerous historical and archaeological evidence that this territory was settled by the Illyrians, Celts, Romans, Avars, Huns, Slavs, Greeks, Hungarians, Germans and many other nationalities. In the eighteenth and nineteenth centuries Vojvodina was settled by Germans, Hungarians, Slovaks, Poles, Romanians and other nationalities (Jankulov, 1961; Gavrilović, 1972; Mitchell and Kicošev, 1997). Serbs settled in Vojvodina in huge numbers during the Turkish rule and the existence of military border. It is known the migration of Serbs in Vojvodina led by patriarch Arsenije Čarnojević, in 1690 (Đurđev, 1995). For all that Vojvodina has always been ethnically heterogeneous. It is heterogeneous today, too. Serbs are the majority, followed by Hungarians, Croats, Slovaks and others (Kicošev et al., 2006).
Eth n ic m a ke u p in th e p e rio d fro m 19 71 to 2 0 11
The ethnic structure of the population is only subjective demographic characteristic, given that it is the result of subjective preferences of persons covered by the census. Table 1 presents the results of the censuses 1971, 2002 and 2011 in the territory of Bačka, according to ethnic structure.
Table 1 Ethnic structure of Bačka in 1971, 2002 and 2011
Ethnic Group 1971 2002 2011
Number % Number % Number %
Srbs 438,540 43.83 602.371 55.78 580,805 58.22
Albanians 1,932 0.19 1,213 0.11 1,486 0.15
Bosniaks 0 0.00 287 0.03 482 0.05
Bulgarians 586 0.06 332 0.03 316 0.03
Bunjevci 0 0.00 19,650 0.02 16,324 0.02
Vlachs 15 0.00 15 0.00 28 0.00
Goranci 0 0.00 486 0.05 900 0.09
Yugoslavs 29,006 2.90 33,201 3.07 8,075 0.81
Hungarians 313,117 31.30 223,081 20.66 193,343 19.38
Macedonians 2,913 0.29 2,677 0.25 2,396 0.24
Muslims 1,909 0.19 2,355 0.22 2,236 0.22
Germans 3,992 0.40 2,064 0.19 2,079 0.21
Roma 2,125 0.21 11,062 1.02 16,860 1.69
Romanians 3,337 0.33 3.416 0.32 2,888 0.29
2522
Ruthenians 16,856 1.68 13.483 1.25 11,915 1.19
Slovaks 37,907 3.79 29,318 2.71 25,042 2.51
Slovenians 2,342 0.23 1,144 0.11 913 0.09
Ukrainians 3,452 0.35 3,315 0.31 2,922 0.29
Croats 100,632 10.06 42,468 3.93 32,951 3.30
Montenegrins 31,424 3.14 31,960 2.96 19,831 1.99
Czechs 588 0.06 341 0.03 - -
Other 1,807 0.18 3,670 0.34 4,016 0.40
Undeclared 667 0.07 35,454 3.28 49,052 4.92
Regional origin 3.000 0.30 6,335 0.59 16,961 1.70
Unknown 3,293 0.33 9,620 0.89 5,244 0.53
TOTAL: 1,0 0 0 ,4 9 9 10 0 .0 0 1,0 79 ,8 8 9 10 0 .0 0 9 9 7,6 73 10 0 .0 0
Source: Censuses 1971, 20 0 2 and 20 11
In the inter-census period from 1971 to 2002 the population in Bačka increased to 79 389 inhabitants. This increase in of mechanical character , which can be explained by the large influx of refugees from war-torn areas of Croatia, followed by Bosnia and Herzegovina and at the end of the twentieth century, from the territory of Kosovo and Metohija.
According to data from the census 1996, 127 214 refugees migrated to area of Bačka, who compensated lack of population caused by negative natural increase (Kicošev et al., 2006). During the same period, population decline was recorded by almost all ethnic groups, except Serbs, Roma and Romanians. Population growth was recorded by groups "undeclared" and "undecided", "regionally undeclared" and "unknown" which is result of the unstable political situation for many years (Bubalo-Živković and Đerčan, 2008). In the inter-census period, from 2002 to 2011, population of Bačka was reduced to 82 216 inhabitants.
2523
Figure 2 The most common ethnic groups in Backa according to the censuses 1971, 2002 and 2011. Source: Censuses 1971, 20 0 2 and 20 11.
The most dominant ethnic groups in the territory of Bačka are Serbs and Hungarians. All other ethnic groups have small shares, and among them the most numerous are Croats, Slovaks, and more than 1 % of the population is consisted of Montenegrins, Roma and Ruthenians. As interesting "ethnic group" in the earlier censuses, Yugoslavs were dominant, and according to census 2011 it is "undeclared".
The number of Roma has increased by 5,798 persons, and it is observed a significant increase in the number of "undeclared" (13598) and "regionally declared" (10,626). For all other ethnic groups it is observed a decrease, most with Hungarians, Yugoslavs and Montenegrins.
Comparing the shares of different ethnic groups in the population of Bačka according to the results of the three censuses it can be seen:
• a significant increase in the proportion of Serbs (especially looking at the relationship 2002/ 1971);
• a significant decrease in the proportion of Hungarians and Croats in the 1971-2002 period, a slight decrease in the period 2002-2011;
• decreased proportion of Slovaks and Ruthenians;
• a significant reduction in the share of the Montenegrins;
• a disappearance of Yugoslavs and significantly increased proportion of "undeclared "
• a significant increase in the proportion of Roma.
2524
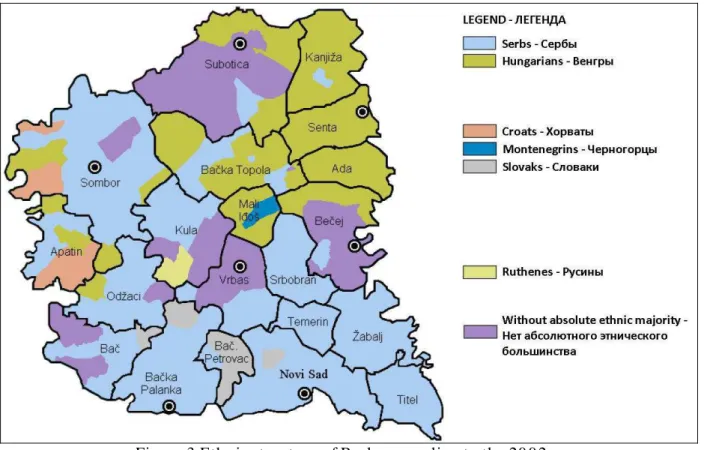
Figure 3 Ethnic structure of Backa according to the 2002 census. Source: Census 20 0 2.
It can be seen quite heterogeneous structure of ethnic groups in Bačka. Serbs had in 82 (in total of 166 settlements in Bačka) absolute and in seven relative ethnic majority (Kicošev et al., 2006). There is dominant concentration of settlements with an absolute ethnic majority of Hungarians near the border with Hungary and the Tisza river. Similarly, the Croats are concentrated in the border areas with Croatia. The Slovaks are in absolute majority in most of Bački Petrovac municipality, and in settlements Selenča in the municipality of Bač and Pivnice in the municipality of Bačka Palanka. Ruthenians make up a majority in Krstur, in the municipality of Kula.
S e rbs
Serbs since the mid-twentieth century (1953) have become the largest ethnic group in Backa. Their share in the total population of Bačka varies between 20.4% (1910), 18.8% (1941) and 58.22% (2011). A significant increase in the number of Serbs was recorded by the census 1971. This is due to spontaneous migration mainly Serbian population from passive, undeveloped areas and as a result of natural increase, which amounted to 4-5 ‰ . The increase in the number of Serbs was above the average for the total population and the share in this census reached 43.8%. Census results in 2002 registered the largest increase in the absolute number of Serbs. By this increase, Serbs for the first time made absolute ethnic majority in the population of Bačka. large increase in the number of Serbs can be found in the mechanical influx of immigrants from war- torn areas of Croatia, then Bosnia and Herzegovina, and in the late nineties from Kosovo and Metohija, too, but not in the population growth rate which shows the disturbing negative values (Kicošev et al., 2006; Đerčan et al., 2011b; Lukićet al., 2012). Based on census data from in 2011 the area of Bačka had 580 805 Serbs, which makes 58.22 %. Serbs form a majority in 10 municipalities (Sombor, Apatin, Odžaci, Kula, Vrbas, Srbobran, Temerin, Žabalj, Titel, Bačka Palanka) and the city of Novi Sad, a relative majority in the municipality of Bač.
H u n ga ria n s
2525
and 42.4 % (1910). Absolute highest number Hungarians in Bačka recorded in census 1961 as a result of high population growth rate. The following censuses recorded decrease in all three parameters due to exacerbated biological structures and declining birth rates, and consistently negative net migration because of going abroad to work. Another reason for decreased number of Hungarians was declaration of 9,200 of them as Yugoslavs (1981) during the former Yugoslavia (Kicošev, 1990). In inter-census decade (1991-2002) there was a significant emigration of Hungarians to the home country because of the well-known political and economic circumstances in which Serbia was after in 1992 ( Kicošev et al., 2006) .
According to the census 2002 the Hungarians in 50 settlements had absolute ethnic majority, and in five settlements had relative majority. It is interesting to note that the settlements Obornjača and Mali Pesak are purely ethnic Hungarian settlements (proportion of Hungarians is 100 %) and they are the only ethnically pure villages even in Vojvodina (Kicošev, 1992) .
According to census 2011 in the territory of Backa there were 193 343 Hungarians, which is 19.38%. Hungarians constitute a majority in five municipalities (Bačka Topola, Mali Iđoš, Kanjiža, Senta, Ada), a relative majority in two municipalities: Subotica and Bečej.
Cro a ts
Croats are the third largest ethnic group in Bačka in the postwar period. Their share varies from 0.1% (1900) to 11.0 % (1961). The number of Croats continuously has grown from 1900 to the census in 1961 when they recorded their highest absolute number and proportion, followed by a decline in these indicators in the next four censuses (Kicošev et al., 2006). In addition to the unfavorable age structure and decline in population growth, going abroad to work also contributed to decline in number of Croats. Also, censuses 1981 and 1991 showed noticeably increaseed declaration of Croats, Šokci and Bunjevci as Yugoslavs (Kicošev, 1990), so Backi Monoštor in 1991 was the only town in Vojvodina, with a relative ethnic majority of Yugoslavs.
According to census 2002 the Croats in Backa had absolute ethnic majority in three towns: Senta, Bački Breg and Bački Breg i Monoštor, and in six relative majority: Djurdjin, Gornji and Donji Tavankut, Bikovo, Mala Bosna and Stari Žednik. Bunjevaci at the same time had a relative ethnic majority only in settlement of Ljutovo (Kicošev et al., 2006).
According to census data in 2011 in the territory of Bačka lived 32,951 Croats, which is 3.30%.
S lo va ks
Slovaks are the fourth largest ethnic group in Bačka. Their maximum share of 4.5 % they recorded in 1900 and in 1948, and the minimum 2.51 % according to the last census in 2011. Their absolute number has constantly grown since the beginning of the twentieth century to the list in 1961, followed by steady decrease (Kicošev et al., 2006).
Censuses in 1971, 1981, 1991 and 2002 recorded continuous decrease in all three indicators, primarily due to poor biological structures and going to work abroad. Slovaks did not declared themselves as Yugoslavs to a greater extent in the census in 1981 and 1991 (Kicošev, 1990) that is they were not heavily affected by the process of spontaneous assimilation. According to the 2002 census the Slovaks in Bačka had absolute ethnic majority in six villages: Kisač, Selenča, Pivnice, Bački Petrovac, Gložan and Kulpin and relative ethnic majority in the village of Lalić (Kicošev et al., 2006).
According to census 2011 in the territory of Backa lived 25,042 Slovaks, which is 2.51 %. Slovaks form the absolute majority in the municipality of Bački Petrovac.
Ru th e n ia n s
2526
Based on the data from census in 2001 in Bačka lived 11,915 Ruthenians, who made up 1.19% of the total population.
Th e Yu go s la vs
Number of Yugoslavs varies from 29.006 (1971) to 33,201 (2002), that is, their number has increased by 4,195 persons. However, a group of Yugoslavs recorded significantly higher values in the censuses in 1981 and 1991 when it is registered over a hundred thousand people who identified themselves as belonging to this group which is not ethnic. Also, some of the Serbs began to declare themselves as Yugoslavs, which is probably the key point in the analysis of the decrease in the share of Serbs in this period (Kicošev, 1990). This fact stems from the turbulent political situation and ethnic homogeneity of the population. After the disintegration of Yugoslavia, for dome time, this group was one of the most dominant in the territory of Bačka, which can be explained by the increased declaration of population from mixed marriages.
In the last inter-census decade significantly decrease in the number of persons in this category can be seen (by 25,126) so that they now make up 0.81 % of the total population, which showed some fading of the group due to the disintegration of the Socialist Federal Republic of Yugoslavia and the Federal Republic of Yugoslavia.
Oth e r e th n ic gro u p s
2527
Figure 4 The ethnic structure of the municipalities of Backa according to the census 2011. Source: Census 20 11
Based on data on the ethnic composition of the municipality of Bačka, obtained by census 2011, the map 4 was made. It can be seen that Serbs constitute a majority in 10 municipalities (Sombor, Apatin, Odžaci, Kula, Vrbas, Srbobran, Temerin, Žabalj, Titel, Bačka Palanka) and the city of Novi Sad, and relative majority in the municipality of Bač. Hungarians constitute a majority in five municipalities (Bačka Topola, Mali Iđoš, Kanjiža, Senta, Ada), a relative majority in two municipalities: Subotica and Bečej. Slovaks have absolute majority in the municipality of Bački Petrovac.
Co n c lu s io n
2528
the Hungarians, Croats, Slovaks and Ruthenians are declining in number, while the Yugoslavs disappear.
Figure 4 shows areas that are selected based on analysis of the ethnic composition of the population in some municipalities. This map shows that there are no absolutely pure areas in the region of Bačka, though there are parts with dominant Serbian, Hungarian or Slovak population, and that the heterogeneity is the main features in the ethnic composition of Bačka.
Although in recent years ethnic makeup of Bačka has been partly changed it continues to represent an ethnic mosaic that makes up as much as 29 ethnic groups. It should also be noted that this regionalization is not immutable category, as the population is a highly dynamic phenomena in space.
Ac kn o w le d gm e n ts
The authors would like to express their sincere thanks to the Ministry of Education, Science and Technological Development, Republic of Serbia – Project No. 176020, and to the Provincial Secretariat for Science and Technological Development of the Vojvodina Province, Republic of Serbia – Project No. 114-451-3938/ 2013-02, for their financial support.
Re fe re n ce s :
1. Brubaker, R. (2004). Ethnicity w ithout groups, Cambridge: Harvard University Press. 2. Bubalo-Živković, M., Đerčan, B. (2008). Regionalizacija Bačke na osnovu etničke strukture stanovništva. Zbornik radov a Departm ana za geografiju, turizam i hotelijerstv o, No. 37, pp. 31– 41.
3. Bubalo-Živković, M., Lukić, T., Đerčan, B. (2012). Demografski problemi opštine Alibunar. Zbornik radova Departm ana za geografiju, turizam i hotelijerstv o, No. 41, pp. 70-83.
4. Bubalo-Živković, M., Lukić, T., Đerčan, B., Ivkov-Džigurski, A. (2011). Prirodne i mehaničke demografske promene i njihove posledice u pograničnim naseljima Banata. Zbornik radov a Departm ana za geografiju, turizam i hotelijerstv o, No. 40, pp. 43-58.
5. Bukurov, B. (1957). Poreklo stanov ništv a Vojv odine. Novi Sad: Matica srpska. 6. Bukurov, B. (1978). Bačka, Banat i Srem. Novi Sad: Matica srpska.
7. Cvetanović, M., Đerčan, B. (2009). Marital status and ethnicity in Bačka according to the 2002 census. Geographica Tim isiensis, Vol. 18, No. 1-2, pp. 61-75.
8. Đerčan, B., Bubalo-Živković, M., Lukić, T. (2010). Demografske promene u pograničnim naseljima Srema na primeru Vašice. Zbornik radova Geografskog fakulteta u Beogradu, Vol. LVIII, pp. 63-80,
9. Đerčan, B., Bubalo-Živković, M., Lukić, T., Stojsavljević, R., Ćurčić, G. (2011a). Regionalizacija Bačke prema keoficijentu maskuliniteta četiri etničke manjine. Zbornik radov a Departm ana za geografiju, turizam i hotelijerstvo, No. 40, pp. 59-76
10. Đerčan, B., Cvetanović, M., Bubalo-Živković, M., Kicošev, S. (2011b). The Change in Ethnic Structure in Border Municipalities of Banat (Vojvodina, Serbia). Geographica Tim isiensis, Vol. 20, No. 1, pp. 21-30.
11. Đere, Z. (2004). Skica promena etničkog sastava stanovništva na tlu današnje Vojvodine 1526-1910. godine. Istraživ anja, No. 15, pp. 105-123.
12. Đurđev, B. (1995). Posleratno naseljavanje Vojv odine. Novi Sad: Matica srpska.
13. Eriksen T.H. (2002). Ethnicity and nationalism. Pluto Press, London & Sterling, Virginia.
14. Garment, D. (1993). The International Relations Dimension of Ethnic Conflict: Concepts, Indicators, and Theory. Journal of Peace R esearch, 30(2), pp. 137-50.
15. Gavrilović S. (1972). Srem, Banat i Bačka od kraja XVIII do sredine XIX veka. Zbornik M atice srpske za istoriju, sv. XX(6), pp. 9– 26.
16. Gavrilović, S. (1991). O borbi Srba u Habsburškoj Monarhiji za političko-teritorijalnu autonomiju. Zbornik M atice srpske za istoriju, No. 43, pp. 7– 23.
17. Hall, T. D. (2004). “Ethnic Conflict as a Global Social Problem.” In: H andbook of Social Problem s, edited by George Ritzer. London: Sage. pp. 139-155.
2529
19. Kicošev, S. (1990). Neki aspekti popisne kategorije J ugoslovena u SAP Vojvodini. Zbornik radov a Departm ana za geografiju, turizam i hotelijerstv o, No. 20, pp. 75-80.
20. Kicošev, S. (1992). Promene broja stanovnika Bačke tokom 20. veka. Zbornik radova Departm ana za geografiju, turizam i hotelijerstvo, No. 22, pp. 67-74.
21. Kicošev, S., Bubalo-Živković, M., Ivkov, A. (2006). Stanov ništv o Bačke. Novi Sad: Univerzitet u Novom Sadu, Prirodno-matematički fakultet, Departman za geografiju, turizam i hotelijerstvo.
22. Lukić, T., Stojsavljević, R., Đurđev, B., Nađ, I. and Đerčan, B. (2012). Depopulation in the Western Balkan Countries. European Journal of Geography, Volume 3, Issue 2, pp. 6-23.
23. Mitchell, B., Kicošev, S. (1997). A Brief Population History of the Vojvodina 1683-1718. Geographica Pannonica, No 1, pp. 18-21.
24. Popis stanovništva (1971). Popis stanov ništva 1971. Beograd: Savezni zavod za statistiku. 25. Popis stanovništva (2002). Popis stanovništva, domaćinstava i stanova u 2002, Nacionalna ili etnička pripadnost. Beograd: Republički zavod za statistiku,.
26. Popis stanovništva (2011). Popis stanovništva, domaćinstava i stanova 2011. u R epublici Srbiji, N acionalna pripadnost, Podaci po opštinam a i gradov im a. Beograd: Republički zavod za statistiku.
27. Veselinović, R. (1986). Srbija pod austrijskom vlašću, Istorija srpskog naroda, IV, Beograd, pp. 106– 162.