the
Drosophila
Genome
Natalya G. Andreyenkova1., Tatyana D. Kolesnikova1., Igor V. Makunin1,2
, Galina V. Pokholkova1, Lidiya V. Boldyreva1, Tatyana Yu. Zykova1, Igor F. Zhimulev1*, Elena S. Belyaeva1
1Institute of Molecular and Cellular Biology, Siberian Branch of the Russian Academy of Sciences, Novosibirsk, Russia,2Research Computing Centre, The University of Queensland, Brisbane, St Lucia, QLD, Australia
Abstract
Drosophila chromosomes are organized into distinct domains differing in their predominant chromatin composition, replication timing and evolutionary conservation. We show on a genome-wide level that genes whose order has remained unaltered across 9 Drosophila species display late replication timing and frequently map to the regions of repressive chromatin. This observation is consistent with the existence of extensive domains of repressive chromatin that replicate extremely late and have conserved gene order in the Drosophila genome. We suggest that such repressive chromatin domains correspond to a handful of regions that complete replication at the very end of S phase. We further demonstrate that the order of genes in these regions is rarely altered in evolution. Substantial proportion of such regions significantly coincide with large synteny blocks. This indicates that there are evolutionary mechanisms maintaining the integrity of these late-replicating chromatin domains. The synteny blocks corresponding to the extremely late-replicating regions in theD. melanogastergenome consistently display two-fold lower gene density across differentDrosophilaspecies.
Citation:Andreyenkova NG, Kolesnikova TD, Makunin IV, Pokholkova GV, Boldyreva LV, et al. (2013) Late Replication Domains Are Evolutionary Conserved in the DrosophilaGenome. PLoS ONE 8(12): e83319. doi:10.1371/journal.pone.0083319
Editor:Kristin C. Scott, Duke University, United States of America
ReceivedJune 6, 2013;AcceptedNovember 1, 2013;PublishedDecember 31, 2013
Copyright:ß2013 Andreyenkova et al. This is an open-access article distributed under the terms of the Creative Commons Attribution License, which permits unrestricted use, distribution, and reproduction in any medium, provided the original author and source are credited.
Funding:The research was funded by program of Russian Academy of Sciences ‘‘Molecular and Cellular Biology’’ 6.3; Integration projects of SB RAS#51 and #82, and the Russian Foundation for Basic Research (#13-04-01669-a). The funders had no role in study design, data collection and analysis, decision to publish, or preparation of the manuscript.
Competing Interests:The authors have declared that no competing interests exist. * E-mail: [email protected]
.These authors contributed equally to this work.
Introduction
Domain organization of the genome has recently become central to our understanding of how eukaryotic genome functions. There are many ways to subdivide a genome into distinct domains and then search for the correlation between the distribution of genes and specific chromatin features. Clearly, domain organiza-tion is essential for proper funcorganiza-tioning of the genome. However, the very functionality of such domains typically remains untested. One of the parameters that could confirm the functional importance of a specific sequence in the genome is its evolutionary conservation. Recent studies of Drosophila genome evolution showed that there are regions where chromosome rearrangement breakpoints tend to cluster, and which have been recurrently used in evolution. On the other hand, there are regions that are virtually never involved in rearrangements [1,2]. Hence, the question is what is so special about these regions where gene order remains intact across different species?
Earlier it was shown thatDrosophila genes tend to be clustered into chromatin domains. These domains are characterized by various combinations of chromatin proteins. Domains enriched with histone H1, LAM, SUUR and D1 (markers of repressive chromatin) display higher conservation of gene order betweenD. melanogasterandD. pseudoobscura[3]. In a later study comparing nine Drosophila species [4], chromatin domains associated with B-type
Lamin and SUUR had the lowest probability of being disrupted by rearrangement breakpoints.
‘‘weak spots’’ and ectopic pairing were originally established as the cytological markers of underreplicated regions.
As early as in 1939, underreplicated regions appearing in polytene chromosomes as large dense bands were called interca-lary heterochromatin (IH) [14]: morphologically they looked similar to the classic pericentric heterochromatin. However, in contrast to pericentric heterochromatin, IH domains are not enriched in repeated DNA sequences. They are typically composed of unique genes scattered throughout the regions at a lower than the genome average density [15,16]. One of the molecular markers of late replication is SUUR protein. SUUR levels modulate underreplication [17–19] by decreasing replication fork progression rate [20].
Genome-wide mapping of IH regions was performed using underreplication as a marker [15,19]. Underreplicated regions thus far identified span several hundreds kb and comprise up to several dozens of genes. Despite the fact that borders of IH regions could only be approximately inferred from the local levels of underreplication, these studies allowed comparison of chromatin organization in polytene chromosomes and in chromosomes from mitotically dividing cells. The level of underreplication in polytene chromosomes was found to be positively correlated with SUUR enrichment in chromosomes of embryonic Kc cell line [21,22]. Thus, IH regions represent a special class of chromatin domains that are formed not just in polytene chromosomes, but in chromosomes of proliferating cells, as well.
Accurate mapping of the borders of these chromatin domains only became possible when modENCODE project data have become available [http://www.modencode.org]. It was shown that several proteins specific for the interbands of polytene chromosomes invariably mapped to the same regions in chromosomes of diploid cells [23]. Thus, the distribution of these proteins [6,24,25] marks the borders of IH regions in polytene chromosomes. Sixty such IH regions have been accurately mapped to date [22]. These 60 regions are hereafter referred to as UR(B)-regions. They turned out to correspond to large domains of BLACK repressive chromatin [6].
It must be emphasized that in addition to these 60 IH regions, a handful of sites also demonstrate ‘‘weak spots’’ and under-replication, albeit to a lesser extent [7,19]. These sites still await accurate mapping, so in this paper we only analyze UR(B)-regions. Besides underreplicated regions, in salivary gland polytene chromosomes there are many other domains of late replication; they are marked with SUUR, yet display no underreplication. Grouping the regions into underreplicated and late-replicating subsets is somewhat arbitrary, because underreplication is restricted to polytene chromosomes, it is dependent on SuUR gene dosage [7] and is tissue-specific [19]. We will nevertheless keep this classification to facilitate data presentation.
Knowledge of exact borders of UR(B)-regions allowed the detailed analysis of their features at the molecular level. These regions were established as extensive domains of repressive chromatin that are virtually devoid of replication origins both in salivary gland chromosomes and in cell lines [6,20,22,26]. Absence of internal origins of replication, large size and stalling of replication fork in the presence of SUUR – all these factors contribute to DNA underreplication in polytene chromosomes. UR(B)-regions are known to house many tissue-specific genes, which require complex regulation of expression. So one can expect these peculiar domains to be conserved in evolution, i.e. that these regions are ‘‘cold spots’’ for chromosome rearrangement break-points.
In this work, we show that in contrast to other genes, late-replicating genes in BLACK chromatin tend to preferentially keep
the linkage with their neighbors. Then we proceed to explore the conservation of gene order in UR(B)-regions and conclude that they are rarely broken by chromosomal rearrangements and frequently correspond to large synteny blocks. Conversely, large synteny blocks also tend to map to UR(B)-regions. We can thus link the regions with conserved gene order to specific chromatin domains with known borders. This allowed a more comprehensive analysis of these regions at the domain level, rather than on a gene-by-gene basis, as was performed previously [4]. As a result, we show that high IGA-scoring regions typically harbour repressed chromatin; they display narrow temporal expression pattern, extra-late replication and low gene density. Notably, we show that the latter feature tends to be present across different Drosophila species, which suggests the evolutionary conservation of both gene order and chromatin status.
Results
We analyzed the evolution of gene order in repressive late-replicating domains of Drosophila genome. As a measure of conservation, we used «orthologous landmarks» (OLs) from the work of Grotthuss and colleagues [2]. OLs were identified upon comparison of 9 Drosophila species: D. melanogaster, D. erecta, D. yakuba, D. ananassae, D. pseudoobscura, D. willistoni, D. virilis, D. mojavensis and D. grimshawi. To build OLs, the authors used independent gene anchors (IGAs): each of the IGAs corresponded to a single gene or to a group of physically linked (overlapping) genes, and was considered as a single evolutionary unit [2]. Every OL is represented either by a set of IGAs, whose order (for orthologous genes) remains intact across nineDrosophilaspecies or by an individual IGA found in all the species analyzed. Three ways to subdivide the genome into OLs were proposed, depending on the stringency of synteny definition [2].
Our results were obtained on synteny blocks defined by a GO criterion requiring conservation of Gene Order regardless of gene orientation, and were reproduced using other definitions of synteny blocks based on the conservation of Gene Order and Orientation (GOO), as well as using Overall Local Contiguity (OLC) dataset where gene scrambling within an OL is permitted.
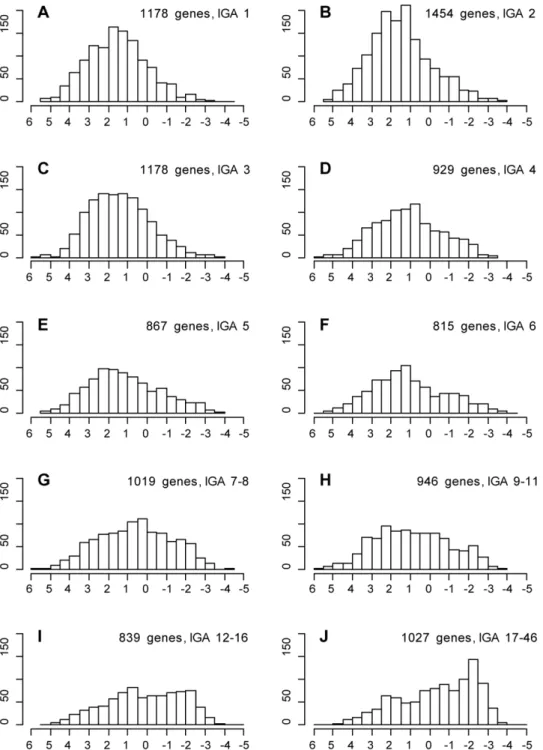
Genes from multigenic OLs display late replication timing and mainly map to repressive regions of BLACK
chromatin
line [27] (Fig. S1; Table S2), which lends further support to the idea that later replication is characteristic of the regions with conserved gene order.
It was shown that in Kc cells chromatin domains defined by specific sets of proteins displayed distinct replication timing [6]. Repressive BLACK chromatin is the last to undergo replication, whereas active YELLOW chromatin, encompassing predomi-nantly house-keeping genes, replicates early. Accordingly, taking into account that late replication appears linked with high IGA-scoring OLs, BLACK chromatin domains would be expected to
display higher conservation of gene order, whereas YELLOW chromatin would be less conserved.
To test this idea, we analyzed whether IGA score correlated with repressive BLACK or active YELLOW chromatin types. Figure 2 shows that there are two pronounced trends: BLACK chromatin is quantitatively enriched with multigenic OLs, whereas YELLOW chromatin is generally composed of oligogenic OLs (for statistics, see Table S3). Out of 1,178 genes with IGA score 1, only 121 (10%) have .50% of their base pairs covered by BLACK chromatin compared to 600 out of 1027 (58%) genes with IGA score 17–48 (262 contingency table, the Yates Chi [2] 575.86, P-Figure 1. Replication time in Kc cells for genes in OLs with different IGA scores.Replication score is shown on theXaxes, with+6
value 3E-127). By contrast, YELLOW chromatin covers more than 50% of base pairs in 787 genes (67%) with IGA score 1, but it is found only in 182 genes (18%) with IGA score 17–48 (262 contingency table, the Yates Chi [2] 534.68, P-value 3E-118). We therefore suggest that chromatin domains showing late replication are the zones with conserved gene order.
UR(B)-regions are characterized by low level of synteny breaks
Having established that late-replicating genes are predominant-ly found in the regions with higher degree of gene order conservation, we focused our analysis on a set of 60 regions replicating very late in salivary glands [22] (see Introduction for more details). These 60 UR(B)-regions cover 14.8 Mb (12.3%) of the euchromatic part of the D. melanogaster genome but overlap with just 106 OLs (4%). In order to estimate the statistical significance, we shuffled these 60 regions in the genome using BEDTools shuffleBed [28] and counted the overlapping OLs. In 100,000 shuffling iterations, the smallest number of OLs overlapping the ‘‘randomized’’ set of UR(B)-regions was 235, indicating that the observed number of overlaps is significantly lower than expected by chance (P-value,1E-5). On average, the ‘‘randomized’’ UR(B)-regions overlapped 357 OLs, 3.4 times more than the observed value. A similar trend was found using other definitions of synteny [2] (see Text S1).
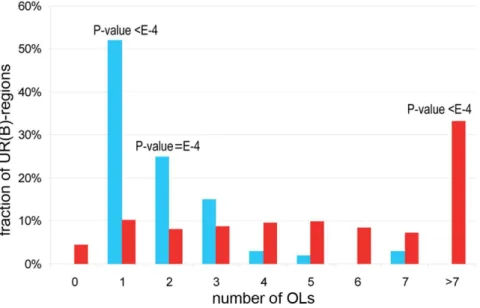
While the number of OLs overlapping any UR(B)-region ranges from one to seven, 31 (52%) UR(B)-regions overlap with just a single OL (Fig. 3), 5.1-fold more than the average 6.1 observed in the shuffled control (100,000 iterations, P-value,1E-5). The number of UR(B)-regions overlapping with just two OLs is also higher than expected. By contrast, significantly fewer UR(B)-regions overlap with multiple OLs (Fig. 3).
Out of 60 UR(B)-regions, 41 (68%) have at least 80% of their length covered by a single long OL, 4.7-fold more than expected (shuffling, 100,000 iterations, average 8.8, maximal number of regions with at least 80% coverage - 22, P-value,1E-5). This result shows that most UR(B)-regions have significant proportion of their length covered by a single synteny block.
OLs overlapping UR(B)-regions have more IGAs. Out of 106 OLs that overlap with UR(B)-regions, there are 50 OLs (47.2%) with IGA scores 5 or higher. This number of high IGA-scoring OLs is 2.8 times more than the expected number of 17.7 (Chi [2] test, P-value = 3.5E-17). In UR(B)-regions, the proportion of OLs with an IGA score 1 is less than 10%, compared to 35% observed for the entire genome. By contrast, the fraction of multigenic OLs is significantly higher in UR(B)-regions than across the genome (Fig. 4, Fig. S2). The average IGA score of OLs in the genome is ,3.4 (median 2), whereas OLs located in UR(B)-regions have an average IGA score of 8.3 (median 5). Thus, OLs in UR(B)-regions have higher IGA scores compared to the genome-average (Chi [2] test, P-value,1E-6).
Our results demonstrate that majority of UR(B)-regions overlap multigenic OLs. More than half of UR(B)-regions overlap with just one OL. Furthermore, 68% of UR(B)-regions have at least 80% of their sequence covered by a single OL indicating that UR(B)-regions have fewer synteny breaks compared to the expectation based on the random distribution of UR(B)-regions in the genome. At the same time, the proportion of multigenic OLs is higher in UR(B)-regions compared to the genome average.
Unfortunately, the exact positions of synteny breakpoints between OLs are not known. We used midpoints between neighboring OLs as a proxy for synteny breaks. Out of 60 UR(B)-regions, 24 (40%) do not overlap with such ‘‘synteny breaks’’, which is 3.2 times less than observed in the shuffled control (100,000 iterations, maximal number of regions without the breaks - 21, P-value,1E-5). In addition, 20 UR(B)-regions (33%) overlap with just one ‘‘synteny break’’, 3.9-fold less than observed in shuffling (100,000 iterations, maximal number of regions with one break - 17, P-value,1E-5).
Many UR(B)-regions coincide with OLs
A significant proportion of UR(B)-regions almost entirely coincide with OLs. Fig. 5 illustrates relative positions of several groups of UR(B)-regions and OLs (all regions are shown in Fig. S3). To quantify the extent of this match, we selected UR(B)-OL pairs with greater than 80% reciprocal overlap. Out of 60 UR(B)-regions, 17 have nearly perfect overlap with a single long OL: at
Figure 2. IGA score for genes covered by BLACK and YELLOW chromatin.Xaxis shows the number of IGAs within OLs assigned to genes; gene counts are shown on theYaxis.
least 80% of UR(B)-region sequences are covered by a single OL, and, vice versa, the UR(B)-region covers at least 80% of the corresponding OL. In 100,000 shuffling iterations the average number of UR(B)-OL pairs with at least 80% reciprocal overlap was 2.1, 8.1 times less than the observed value, and the highest number was 12, consistent with a P-value below 1E-5. Notably, the UR(B)-region 50C shows 79.8%/93.3% reciprocal overlap with an OL (just slightly below the 80% cutoff), which further increases the proportion of UR(B)-regions significantly overlap-ping with OLs. Similar trend was observed using other definitions of synteny [2] (see Supplementary text S1 for details).
The proportion of UR(B)-regions showing nearly perfect overlap with OLs is even higher if we consider closely located UR(B)-regions. In 7 cases, pairs of UR(B)-regions are separated by fairly small regions of active chromatin ranging from several kb to several dozens kb, but both UR(B)-regions in a pair are covered by
the same OL. Out of 7 such pairs, 6 have reciprocal overlap with a single OL for at least 80% of their length. If we consider such pairs as a single region, 45% of UR(B)-regions would have at least 80% reciprocal overlap with a single OL. This supports our idea that significant proportion of UR(B)-regions are cold-spots for chro-mosomal rearrangements, as compared to the total genome where synteny breaks on average happen more frequently.
Ultraconservative OLs map to the late-replicating regions of polytene chromosomes
We showed that OLs overlapping UR(B)-regions had on average more genes (IGAs) compared to the OLs across the entire genome. We then tested whether the opposite was also true, i.e. whether OLs with the highest IGA counts in the Drosophila genome were enriched among UR(B)-regions. Von Grotthuss et al. [2] identified 22 OLs encompassing over 20 IGAs, and termed Figure 3. Overlap between OLs and UR(B)-regions.Xaxis shows the number of OLs that overlap with a single UR(B)-region,Yaxis shows the percentage of the corresponding UR(B)-regions in the total set of UR(B)-regions. Blue bars indicate the numbers observed for actual UR(B)-regions. Red bars correspond to the simulated counts obtained for a randomly shuffled set of UR(B)-regions via 100,000 shuffling iterations. P-values are provided on top of the bars when differences between the observed and expected values reach statistical significance.
doi:10.1371/journal.pone.0083319.g003
Figure 4. Distribution of OLs with different IGA scores across the genome and in UR(B)-regions.IGA counts per OL are shown on theX
them ultra-conserved regions (UCRs). Just 8 out of 22 UCRs co-localize with UR(B)-regions, not much different from an average value obtained in the shuffled control. In order to test if any of the remaining UCRs map to the late-replicating regions, we mapped the probes from these regions on polytene chromosomes using FISH. For every region, we designed a FISH probe within its central part and hybridized it to salivary gland polytene chromosomes (Fig. S4). Table 1 summarizes cytological mapping data obtained for all such probes. 13 out of 22 UCRs (,59%) were observed to map to the underreplicated regions, which were documented to have weak spots, late replication sites and SUUR binding. 6 UCRs (27%) match the positions of late-replicating regions bound by SUUR. Three UCRs (14%) do not coincide with the regions showing late replication. Thus, the vast majority of UCRs are found in the regions of late replication, and over half of UCRs map to underreplicated regions.
OLs in UR(B)-regions are among the longest in the genome
OLs overlapping UR(B)-regions tend to be long. The average and median lengths of OLs overlapping UR(B)-regions are 150 kb and 93.1 kb, respectively, 4.1- and 7.5-fold higher than the genomic average 36.3 kb or median 12.5 kb.
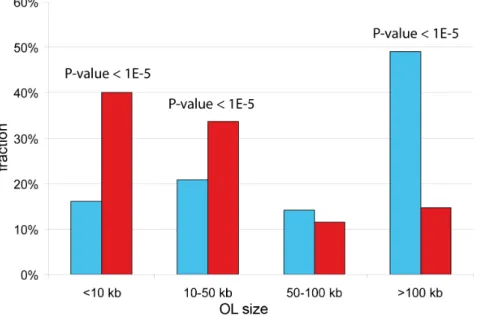
The fraction of OLs below 10 kb is 2.5-fold lower in UR(B)-regions as compared to the randomly shuffled UR(B)-UR(B)-regions (16.0% vs 40.1%, range 28.4%–54.6%, P-value,1E-5) (Fig. 6). Likewise, OLs ranging 10–50 kb are underrepresented in UR(B)-regions (20.8 vs 33.7, range 23.3%–43.1%, P-value,1E-5). OLs ranging 50–100 kb show no statistical difference with shuffled values (14.1% vs 11.5%). However, there are 3.3-fold more OLs spanning over 100 kb in UR(B)-regions, as compared to the expected value (49.1% vs 14.7%) (Fig. 6). Thus, OLs within UR(B)-regions have large physical size. The same trend for longer OLs within UR(B)-regions was observed using OLC and GOO definitions (Text S1).
Out of 30 longest OLs found in theDrosophilagenome, 18 OLs (60%) overlap with UR(B)-regions. In 100,000 iterations, on
average only 8.5 longest OLs overlapped with randomly shuffled UR(B)-regions, 2.1-fold less that the observed value (P-value = 9E-5), and the remaining 12 longest OLs were co-localized with late-replicating regions and/or regions stained by SUUR antibodies (Table 2). We conclude that the longest OLs in the genome are biased toward UR(B)-regions.
While on average UR(B)-regions have OLs with more IGAs than is found throughout the genome (see above), not all UR(B)-regions coincide with high-IGA OLs. For instance, the region 70C1-2 shows almost perfect overlap with OL#1847, which has just 2 IGAs, yet spans 313 kb. Similar examples include the regions 33A1-2, 77E1-4 and 92D1-4, which map to OL#831 (6 IGAs, 221 kb),# 1995 (7 IGAs, 241 kb) and #2424 (7 IGAs, 188 kb), respectively. Such a combination of big length and low IGA counts within synteny blocks reflects low gene density that is characteristic of underreplicated regions [16].
UR(B)-regions found in D. melanogaster display similar features in other Drosophila species
Lower gene density was shown to be a good predictor of underreplicated region localization in D. melanogaster[16], so we explored whether this was also observed for other Drosophila species. Indeed, substantial overlap between UR(B)-regions and OLs is indicative of the preservation of such regions in other species. From the data on OL localization to UR(B)-regions inD. melanogaster, we can readily estimate gene density in these same OLs in other species. Lower gene density within OLs would indirectly support the idea that the properties of underreplicated regions are maintained within OLs throughout evolution.
To estimate gene density in non-melanogasterDrosophilaspecies, we adapted the approach described by [16], where gene density was compared within and immediately outside of underreplicated regions. For this analysis, we selected the OLs that displayed greater than 80% overlap with regions (pairs of UR(B)-regions covered by a single OL were considered as a single region). We removed OL regions whose flanking sequences overlapped with the neighboring UR(B)-regions. In total, there were 18 OLs Figure 5. Examples of different types of overlap between UR(B)-regions and OLs.Different scales are used for each region. Wide black box denotes an UR(B)-region (name is shown on the left). Narrow colored boxes below correspond to OLs (black:,50 kb; yellow: 50–100 kb; orange: 100–200 kb, red: 200–500 kb, blue:.500 kb). The IGA score is shown under each OL overlapping the UR(B)-region. For each type of overlap two examples are shown.A- nearly exact correspondence between UR(B)-region and long OL, with reciprocal overlap over 80%;B– reciprocal overlap ranges 65–80%;C– UR(B)-region overlaps with a large OL, but the extent of overlap is below 65%;D– UR(B)-region overlaps with several smaller OLs, neither of which appears to be dominant length-wise.
Table 1.Localization and properties of UCRs.
#OL Number of IGAs
Genomic location (genome 5
release) Size (bp)
Cytology location (polytene band)
Relation to UR-regions
1 98 24 chrX:2628361-3026836 398476 3C3-5* UR
2 598 22 chr2L:1170235-1502903 332669 22A1-3* UR
3 652 25 chr2L:3530904-3784129 253226 24A1-2*
-4 713 29 chr2L:6127867-6455934 328068 26C1-2 UR(B)
5 808 28 chr2L:9934750-10202233 267484 31A1-2* UR
6 872 21 chr2L:13914726-14328265 413540 34F1-4* UR
7 1025 29 chr2R:2892724-3110885 218162 43A1-2* LR
8 1354 24 chr2R:14072292-14327986 255695 55C1-5* LR
9 1384 28 chr2R:15395673-16100124 704452 56F** LR
10 1430 22 chr2R:17580236-17863710 283475 58A3-4 UR(B)
11 1471 21 chr2R:18968085-19242753 274669 59D1-4 UR(B)
12 1669 46 chr3L:4407146-4996877 589732 64C1-2; 64C3-4 UR(B)
13 1693 25 chr3L:6068660-6166966 98307 65A1-6* LR
14 1717 29 chr3L:7362900-7633601 270702 66A1-2* LR
15 1744 27 chr3L:8617474-8925165 307692 66E1-2*
-16 1776 23 chr3L:10088848-10656077 567230 67D9-12 UR(B)
17 1893 35 chr3L:16225132-16340720 115589 72E1-2* LR
18 2106 43 chr3R:1690872-2173240 482369 83E1-2 UR(B)
19 2124 35 chr3R:3073872-3622321 548450 84D3-4;84D9-10 UR(B)
20 2533 26 chr3R:20159146-20356280 197135 96A1-2* UR
21 2598 22 chr3R:22811389-22937977 126589 97E1-2*
-22 2665 31 chr3R:26407921-26762229 354309 100A1-2; 100B1-2 UR(B)
*FISH mapping performed in the present paper.
**FISH-based FlyBase mapping data in wild type chromosomes (for further details see Materials and Methods). LR – late-replicating region.
UR – underreplicated region. doi:10.1371/journal.pone.0083319.t001
Figure 6. Comparison between the observed and simulated distributions of OL lengths in UR(B)-regions and across the genome.OL length is shown on theXaxis. The observed percentage of OLs of a given size in UR(B)-regions is shown as blue. Red bars denote an average value obtained for a randomly shuffled set of UR(B)-regions by 100,000 shuffling iterations. P-values are shown on top of the bars where statistically significant differences between the real and expected values are achieved.
overlapping with 23 UR(B)-regions, including 5 ‘‘split’’ OL regions (see Materials and Methods). Gene density in these selected D. melanogasterOLs was 2.2 times lower than in the flanking regions (Table S4, one-tailed paired ttest, P-value = 1.6E-7), which is in good agreement with the previously published data [16].
In D. pseudoobscura and D. virilis, gene density in 18 OLs corresponding to theD. melanogasterUR(B)-regions is 2.1- and 2.2-fold lower compared to the flanks (one-tailed paired ttest, P-value = 1.4E-6 and 2.3E-5). Only 13 OLs corresponding to theD. melanogasterUR(B)-regions have satisfactory assembly quality in the D. grimshawi genome (gene density is 1.7-fold lower than in the flanks, one-tailed paired ttest, P-value = 3.7E-4). The same is observed for 17 OLs in theD. mojavensisgenome: gene density is 2.3-fold lower compared to the flanks, one-tailed paired ttest, P-value = 9.6E-5. In all of these species, gene density in OLs corresponding toD. melanogasterUR(B)-regions is roughly twice as
low as in the flanking sequences (Fig. 7, Table S4). Thus, we can conclude that low gene density is a property of these regions that is conserved throughout evolution.
Discussion
Until recently, synteny could only be studied at the level of large chromosomal blocks. There are numerous studies exploring synteny in mammals, however, as a rule synteny blocks of small sizes were omitted from these analyses, and conclusions were typically based on the data with resolution on the order of megabase pairs [29, and references therein]. Resolution threshold varied from paper to paper, and this circumstance dictated the outcome of analysis [30]. Despite this, the common theme for mammalian genome studies was the presence of cold and hot spots of chromosomal rearrangements [31–33]. The zones that were Table 2.Cytology positions of the largest OLs.
#OL Size (bp) IGA value Cytology location Relation to the UR-regions
1 1384 704452 28 56F** LR
2 921 630503 20 36D1-4 UR(B)
3 1669 587980 46 64C1-2; 64C3-4 UR(B)
4 1776 567230 23 67D9-12 UR(B)
5 2124 548450 35 84D3-4; 84D9-10 UR(B)
6 1948 514362 19 75C1-2 UR(B)
7 551 487465 18 19E1-2; 19E3-4 UR(B)
8 2106 482369 43 83E1-2 UR(B)
9 852 418522 17 34A1-2 UR(B)
10 872 413540 21 34F1-4* UR
11 98 398476 24 3C1-5* UR
12 2620 383126 13 98C{ UR
13 2414 379580 14 92A** LR
14 395 369210 17 12E1-2 UR(B)
15 1871 360550 12 71C1-2 UR(B)
16 2665 354309 31 100A1-2; 100B1-2 UR(B)
17 996 352347 13 40C` UR
18 830 347613 13 33A**{ UR
19 1839 346113 14 70A1-2; 70A4-5 UR(B)
20 212 338653 9 7B1-2 UR(B)
21 791 335570 16 30A** UR
22 598 332669 22 22A1-3* UR
23 1857 330850 11 70D** LR
24 655 330344 12 24D**{ UR
25 671 328842 10 25A1-4 UR(B)
26 713 328068 29 26C1-2 UR(B)
27 2276 324929 18 87D1-2 UR(B)
28 2222 324302 17 86D1-2 UR(B)
29 1315 315415 14 54AB** LR
30 1847 313407 2 70C1-2 UR(B)
*FISH mapping performed in the present paper.
**FlyBase FISH mapping data in wild type chromosomes (further details in Materials and Methods).
{Mapping position was deduced based on the position of the corresponding underreplication zone, according to [19].
`
Mapping position was established according to the matching underreplication zone referenced in [15]. LR – late-replicating region.
frequently hit by chromosomal rearrangements throughout evolution were typically gene-rich [34–36], had higher frequency of segmental duplications and/or repetitive elements [33,37–39], and were frequently associated with chromosome fragile sites [40]. In terms of their genetic functions, these regions were enriched for genes associated with adaptation. At the same time, rearrange-ment cold spots, where the order of genes remained fixed for millions of years, were found to be significantly enriched for genes involved in development of the central nervous and other organ systems [29].
Availability of 12 sequencedDrosophilaspecies with high-quality genome annotation within one genus [41] allows analysis of synteny at significantly greater resolution, i.e. at a gene-level accuracy. In addition, small Drosophila genome is very well characterized in terms of chromatin composition. Extensive annotation ofDrosophilagenome made it possible to draw parallels between chromatin, gene organization and gene order conserva-tion.
It was thus demonstrated that genes residing in large OLs were predominantly targeted by SUUR and LAM, – these proteins were established to locate at the nuclear periphery. De Wit et al [3] also reported the domains defined by H1, LAM, SUUR and D1 binding as having fewer synteny breaks than expected. Taking these data together, we suggest that large OLs may correspond to the domains of late replication, also known to be bound by these proteins. Such domains have been extensively studied by our group, and 60 of them replicating the latest were mapped both by cytology and molecular means (see Introduction). This allowed for comparison of domain borders with the positions of OLs. Extensive overlap between the domains of late replication and large OLs was thus demonstrated:
i) 41 out of 60 UR(B)-regions (68%) display at least 80% sequence overlap with one large OL;ii)over half of UR(B)-regions are matched by a single OL;iii)vast majority of UCRs (19 of 22)
and top 30 longest OLs overlap with UR(B)- or late-replicating regions.
The total span of 60 UR(B)-regions studied here is 14.8 Mb, which overlaps with 22% of BLACK chromatin sequence [6,22]. Thus, our results describe a substantial proportion of repressive late-replicating chromatin in the genome. Yet, one may ask whether this feature of evolutionary conservation is also charac-teristic of other BLACK chromatin regions showing late replica-tion. Our extended genome-wide analysis inD. melanogastershows that there is indeed a significant positive correlation between localization of genes to large OLs, their repressive state and late replication.
Apparently, the links between OLs, repressive chromatin and late replication established here also hold true for the genomes of otherDrosophilaspecies. This is supported by the fact that low gene density – a peculiar feature of organization of underreplicated regions [16] – is also observed for OLs from 4 moreDrosophila species. These observations indirectly support the idea that in course of evolution OLs not only keep their gene order, but also maintain the characteristic repressive chromatin status.
Conservation of gene order and repressive state of chromatin may be causally linked. For instance, the frequency of chromo-somal rearrangements may be reduced due to stronger compac-tion of repressive chromatin and/or due to as yet poorly explored mechanisms underlying formation and maintenance of the closed state of BLACK chromatin. One such mechanism may involve binding of repressive proteins at a pre-defined set of ‘‘entry sites’’ with further spreading throughout the entire domain, – as exemplified by HP1-dependent silencing [42].
Maintenance of gene order conservation in underreplicated and late-replicating regions may also be explained by the presence of intergenic regions encompassing particular regulatory sequences, such as highly conserved non-coding elements (HCNEs) required for proper gene expression [43 and references therein]. Multigenic OLs are HCNE-rich, as it was shown for 5Drosophilaspecies [43]. Accordingly, repressive BLACK chromatin was demonstrated to be enriched with HCNEs [6]. Sahagun and Ranz [44] further extended and reinforced this conclusion by analyzing 9Drosophila species. Not only did the authors show the enrichment of OLs with HCNEs, but they also provided the basic ‘‘functional portrait’’ of conserved regions behaving as regulatory domains. HCNE peaks were found in 123 OLs. Putative HCNE targets are tightly associated with specific promoter motifs; compared to other genes, they display higher incidence of severe mutant phenotypes and stronger expression profiles during important developmental transitions. It must be underlined that according to Ranz et al. [4] phylogenetic conservation of gene order is unrelated to lower recombination rate or local co-expression of genes residing within OLs. One explanation for this is that when HCNE-dependent regulation of essential genes is disrupted by chromosomal rearrangements, such events should be negatively selected. However, when an UCR#1384 encompassing 4 HCNE peaks was split by a rearrangement, no significant transcriptional changes were observed [45]. This specific case should not establish a rule, because only a single rearrangement breaking a single region was analyzed.
DNA repair may serve as one of the factors contributing to the peculiar evolution of late-replicating regions. The dynamics of various repair mechanisms throughout the cell cycle has been proposed to explain the increased mutation rate of late-replicating genes in human [46] and Drosophila [47] cells, as well as the pronounced association of Drosophila late-replicating genes with duplication hotspots [48,49]. In drosophila, vast (up to 700 kb) regions of late replication lack internal replication origins [20,22], Figure 7. Ratio of gene density in OLs overlapping
UR(B)-regions and in their immediate flanking UR(B)-regions observed in severalDrosophilaspecies.Dmel = D. melanogaster, Dpse = D. pseu-doobscura, Dvir = D. virilis,Dmoj = D. mojavensis,Dgri=D. grimshawi. OLs with a mutual overlap with UR(B)-regions of 80% or greater were used for this analysis. Each circle represents the ratio gene density in an individual OL and in its flanks. Red horizontal lines denote average ratio values calculated for the entire sampling of OLs in each species. These values are all clustered around 0.5, i.e. gene density in OLs in on average twice as low as in OL flanks.
so converging replication forks have to move long distances until they meet. This peculiar property of replication may increase the mutation rate and thereby result in the accumulation of mutations in these regions. These data argue in favor of higher rates of neutral evolution in the regions of late replication. Yet, very little is presently known about the dynamics of repair components throughout the cell cycle [49], so it is possible that the peculiarities of repair in late-replicating regions may influence the maintenance of gene order conservation.
It has recently been reported that gene pairs with short intergenic distances tend to have higher rearrangement rates as compared to the wider spaced genes [50]. Gene-dense regions of YELLOW chromatin encompassing house-keeping genes are typically localized on the borders of late-replicating regions [22]. It is tempting to speculate that these fragments of YELLOW chromatin serve as hot spots for chromosomal rearrangements, thereby shielding the regions of late replication.
To conclude, we demonstrate that extensive regions of repressive chromatin in the D. melanogaster genome display very late replication and show conserved gene order. Notably, these regions tend to exist in repressed chromatin status in other drosophila species. The reasons underlying this intriguing conser-vation of gene order are poorly explored and prompt further research.
Materials and Methods
Correlation of replication timing and numbers of IGAs per OL
Gene loci were defined as genomic intervals between the leftmost Start and rightmost End positions of all transcript variants for every FlyBase 5.12 gene model. FlyBase Genes 5.12 annotation was downloaded from the UCSC Genome Browser web site. Genes with the CG IDs identical to the genes in the syntenic blocks [2] were used in subsequent analysis.
The data for replication timing in diploid Kc and Cl8 cells [27] were downloaded from ReplicationDomain site: http://www. replicationdomain.com/. The data for chromosomes X, 2 and 3 were filtered byawkand four columns (chr, start, end, replication score) were extracted. The resulting BED file was uploaded to Galaxy web site and intersected with FlyBase Genes 5.12 loci using Join command from Operate on Genomic Intervals menu with requirement of at least 5 bp overlap. The average replication time (RT) for all probes overlapping every locus was calculated by Group command in Join, Subtract and Group menu. Statistical significance of difference in RT between genes with different IGA scores (Figure 1) and randomized genes was calculated in R package. In order to compensate for the correlation in RT for adjacent genes, we shuffled genes maintaining the syntenic organization,e.g., if the group contains a syntenic block with ten genes, we selected ten consecutive genes (ordered by the genomic position) starting from a randomly chosen gene. The shuffling was done usingsamplefunction withreplace = TRUE. Mean RT of the shuffled genes was calculated for every iteration. For every group we ran 10,000 iterations. The z-score for every group of genes was calculated as (observed RT - mean RT of 10,000 iterations)/ standard deviation of RT in 10,000 iterations. The P-values were calculated as a proportion of the iterations with greater or lesser mean RT than the observed RT.
OLs in BLACK and YELLOW chromatin
Coordinates of BLACK and YELLOW chromatin blocks were obtained from [6]. Gene loci were created from FlyBase genes 5.12 using the leftmost Start and rightmost End positions. Bed
tracks were uploaded to Galaxy and coverage for every type of chromatin in every locus was calculated usingCoveragefunction in Operate on Genomic Intervalssection. IGA values for genes [2] were added using Join two Datasets function in Join, Subtract and Group section. The data were downloaded on a local computer and used to draw the figure in R.
Shuffling
The statistical significance of overlap was estimated by shuffling using bedtools [28]. UR(B)-regions were randomly shuffled in the D. melanogastergenome by shuffleBed (generally 100,000 iterations); the shuffled regions were intersected by intersectBed, and the results were selected using custom awk or bash scripts.
Localization of OLs to polytene chromosome bands To map OLs that fail to overlap UR(B)-regions on polytene chromosomes, we used FISH as well as FISH data available from FlyBase [http://flybase.org]. FlyBase data were only used when FISH data for the genes found within several polytene bands around OL were consistent. To assign underreplication status, we used mapping data for weak spots in polytene chromosomes [7], as well as the underreplication mapping data on a physical map of Drosophilagenome [15,19].
FISH mapping of UCR on polytene chromosomes Flies were raised on standard cornmeal-yeast-agar molasses medium at 22u. Stocks withSuURmutant [17] background where underreplication is suppressed were used, as it allows convenient mapping of FISH signal on polytene chromosomes.
FISH was performed as described in [51]. A set of probes mapping approximately to the middle of every UCR was designed. Genomic DNA was PCR-amplified using the following primers: UCR #98 (59- AGTGATCGCCGTTGACCGCA-39 and 59 -ACGATTGCGGGGAGGCCAAA-39); UCR #598 (59 -AAGTGGCCAATGGGAATACA-39 and 59 -AGGACCG-CAAATAACACAGG-39); UCR #652 (59 -AGCAGTC-GAAATTCGCAAGT-39 and 59
-TGAATGTCGTTTGG-CATTGT-39);. UCR #808 (59
-CCCTCTTTCCGCGAATCGGC-39 and 59 -GGCCGCCAC-TATCTCGTCCA-39); UCR #872 (59 -TTCAGCCGC-TAGGTGTCCCG-39 and 59
-TGTGCGAGGGTGGCAA-GAGA-39); UCR #1025 (59
-TCGCGTTTCACGCTCGGTTG-39 and 59 -CCATGTTG-CATGGCTCGCTCT-39); UCR #1354 (59
-GGGGAT-GAATGGGAAGAGGGGC-39 and 59
-GCTTTCGGCCCCTTGGGTCA-39); UCR #1669 (59 -CAA-TACGTGTGCATCCGTTC-39 and 59 -GTTCAT-TAGCCGGTTGCCTA-39); UCR #1693 (59
-CAA-TACGTGTGCATCCGTTC-39 and 59
-GTTCATTAGCCGGTTGCCTA-39); UCR #1717 (59 -ATCTTCCGATTTCGTCATGC-39 and 59 -CGTGAC-GATTGTGGTGAATC-39); UCR #1744 (59 -AGCTGCA-TAAAGTCCGGCTA-39 and 59 -AGAGAGAGAGACCGCAC-GAC-39); UCR #1893 (59 -CAGTCGGGATGGCTCTGGCT-39 and 59-TGGCGCCCAATGTGAGAGCA-39); UCR #2533 (59-ATGCCCCTGTACGCCTGTCC-39 and 59 -GCCCCTAACGGCTCCCATCT-39); UCR #2598 (59
-TGCTAGCTCATCGGGAGTTT-39 and 59
-ATCCTCGGTCTGTGGTTTTG-39). DNA probes were la-beled with biotin-16-dUTP or digoxigenin-11-dUTP (Roche) in random-primed polymerase reaction using Klenow fragment.
the revised cytological maps of polytene chromosomes of C. B. Bridges (reprinted in [52]).
Gene density analysis
Gene density within D. melanogaster OLs was calculated using UCSC Table Browser. We designed a custom track for OLs in the dm2 genome assembly, where OL borders were defined by the ends of the first and the last gene within a given OL [2]. Altogether, 18 OLs from the following UR(B)-regions were taken into analysis: 7B(OL#212); 19E (551); 25A1-4(671); 32A1-2(817); 33A1-2(831); 50C1-4(1212); 56AB(1370); 59D1-4(1471); 70A(1839); 70C1-2(1847); 75C1-2(1948); 77E1-4(1995); 84D(2124); 87B(2256); 92D1-4(2424); 92E1-2(2427); 94A1-4(2469); 98C1-2(2615). Gene density within OLs and on OL flanks was calculated as a ratio of the number of genes (multiple isoforms were considered as one gene) to the length of an OL. Sizes of OL flanks were chosen as half the size of the corresponding OL. In D. melanogaster and D. grimshawi, partial overlap between the flanks was observed, so the total length of flanks was a little lower than that of OLs. This had no effect on the accuracy of gene density analysis, as every gene in the region was counted just once.
To determine gene density in these same OLs and their flanking regions inD. pseudoobscura,D. virilis,D. mojavensisandD. grimshawi, we defined OL border coordinates as positions of annotated genes in the beginning and the end of this OL using UCSC Genome Browser. Genome assemblies are available for these species at http://genome.ucsc.edu/, but the coordinates of individual genes (annotated as D. melanogaster proteins (BDGP R4/dm2 Proteins) are different from the coordinates used in [2]. So, to make custom tracks of the corresponding OLs and their flanking regions, we determined the coordinates of terminal genes using UCSC Genome Browser. In several cases, OLs fell into groups that belonged to different scaffolds or mapped very far apart (over 1 Mb away from each other). Such OLs were omitted from our analysis for this given species. For these reasons, the analyses performed forD. mojavensisandD. grimshawiincluded fewer than 18 OLs. Gene numbers were determined as the number of D. melanogaster proteins (multiple isoforms were considered as one gene). Gene density was determined similarly toD. melanogaster.
Supporting Information
Table S1 Correlation of replication timing (RT) in Kc cells and the IGA score in OLs.
(XLS)
Table S2 Correlation of replication timing (RT) in Cl8 cell line and the IGA score in OLs.
(XLS)
Table S3 Correlation between IGA score of OLs and chromatin status of genes.
(XLS)
Table S4 Ratio of gene densities in OL flanks and in OLs.
(XLS)
Figure S1 Replication time in Cl8 cells for genes in OLs with different IGA scores. Replication score is shown on x axes, with+6 corresponding to early replication and25 denoting late replication. Gene anchor counts are shown on the y axes. Replication time for every gene was estimated as an average replication time in Cl8 cells [27] for all probes overlapping the gene. Genes were classified according to the IGA counts in the corresponding OLs. Genes with high IGA counts were combined to get similar-sized groups.
(TIF)
Figure S2 Numbers of IGAs within OLs – genome-wide and in UR(B)-regions.Xaxis shows the number of IGAs found in OLs.Yaxis shows the number of the corresponding OLs in the genome (grey) and within UR(B)-regions (black).
(TIF)
Figure S3 Different types of overlap between UR(B)-regions and OLs. Different scales are used for each region. Wide black box denotes an UR(B)-region (name is shown on the left). Colored narrow boxes below correspond to OLs (black: ,50 kb; yellow: 50–100 kb; orange: 100–200 kb, red: 200– 500 kb, blue: .500 kb). The IGA score is shown under each OL overlapping the UR(B)-region. A – pairs of regions, where reciprocal overlap is greater than 80% (the 50C UR(B)-region illustrated here shows 79.8%/93.3% reciprocal overlap with an OL);B – reciprocal overlap ranges 65–76%;C – UR(B)-region overlaps with a large OL, but the extent of overlap is below 65%;
D– UR(B)-region overlaps with several smaller OLs, neither of which appears to be dominant length-wise. Pairs of neighboring UR(B)-regions that are covered by a single common OL are displayed as a single UR(B)-region (further details in the main text). Pairs of UR(B)-regions are denoted as follows: (19E1-2+19E3-4) = 19E; (56A1-2+56B1-2) = 56AB; (64C1-2+ 64C3-4) = 64C; (70A1-2+70A4-5) = 70A; (84D3-4+84D9-10) = 84D; (87B1-2+87B4-5) = 87B; (89A1-2+89A8-9) = 89A.
(TIF)
Figure S4 Mapping of UCRs in Drosophila salivary
gland polytene chromosomes.UCR ID number is shown on
top of each image. Cytology position of FISH signal is indicated in parentheses.
(TIF)
Text S1 Data obtained under OLC and GOO synteny definition[2].
(PDF)
Acknowledgments
The authors are grateful to F.P. Goncharov for help and advice on creating custom tracks, to A.A. Gorchakov for discussion and to P.S. Kolesnikov and T.I. Axenovich for their help and advice on computer data processing.
Author Contributions
Conceived and designed the experiments: NGA TDK IFZ ESB. Performed the experiments: GVP LVB TYZ NGA TDK IVM. Analyzed the data: NGA TDK IVM. Wrote the paper: NGA TDK IVM. Edited the manuscript: IFZ ESB.
References
1. Bhutkar A, Schaeffer SW, Russo SM, Xu M, Smith TF, et al. (2008) Chromosomal rearrangement inferred from comparisons of 12 Drosophila genomes. Genetics 179: 1657–1680.
2. von Grotthuss M, Ashburner M, Ranz JM (2010) Fragile regions and not functional constraints predominate in shaping gene organization in the genus Drosophila. Genome research 20: 1084–1096.
3. de Wit E, van Steensel B (2009) Chromatin domains in higher eukaryotes: insights from genome-wide mapping studies. Chromosoma 118: 25–36. 4. Ranz JM, Diaz-Castillo C, Petersen R (2012) Conserved gene order at the
nuclear periphery in Drosophila. Molecular biology and evolution 29: 13–16. 5. van Bemmel JG, Filion GJ, Rosado A, Talhout W, de Haas M, et al. (2013) A
6. Filion GJ, van Bemmel JG, Braunschweig U, Talhout W, Kind J, et al. (2010) Systematic protein location mapping reveals five principal chromatin types in Drosophila cells. Cell 143: 212–224.
7. Zhimulev IF, Belyaeva ES, Makunin IV, Pirrotta V, Volkova EI, et al. (2003) Influence of the SuUR gene on intercalary heterochromatin in Drosophila melanogasterpolytene chromosomes. Chromosoma 111: 377–398.
8. Hammond MP, Laird CD (1985) Control of DNA replication and spatial distribution of defined DNA sequences in salivary gland cells of Drosophila melanogaster. Chromosoma 91: 279–286.
9. Zhimulev IF, Semeshin VF, Kulichkov VA, Belyaeva ES (1982) Intercalary heterochromatin in Drosophila. I Localization and general characteristics. Chromosoma 87: 197–228.
10. Belyaeva ES, Andreyeva EN, Belyakin SN, Volkova EI, Zhimulev IF (2008) Intercalary heterochromatin in polytene chromosomes ofDrosophila melanogaster. Chromosoma 117: 411–418.
11. Leach TJ, Chotkowski HL, Wotring MG, Dilwith RL, Glaser RL (2000) Replication of heterochromatin and structure of polytene chromosomes. Mol Cell Biol 20: 6308–6316.
12. Belyaeva ES, Demakov SA, Pokholkova GV, Alekseyenko AA, Kolesnikova TD, et al. (2006) DNA underreplication in intercalary heterochromatin regions in polytene chromosomes ofDrosophila melanogastercorrelates with the formation of partial chromosomal aberrations and ectopic pairing. Chromosoma 115: 355– 366.
13. Andreyeva EN, Kolesnikova TD, Belyaeva ES, Glaser RL, Zhimulev IF (2008) Local DNA underreplication correlates with accumulation of phosphorylated H2Av in theDrosophila melanogasterpolytene chromosomes. Chromosome Res 16: 851–862.
14. Kaufmann B (1939) Distribution of induced breaks along the X-chromosome of Drosophila melanogaster. Proc Natl Acad Sci U S A 25: 571–577.
15. Belyakin SN, Christophides GK, Alekseyenko AA, Kriventseva EV, Belyaeva ES, et al. (2005) Genomic analysis of Drosophila chromosome underreplication reveals a link between replication control and transcriptional territories. Proc Natl Acad Sci U S A 102: 8269–8274.
16. Belyakin SN, Babenko VN, Maksimov DA, Shloma VV, Kvon EZ, et al. (2010) Gene density profile reveals the marking of late replicated domains in the Drosophila melanogastergenome. Chromosoma 119: 589–600.
17. Belyaeva ES, Zhimulev IF, Volkova EI, Alekseyenko AA, Moshkin YM, et al. (1998)Su(UR)ES: a gene suppressing DNA underreplication in intercalary and pericentric heterochromatin ofDrosophila melanogaster polytene chromosomes. Proc Natl Acad Sci U S A 95: 7532–7537.
18. Makunin IV, Volkova EI, Belyaeva ES, Nabirochkina EN, Pirrotta V, et al. (2002) The Drosophila suppressor of underreplication protein binds to late-replicating regions of polytene chromosomes. Genetics 160: 1023–1034. 19. Nordman J, Li S, Eng T, Macalpine D, Orr-Weaver TL (2011) Developmental
control of the DNA replication and transcription programs. Genome research 21: 175–181.
20. Sher N, Bell GW, Li S, Nordman J, Eng T, et al. (2012) Developmental control of gene copy number by repression of replication initiation and fork progression. Genome research 22: 64–75.
21. Pindyurin AV, Moorman C, de Wit E, Belyakin SN, Belyaeva ES, et al. (2007) SUUR joins separate subsets of PcG, HP1 and B-type lamin targets in Drosophila. J Cell Sci 120: 2344–2351.
22. Belyaeva ES, Goncharov FP, Demakova OV, Kolesnikova TD, Boldyreva LV, et al. (2012) Late replication domains in polytene and non-polytene cells of Drosophila melanogaster. PloS one 7: e30035.
23. Vatolina TY, Boldyreva LV, Demakova OV, Demakov SA, Kokoza EB, et al. (2011) Identical functional organization of nonpolytene and polytene chromo-somes inDrosophila melanogaster. PloS one 6: e25960.
24. Roy S, Ernst J, Kharchenko PV, Kheradpour P, Negre N, et al. (2010) Identification of functional elements and regulatory circuits by Drosophila modENCODE. Science 330: 1787–1797.
25. Kharchenko PV, Alekseyenko AA, Schwartz YB, Minoda A, Riddle NC, et al. (2011) Comprehensive analysis of the chromatin landscape in Drosophila melanogaster. Nature 471: 480–485.
26. MacAlpine HK, Gordan R, Powell SK, Hartemink AJ, MacAlpine DM (2010) Drosophila ORC localizes to open chromatin and marks sites of cohesin complex loading. Genome Res 20: 201–211.
27. Schwaiger M, Stadler MB, Bell O, Kohler H, Oakeley EJ, et al. (2009) Chromatin state marks cell-type- and gender-specific replication of the Drosophila genome. Genes Dev 23: 589–601.
28. Quinlan AR, Hall IM (2010) BEDTools: a flexible suite of utilities for comparing genomic features. Bioinformatics 26(6): 841–842.
29. Larkin DM, Pape G, Donthu R, Auvil L, Welge M, et al. (2009) Breakpoint regions and homologous synteny blocks in chromosomes have different evolutionary histories. Genome research 19: 770–777.
30. Attie O, Darling AE, Yancopoulos S (2011) The rise and fall of breakpoint reuse depending on genome resolution. BMC bioinformatics 12 Suppl 9: S1. 31. Pevzner P, Tesler G (2003) Human and mouse genomic sequences reveal
extensive breakpoint reuse in mammalian evolution. Proceedings of the National Academy of Sciences of the United States of America 100: 7672–7677. 32. Larkin DM, Everts-van der Wind A, Rebeiz M, Schweitzer PA, Bachman S, et
al. (2003) A cattle-human comparative map built with cattle BAC-ends and human genome sequence. Genome research 13: 1966–1972.
33. Murphy WJ, Larkin DM, Everts-van der Wind A, Bourque G, Tesler G, et al. (2005) Dynamics of mammalian chromosome evolution inferred from multispecies comparative maps. Science 309: 613–617.
34. Everts-van der Wind A, Kata SR, Band MR, Rebeiz M, Larkin DM, et al. (2004) A 1463 gene cattle-human comparative map with anchor points defined by human genome sequence coordinates. Genome research 14: 1424–1437. 35. Everts-van der Wind A, Larkin DM, Green CA, Elliott JS, Olmstead CA, et al.
(2005) A high-resolution whole-genome cattle-human comparative map reveals details of mammalian chromosome evolution. Proceedings of the National Academy of Sciences of the United States of America 102: 18526–18531. 36. Kemkemer C, Kohn M, Cooper DN, Froenicke L, Hogel J, et al. (2009) Gene
synteny comparisons between different vertebrates provide new insights into breakage and fusion events during mammalian karyotype evolution. BMC evolutionary biology 9: 84.
37. Bailey JA, Baertsch R, Kent WJ, Haussler D, Eichler EE (2004) Hotspots of mammalian chromosomal evolution. Genome biology 5: R23.
38. Bulazel KV, Ferreri GC, Eldridge MD, O’Neill RJ (2007) Species-specific shifts in centromere sequence composition are coincident with breakpoint reuse in karyotypically divergent lineages. Genome biology 8: R170.
39. Schibler L, Roig A, Mahe MF, Laurent P, Hayes H, et al. (2006) High-resolution comparative mapping among man, cattle and mouse suggests a role for repeat sequences in mammalian genome evolution. BMC genomics 7: 194. 40. Ruiz-Herrera A, Castresana J, Robinson TJ (2006) Is mammalian chromosomal
evolution driven by regions of genome fragility? Genome biology 7: R115. 41. Clark AG, Eisen MB, Smith DR, Bergman CM, Oliver B, et al. (2007) Evolution
of genes and genomes on the Drosophila phylogeny. Nature 450: 203–218. 42. Grewal SI, Moazed D (2003) Heterochromatin and epigenetic control of gene
expression. Science 301: 798–802.
43. Engstrom PG, Ho Sui SJ, Drivenes O, Becker TS, Lenhard B (2007) Genomic regulatory blocks underlie extensive microsynteny conservation in insects. Genome research 17: 1898–1908.
44. Sahagun V, Ranz JM (2012) Characterization of genomic regulatory domains conserved across the genus Drosophila. Genome biology and evolution 4: 1054– 1060.
45. Diaz-Castillo C, Xia XQ, Ranz JM (2012) Evaluation of the role of functional constraints on the integrity of an ultraconserved region in the genus Drosophila. PLoS genetics 8: e1002475.
46. Stamatoyannopoulos JA, Adzhubei I, Thurman RE, Kryukov GV, Mirkin SM (2009) Human mutation rate associated with DNA replication timing. Nature Genetics 41(4):393–5.
47. Weber CC, Pink CJ, Hurst LD (2012) Late-replicating domains have higher divergence and diversity in Drosophila melanogaster. Molecular biology and evolution 29: 873–882.
48. Cardoso-Moreira MM, Long M (2010) Mutational bias shaping fly copy number variation: implications for genome evolution. Trends in genetics: TIG 26: 243– 247.
49. Cardoso-Moreira M, Emerson JJ, Clark AG, Long M (2011) Drosophila duplication hotspots are associated with late-replicating regions of the genome. PLoS genetics 7: e1002340.
50. Weber CC, Hurst LD (2011) Support for multiple classes of local expression clusters inDrosophila melanogaster, but no evidence for gene order conservation. Genome biology 12: R23.
51. Moshkin YM, Belyakin SN, Rubtsov NB, Kokoza EB, Alekseyenko AA, et al. (2002) Microdissection and sequence analysis of pericentric heterochromatin from theDrosophila melanogastermutantSuppressor of Underreplication. Chromosoma 111: 114–125.