Use of and Self-Perceived Need for Assistive
Devices in Individuals with Disabilities in
Taiwan
Kwok-Tak Yeung1,2, Chung-Hui Lin1,2, Ya-Ling Teng1,2, Fen-Fen Chen1,2, Shu-Zon Lou1,2, Chiung-Ling Chen1,2*
1Department of Occupational Therapy, Chung Shan Medical University, Taichung, Taiwan,2Occupational Therapy Room, Chung Shan Medical University Hospital, Taichung, Taiwan
Abstract
Assistive devices (ADs) can help individuals with disabilities achieve greater independence, and it can enhance the quality of their lives. This study investigated the use of and self-per-ceived need for ADs in individuals with disabilities, and determined the influence of gender, age as well as type and degree of disability on the use of and self-perceived need for ADs. This descriptive study utilized a cross-sectional survey design with a convenience sample of participants. A total of 1018 subjects with disabilities who visited an exhibition of assistive technology and two ADs research and development centers completed a questionnaires either by themselves or via a caregiver who completed the questionnaire on behalf of the subject or via interviewers trained specifically for this study. The Mann-Whitney U test and Kruskal-Wallis test were used to determine the influence of participant characteristics on the use of ADs. The results showed that 77.2% and 83.3% of the participants reported that they used and needed AD(s) to engage in activities of daily living. The mean quantity of the use of and self-perceived need for total types of ADs were 3.0 and 5.3, respectively. Partici-pants with different disabilities reported different percentages of the use of various types of ADs. No difference was found between genders and among the age groups in the use of quantity of ADs. Individuals with different types and degrees of disability used different quantities of ADs. Participants with physical, visual and multiple disabilities used signifi-cantly more ADs compared to participants with intellectual disability. The total quantity of ADs used increased significantly with increased severity of disability. The mean use of assistive devices was lower compared to the mean need of individuals with disabilities. Fur-ther study is required to determine why patients feel the need for but not currently use a spe-cific assistive device.
a11111
OPEN ACCESS
Citation:Yeung K-T, Lin C-H, Teng Y-L, Chen F-F, Lou S-Z, Chen C-L (2016) Use of and Self-Perceived Need for Assistive Devices in Individuals with Disabilities in Taiwan. PLoS ONE 11(3): e0152707. doi:10.1371/journal.pone.0152707
Editor:Stefano Federici, University of Perugia, ITALY
Received:July 31, 2015
Accepted:March 17, 2016
Published:March 29, 2016
Copyright:© 2016 Yeung et al. This is an open access article distributed under the terms of the
Creative Commons Attribution License, which permits unrestricted use, distribution, and reproduction in any medium, provided the original author and source are credited.
Data Availability Statement:All relevant data are within the paper.
Funding:The authors have no support or funding to report.
Introduction
The International Classification of Functioning, Disability and Health (ICF) describes human functioning in terms of body structures, body functions, activities, and participation. It states that disability is a condition that is influenced by the interaction between persons with health conditions and their environment [1]. Assistive devices (ADs) can help individuals with dis-abilities compensate for lost functions, increase their independence, develop their potential, and thus enhance their quality of life. Assistive technology (AT) has been commonly used in developed countries to help individuals with disabilities overcome obstacles when seeking med-ical treatment, pursuing education, obtaining employment or caring for families, and obtaining equal opportunities to participate in society. The Assistive Technology Act (Public Law 108–
364), otherwise known as the Tech Act, was first passed by American Congress in 1988 as the Technology-Related Assistance for Individuals with Disabilities Act (Public Law 100–407) and has been reauthorized in 1994, 1998, and 2004. The Tech Act required States to provide indi-viduals with disabilities with the needed AT and services [2]. Beginning in 1975, the Individuals with Disabilities Education Act (Public Law 108–446) was passed that defined both AT devices and services for children with disabilities for inclusion in the individualized family service plan and individualized education program [3]. The Standard Rules on the Equalization of Oppor-tunities for Persons with Disabilities adopted by the United Nations in 1993 stated that the gov-ernment should ensure the development and provision of supportive services, including ADs for persons with disabilities, in order to increase their daily independence and safeguard their rights [4].
The ICF and the laws made it clear that assistive technology included more than devices, but also user-driven and user-focused services. A number of assessment tools and models have been developed to guide AT service delivery such as the Student Environment Task Tool framework [5], the Matching Person and Technology model [6], the Human Activity Assistive Technology model [7], and the Assistive Technology Assessment model [8]. Each of these models acknowledges the impact of the environmental and personal factors in intervention, placing emphasis on a user-driven process and person-centered approach for AT service delivery.
In Taiwan, 1,141,677 people, or 4.87% of the total population, received the Disability Identi-fication by the end of 2014 [9]. The statistical analysis of recent 10 years revealed an annual increase of the disabled population of approximately 2.32%, indicating that a growing number of disabled individuals need assistance to overcome obstacles, so welfare services for the dis-abled have become one of the major topics of government policy. In recent years, the govern-ment of Taiwan has paid much attention to the developgovern-ment and popularization of AT, and the rights of the disabled to the use of AT have been safeguarded through new legislation. The Physically and Mentally Disabled Citizens Protection Act of 1997, which has been amended and promulgated to the People with Disabilities Rights Protection Act in 2007, stipulates regu-lations concerning research and development of ADs related to health and medical care, educa-tion, employment, daily living and social participation [10]. As a result, various organizations have already provided assistance and financial support for the establishment of a number of ADs research and development centers.
user’s needs during AT evaluation is a primary reason for abandonment [13,16–18]. To improve AT services and users’functions and participation, it is essential to gain an under-standing of user subjective needs and preferences. The gaps between current conditions or use conditions and desired conditions or self-perceived need conditions must be determined to appropriately identify the need.
However, studies on ADs use and need in Taiwan are scarce. In the report on physically and mentally disabled citizens living demand survey, Republic of China, 2000 [19], indicated that approximately 40% of all physically and mentally disabled citizens used various kinds of Ads. The follow-up surveys reported the similar conditions, 37.85% in 2003 [20], 35.76% in 2006 [21], and 38.77% in 2011 [22]. In a national survey of the usage of assistive devices, samples were limited to subjects who were more than 50 years of age with long-term disability [23]. Hu conducted a survey on the current usage conditions of locomotive assistive devices for long-term care clients [24]. All these surveys reported the usage conditions but not the needed con-ditions of ADs. Zeng and Li investigated the demand for daily living ADs in elderly, but inter-viewed only ten physically and mentally disabled senior citizens, making it impossible to obtain a complete picture of the demand for ADs [25]. Only one study was conducted to inves-tigate the need of individualized assisted device in people with disabilities. However, the ques-tionnaires were sent by post, only 539 out of 2850 quesques-tionnaires were returned, the return rate was rather low (18.9%) [26].
The objective of this study was to investigate the use of and self-perceived need for various categories of ADs by individuals with disabilities and to study whether gender, age, as well as type and degree of disability have any influence on the total quantity of ADs used. The aims are to bridge the gap between what people use and what people want to participate in daily living activities, and to provide research and development centers with a basis for program develop-ment and relevant governdevelop-ment authorities with a policy reference.
Methods
Ethics statement
This study has been reviewed by the Chung Shan Medical University Hospital Institutional Review Board. The Board has determined that this study is exempt from review and approval is not required because it is an anonymous survey. A signed informed consent form was obtained from all participants after clearly introducing the survey.
Participants
In this study, we used convenience sampling and interviewed individuals with disabilities who visited an exhibition of AT. Because the AT exhibition was held in northern area of Taiwan, most visitors with disability came from northern or central area of Taiwan. To consider sam-ples that might vary by region, additional subjects were recruited from two ADs research and development centers, one in the southern and the other in the eastern area of Taiwan.
Data collection
towards the questionnaire wording and adding some items of ADs in each category for partici-pants to check. Three items were added, and five questions were rewritten or had words changes for clarity and understanding. Inter-rater reliability was not formally tested. For it is a closed-ended questionnaire that collects quantitative data, by using low inference descriptors that readily quantified, it is safe to say that the internal reliability of the questionnaire can be ensured.
Section 1 (participants’basic information) included gender, age, living area, educational background, type of disability, and degree of disability. Section 2 (basic daily living abilities) collected the information about the participants’level of function in basic activities of daily liv-ing (ADLs). The basic ADLs included eatliv-ing, dressliv-ing, groomliv-ing, bathliv-ing, toiletliv-ing, transfer-ring, walking, and communication. Four levels of response categories were (a) able to perform the activity without using ADs, (b) able to perform the activity with occasionally use of ADs, (c) able to perform the activity with frequently use of ADs, and (d) unable to perform the activ-ity requiring help from others. Section 3 (ADs use and need) collected the participants’use of and self-perceived need for various categories of ADs. ADs were classified into ten categories according to function: eating, dressing, grooming/bathing, toileting, transferring, walking, communication, rehabilitation, computer usage, and reading/learning, and in each category, the participants were asked to check which AD they currently used and which AD they may needed. Participants could select“none”and indicate a number of AD items that they used and needed. To assure consistency between sections 2 and 3, we checked whether the respondents had not forgotten to complete section 3 (ADs use and need). For example, if under the activity
“dressing”a respondent had checked“able to perform the activity with frequently use of ADs”, we checked whether the category“dressing ADs”was also checked under ADs use and need in section 3.
The questionnaires were completed either by self-report, by a caregiver on behalf of the par-ticipants, or by interviewers trained specifically for this study. The choice of administration for-mat depended on the characteristics of the participants (if they were able to read and write), and it was determined by the interviewers. The interviewers conducted interviews or facilitated the administration process, answered any question, and checked for missing data when the questionnaires were self-administrated or completed by a caregiver on behalf of the participant.
Data analysis
Descriptive statistics, including frequency distribution and percentages, were used to describe the participants’basic information, abilities in basic ADLs, and the use of and need for ADs. In section 3, one AD item checked in each category being considered as one device, the number of items (devices) checked in each category were added up to represent the total number of ADs used and needed by participants. The mean and standard deviation of total quantity of ADs the participants used and needed were calculated. Since the data were not normally distributed, the Mann-Whitney U-test and Kruskal-Wallis one-way analysis of variance were used to deter-mine any differences in the total quantity of ADs used by different participant characteristics (gender, age, type of disability, degree of disability). To minimize type I error due to multiple testing, the significance level was set atα= 0.01.
Results
Ninety-nine questionnaires were collected from a center in the southern area and 74 questionnaires were collected from a center in the eastern area.
Basic information
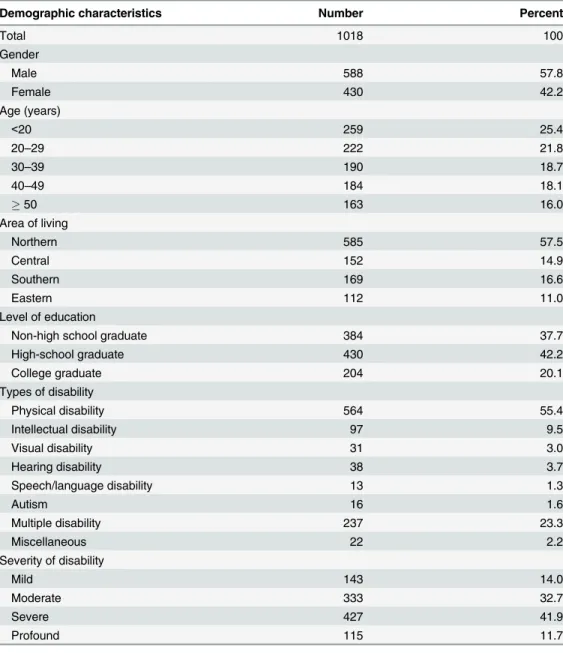
Participants comprised 588 males (57.8%) and 430 females (42.2%). Basic participants’ charac-teristics are outlined inTable 1. Regarding age distribution, most participants (259or 25.4%) were younger than 20 years of age, while the proportion of participants older than 20 years of age decreased as a function of age. The largest number of participants, namely 564 or 55.4%, had a physical disability, and the highest proportion of participants (427 or 41.9%) had a severe disability (Table 1). In comparison with the target population, significant differences were found between types of disability (X2= 126.5, p<0.0001) and severity of disability (X2= 465.1,
p<0.0001). There was no significant difference between gender (X2= 0.16, p = 0.69).
Table 1. Basic demographic characteristics of the participants.
Demographic characteristics Number Percent
Total 1018 100
Gender
Male 588 57.8
Female 430 42.2
Age (years)
<20 259 25.4
20–29 222 21.8
30–39 190 18.7
40–49 184 18.1
50 163 16.0
Area of living
Northern 585 57.5
Central 152 14.9
Southern 169 16.6
Eastern 112 11.0
Level of education
Non-high school graduate 384 37.7
High-school graduate 430 42.2
College graduate 204 20.1
Types of disability
Physical disability 564 55.4
Intellectual disability 97 9.5
Visual disability 31 3.0
Hearing disability 38 3.7
Speech/language disability 13 1.3
Autism 16 1.6
Multiple disability 237 23.3
Miscellaneous 22 2.2
Severity of disability
Mild 143 14.0
Moderate 333 32.7
Severe 427 41.9
Profound 115 11.7
Abilities in basic activities of daily living
As shown inTable 2, a higher percentage of participants were able to perform feeding (71.7%), communication (69.7%) and upper extremities dressing (68.9%) activities without ADs. Walk-ing and bathWalk-ing were the activities that a relatively high percentage of participants were able to perform with the occasional or frequent use of ADs while bathing, toileting and lower extremi-ties dressing were the activiextremi-ties that a higher percentage of participants were unable to perform and for which help from others was required.
Assistive devices use and self-perceived need
Table 3shows the percentage of participants who use of and need of ADs across the ten catego-ries of ADs. It also lists three AD items used and needed by the highest percentage of partici-pant across each category of ADs. The mean percentage of use and need for all categories of ADs were 22.2% and 32.9%, respectively. Most participants reported the greatest use of and need for ADs for walking (54.5% and 56.8% respectively) and rehabilitation (39.8% and 49.8% respectively).
Influence of the characteristics on the use of and need for ADs
For each type of disability, the percentage of participants that used a particular category of AD is shown inTable 4. Participants with physical disability and multiple disabilities used mostly rehabilitation ADs (52.5% and 46.5%, respectively) and walking ADs (75.6% and 44.9%, respectively). Participants with intellectual disability were least likely to use ADs; however, in this group the use of communication aids (14.3%) and reading/learning aids (19.4%) was higher compared to the use of other categories of ADs. Participants with visual disability used mostly reading/learning ADs (71.0%), followed by walking ADs (58.1%). Participants with a hearing disability used primarily communication ADs (71.1%), followed by reading/learning ADs (55.3%). Autistic participants used mostly reading/learning ADs (43.8%) and communi-cation ADs (37.5%). Only 13 participants had a language disability, and used relatively few ADs.
Table 2. Number and percentage of participants in four levels of function in various types of basic ADLs.
ADLs Able to
perform Without ADs
Able to perform Occasionally
use ADs
Able to perform Frequently
use ADs
Unable to perform
N % N % N % N %
Feeding 730 71.7 118 11.6 50 4.9 120 11.8
UE dressing 701 68.9 58 5.7 40 3.9 219 21.5
LE dressing 663 65.1 85 8.3 43 4.2 227 22.3
Grooming 685 67.3 93 9.1 103 10.1 137 13.5
Bathing 500 49.1 140 13.8 118 11.6 260 25.5
Toileting 563 55.3 109 10.7 114 11.2 232 22.8
Transferring 650 63.9 68 6.7 81 8.0 219 21.5
Walking 358 35.2 189 18.6 365 35.9 106 10.4
Communication 710 69.7 84 8.3 58 5.7 166 16.3
ADLs: activities of daily living, N: number, ADs: assistive devices, UE: upper extremities, LE: lower extremities
Overall, 232 (22.8%) and 170 (16.7%) did not use or need any ADs. The percentages of the participants who used and needed at least one AD for their daily living were 77.2% and 83.3%, respectively. The mean use of the total number of AD items was 3.0 (±3.0) while the mean self-perceived need for the total number of AD items was 5.3 (±5.7). The differences between males
Table 3. The percentage of participants who used and needed ADs as well as three AD items with the highest percentage of participants who used and needed in each type of ADs.
Category of ADs Used(%) Category of ADs Needed(%)
AD Items AD Items
Feeding 16.2 Feeding 22.8
Lap board 5.2 Special utensils 8.6
Special utensils 4.4 Lap board 7.1
ADs for grasp 1.7 Special plate/bowl 7.0
Dressing 12.9 Dressing 23.0
ADs for shoes wearing 4.2 ADs for shoes wearing 9.2
ADs for LE dressing 1.7 ADs for LE dressing 7.9
Special clothes 1.7 ADs for UE dressing 6.4
Grooming/Bathing 25.4 Grooming/Bathing 42.0
Bath bench 12.0 Bath bench 21.5
Anti-slip mats 7.6 Anti-slip mats 17.7
Lever handle faucet 5.6 Shower chair 8.6
Toileting 22.0 Toileting 28.9
Commode chair 8.0 Commode chair 12.8
Bed pans and urinals 5.5 Raised toilet seat 7.0
Urine condoms 3.3 Bed pans and urinals 6.3
Transferring 14.7 Transferring 28.6
Bed rails 6.4 Bed rails 11.6
Lift system 2.1 Lift system 7.2
Ceiling hoist 1.8 Floor hoist 6.1
Walking 54.5 Walking 56.8
Wheelchair 26.6 Wheelchair 26.6
Walking aids 21.4 Walking aids 19.2
LE orthoses 12.6 Powered wheelchair 15.8
Communication 13.7 Communication 27.5
Communication board 5.3 Communication board 15.2
Hearing aid 3.7 ADs for telephone 6.1
ADs for telephone 2.4 Hearing aid 5.0
Rehabilitation 39.8 Rehabilitation 49.8
LE orthoses 11.6 Cushion 15.9
Cushion 11.4 Standing frame 13.0
Special shoes 9.3 LE orthoses 12.3
Computer usage 8.6 Computer usage 20.2
Special mouse 3.8 Special mouse 9.4
Typing stick 1.5 Typing stick 4.3
Special key board 1.4 Special key board 8.9
Reading/Learning 13.9 Reading/Learning 30.1
Magnification device 5.0 Communication board 12.1
Communication board 4.7 ADs for writing 9.0
Hearing aid 3.0 Magnification device 7.6
and females or by age groups in the use of total quantity of ADs were non-significant
(U = 117184.5, p>0.01). A significant difference was found in the use of total quantity of ADs
by type of disability (X2= 122.1, p<0.001) and degree of disability (X2= 110.9, p<0.001).
Post-hoc tests revealed that participants with physical, visual, or multiple disabilities used signifi-cantly more ADs compared to participants with intellectual disability (U = 1072.0, U = 603.5, U = 5108.5, respectively, all p<0.01). The total quantity of ADs used increased significantly as
a function of severity (mild-moderate U = 16989.5, mild-severe U = 14976.5, mild-profound U = 4533.5, moderate-severe U = 50307.5, moderate-profound U = 15260.5, all p<0.01) while
the severe and profound groups did not differ significantly from one another.
Discussion
Comparing sample demographic data with the target population, there were significant ences between types of disability and severity of disability but there was no significant differ-ence between gender. This points to a fault in the convenidiffer-ence sampling and that will be discussed later. Comparison of age, area of living, and level of education were not performed because the category that this study used was different from the disabled population database [9].
In the report on physically and mentally disabled citizens living and demand assessment survey, Republic of China, 2011, indicated that approximately 40% of all physically and men-tally disabled citizens needed and used various kinds of ADs [22]. Compared to the survey results in 2000 [19], 2003 [20], and 2006 [21], the ratio of the needs for ADs in individuals with disabilities was almost the same. The percentages for the use and need (77.2% and 83.3% respectively) were higher in our study because the participants recruited from an exhibition of AT and ADs research and development centers should have already used some kind of ADs or have greater need for ADs.
When comparing sample characteristics of this study to the statistical data of the Republic of China report, 2011 [22], the study conducted by Leong et al. [26], and the Tainan [27] report on living demand in physically and mentally disabled citizens, in which the ratio of male to female subjects was approximately 6 to 4 (57.24%:42.76% 60.8%:39.2%, and 61.1%:38.5%, respectively), we see that the male-female ratio in this study was similar, specifically, 57.8% to 42.2%. Concerning age, most participants in Leong’s study were 20–40 years old and in the
Table 4. Number of participants in each type of disability and percentage of which used various categories of assistive devices.
Assistive Devices Types of Disability
Number
Physical Intellectual Visual Hearing Speech Language Autism Multiple Miscellaneous
564 97 31 38 13 16 237 22
Feeding 14.7 8.2 25.8 2.6 0 25 25.5 0
Dressing 13.6 5.1 6.2 2.6 0 12.5 16.5 9.5
Grooming/Bathing 30.0 13.3 19.4 7.9 7.7 31.3 24.7 9.5
Toileting 24.6 3.1 9.7 5.3 7.7 18.8 29.6 14.3
Transferring 17.3 5.1 19.4 5.3 7.7 12.5 14.0 14.3
Walking 75.6 5.1 58.1 7.9 15.4 12.5 44.9 23.8
Communication 5.5 14.3 25.8 71.1 15.4 37.5 22.6 19.0
Rehabilitation 52.5 7.1 16.1 7.9 15.4 12.5 46.5 23.8
Computer usage 8.0 4.1 22.6 5.3 7.7 31.3 10.3 9.5
Reading/Learning 8.5 19.4 71.0 55.3 15.4 43.8 21.4 4.8
Tainan report were 25–44 years old, which is similar to the current study in which most sub-jects were 20–49 years old. The highest percentage of subjects in the Republic of China report, however, were>65 years old (34.3%) while this study had only a small number of participants
older than 50. This may be explained by the fact that the participants in this study were from an AT exhibition and two ADs research and development centers. Older individuals may not be so active to seek help from external resources. In Leong’s study, the highest proportion of participants had a physical disability (76%), followed by multiple disabilities (9%), hearing dis-abilities (9%), and intellectual disdis-abilities (6%). According to physically and mentally disabled population data of the Ministry of Health and Welfare [9], the largest number of people had a physical disability (33.72%) while multiple disabilities and intellectual disability accounted for 10.38% and 8.84%, respectively. The Republic of China report also showed the highest percent-age of people with a physical disability (35.58%), followed by hearing, multiple, and intellectual disabilities. In our study, the highest percentage of subjects had a physical disability (55.4%), followed by multiple, intellectual, and hearing disabilities, but the percentage of multiple dis-abilities (23.3%) was higher compared to that in the Republic of China report.
Individuals with disabilities in this study had the greatest need for walking, rehabilitation, and grooming/bathing aids, which is consistent with the findings of a study conducted with elderly as subjects. In their study on community elderly, Edwards and Jones [28] indicated that people older than 75 years of age showed increased use of walking aids and wheelchairs and most commonly used walking and grooming/bathing aids, such as a bath mat, walking stick, and bathroom handrails. Study by Sonn et al. also showed that urban elderly commonly use hygiene and mobility devices, with 24% of subjects under 80 and 57% of subjects above 80 years of age using such ADs [29]. George and colleagues studied ADs use among home-based elderly over 75 years of age, and found that many elderly with function loss needed ADs for bathing and toileting [30]. In Taiwan, in a nation-wide usage survey of assistive device in long-term disabled subjects who were more than 50 years of age, locomotive devices were found to be the most used type of Ads (82%) [23]. A study conducted with stroke patients in Taiwan also indicated that more than 90% of stroke patients used ADs. The most commonly used types of ADs were walking aids (76.9%) and bathing aids (10.6%) [31]. The findings of this study were also consistent with the findings of Leong et al. [26].
There was no difference between the genders in the use of total quantity of ADs in this study. Study by Edwards and Jones; however, indicated that the use of certain ADs in older people differs by gender. They found that female subjects used more walking and bathing aids compared to male subjects [28]. A survey conducted in the USA with adult US resident using wheeled mobility equipment in 2005 found that wheeled mobility equipment users are more likely to be older, female, and in poor health compared to the general population [42]. Study on factors that influence the use of ADs in disabled community elderly showed a correlation between the use of ADs and social isolation of women, low education, and residence in rural areas [43]. The participants in our study were generally younger compared to those in the above-mentioned studies; hence the gender effects cannot be determined.
The degrees of disability influenced the total quantity of ADs utilized. This result was simi-lar to the findings obtained by Verbrugge et al. [44], who found that severe disability and poor overall health/disability status increased the use of ADs. Thyberg et al. [45] also suggested that severe disease and greater disability are associated with greater use of ADs. However, the results in our study did not show any differences between severe and profound degree of disability. We supposed that in addition to use of ADs, the participants with profound degree of disability receive much more help from others. A prior study has also shown that high numbers of ADLs, instrumental ADLs, and physical limitations are strongly related to increased use of per-sonal and equipment compared with equipment only [44]. This finding is not surprising, given the evidence from this study, the aforementioned studies, and one similar to it [26]. It indicated that AT professionals should endeavor to expand their knowledge and expertise to provide ser-vices in proportion to the severity of disability. Further study with special emphasis on persons with more severe disabilities is required to include a better assessment of the severity of the dis-ability and a better classification of ADs to obtain a better understanding of how much persons with disabilities and their families are able to invest in AT on their own and what share of the cost the public should bear.
A relatively high percentage of participants were unable to perform basic ADLs such as dressing, bathing, toileting, and transferring, and required help from others. The previous sur-veys in the literature have consistently demonstrated a trend toward an increased AD use and decreased use of personal assistance by older people with varying levels of functional disability and impairment [43,46,47]. Future study should investigate whether increased use of ADs can reduce the need for personal care in individuals with profound disability.
The use of ADs quantity was lower compared to the self-perceived need for ADs quantity. These findings confirmed that there is a gap between objectively- or professionally-assessed and subjectively- or self-perceived need. Therefore, for beneficial outcomes to be experienced, users have to be party to decisions about the provision of AT. These findings also give support to the relevance of user-driven process and person-centered approach for a successful AT assessment and delivery. Further study is required to determine whether the gap is the result of the lack of understanding of ADs, the difficulty of obtaining ADs, the lack of suitable ADs, the lack of service delivery, high prices, the lack of subsidy funding, or the lack of centralized infor-mation and evaluation systems, among others [48].
promptly answering any questions that participants had, the response accuracy increased. The results of this study are therefore of considerable referential value. Another limitation was that this study did not explore why participants feel they need but do not currently use a specific AD.
Future research could be improved by using a stratified sampling where the sample should be further divided into groups according to gender, age and type of disability as is done in the database of physically and mentally disabled citizens of the Ministry of Health and Welfare [9]. Further study is required to find out why patients feel they need but do not currently use a spe-cific AD. Future study may also probe into patients’use of AD, including the frequency of and satisfaction with the use of these devices, as well as into the influence of different cultural back-grounds on AD use and need.
Conclusions
The questionnaire data were collected using a large sample and face-to-face interviewing; thus the results of this study are therefore of considerable referential value. The highest percentage of subjects had a physical disability and the highest usage percentage was found for walking, rehabilitation and grooming/bathing while computer access, dressing, and communication aids showed the lowest usage percentage. No difference was found between the genders and among the age groups in the use of quantity of ADs while type and degree of disability influ-enced the number of ADs used. These findings support that conducting additional research to improve knowledge of assisted device usages for this subject population should be given high priority. Subjects with a different type of disability needed different types of ADs. The mean quantity of the use of and the mean self-perceived need for total types of ADs were 3.0 and 5.3, respectively. This study confirms that there is a gap between use conditions and self-perceived need conditions. It gives support to the thesis that effective AT service delivery should place emphasis on a user-driven process and person-centered approach. It is hoped that the current study may provide valuable information for clinicians to better understand the needs of the users of AT, for organizations to have a basis for program development, and for policymakers to consider in future policy making.
Acknowledgments
The authors acknowledge the valuable contributions of all of the study participants.
Author Contributions
Conceived and designed the experiments: KTY CLC. Performed the experiments: KTY CLC CHL YLT SZL FFC. Analyzed the data: KTY CLC CHL YLT SZL. Contributed reagents/mate-rials/analysis tools: KTY CLC. Wrote the paper: KTY CLC.
References
1. World Health Organization. International Classification of Functioning, Disability and Health (ICF). Geneva, Switzerland: Author, 2001.
2. Assistive Technology Act of 2004, Pub. L. No. 108–364, 118 Stat. 1707 (Oct. 25, 2004).
3. Individuals with Disabilities Education Improvement Act of 2004, Pub. L. No. 108–446, 118 Stat. 2647 (Dec. 3, 2004).
4. Standard Rules on the Equalization of Opportunities for Persons with Disabilities, United Nations Gen-eral Assembly, 48 session, resolution 48/96, annex, of 20 Dec 1993.
and Media Division of Council for Exceptional Children. Orlando, FL, March 2–4, 1995. Available:http:// files.eric.ed.gov/fulltext/ED381962.pdf.
6. Scherer MJ. The Matching Person & Technology (MPT) model manual, 3rd ed. Webster, NY: The Institute forMatching Person & Technology, Inc.; 1998.
7. Cook AM, Polgar JM. Cook and Hussey’s assistive technologies: Principles and practice. 3rd ed. St. Louis: Elsevier; 2008.
8. Federici S, Scherer MJ, editors. Assistive technology assessment handbook. Boca Raton, FL: CRC Press; 2012.
9. Ministry of Health and Welfare (2014). The Disabled Population. Taiwan, Republic of China. Available: http://www.mohw.gov.tw/cht/DOS/Statistic.aspx?f_list_no=312&fod_list_no=4182. Accessed 28 December 2015.
10. People with Disabilities Rights Protection Act (amended June 11 2013). Taiwan, Republic of China. Available:http://law.moj.gov.tw/Eng/LawClass/LawAll.aspx?PCode=D0050046. Accessed 28 Decem-ber 2015.
11. Lahm EA, Sizemore L. Factors that influence assistive technology decision making. J Spec Educ Tech-nol. 2002; 17(1): 15–26.
12. Louise-Bender PT, Kim J, Weiner B. The shaping of individual meanings assigned to assistive technol-ogy: A review of personal factors. Disabil Rehabil. 2002; 24(1–3): 5–20. PMID:11827155
13. Scherer MJ, Sax C, Vanbiervliet A, Cushman LA, Scherer JV. Predictors of assistive technology use: The importance of personal and psychosocial factors. Disabil Rehabil. 2005; 27(21): 1321–1331. PMID:16298935
14. Federici S, Corradi F, Meloni F, Borsci S, Mele ML, Dandini de Sylva S, et al. A person-centered assis-tive technology service delivery model: A framework for device selection and assignment. Life Span Disab. 2014; 17(2): 175–98.
15. Federici S, Corradi F, Meloni F, Borsci S, Mele ML, Dandini de Sylva S, et al. Successful assistive tech-nology service delivery outcomes from applying a person-centered systematic assessment process: A case study. Life Span Disab. 2015; 18(1): 41–74.
16. Phillips B, Zhao H. Predictors of assistive technology abandonment. Assist Technol. 1993; 5(1): 36–
45. PMID:10171664
17. Dijcks BPJ, De Witte LP, Gelderblom GJ, Wessels RD, Soede M.). Non-use of assistive technology in The Netherlands: A non-issue? Disabil Rehabil Assist Technol. 2006; 1(1–2): 97–102. PMID: 19256172
18. Federici S, Borsci S. Providing assistive technology in Italy: The perceived delivery process quality as affecting abandonment. Disabil Rehabil Assist Technol. 2016; 11(1): 22–31. doi:10.3109/17483107. 2014.930191PMID:24936571
19. Department of Statistics (Ministry of the Interior), Department of Health (Executive Yuan), Council of Labor Affairs (Executive Yuan). Report on physically and mentally disabled citizens living demand sur-vey, Taiwan, Republic of China. 2000. Taipei: Department of Statistics (Ministry of the Interior), 2000.
20. Ministry of the Interior, Council of Labor Affairs (Executive Yuan). Report on physically and mentally dis-abled citizens living and demand assessment survey, Taiwan, Republic of China, 2003.
21. Ministry of the Interior, Council of Labor Affairs (Executive Yuan). Report on physically and mentally dis-abled citizens living and demand assessment survey, Taiwan, Republic of China, 2006.
22. Ministry of the Interior, Council of Labor Affairs (Executive Yuan). Report on physically and mentally dis-abled citizens living and demand assessment survey, Taiwan, Republic of China, 2011.
23. Department of Health (Executive Yuan). National survey of the usage of assistive devices: Prevalence, appropriateness, and establishment of check-out standards, Taiwan, Republic of China, 2004.
24. Hu MH. Usage survey of locomotive assistive devices for long-term care clients. Formos J Phys Ther. 2004; 29(6):405–420.
25. Zeng SY, Li CF. A study of supply and demand of daily living assistive devices in elderly. A study report commissioned by the Department of Social Affairs (Ministry of the Interior), Taiwan, Republic of China, 1999.
26. Leong CP, Chou SW, Lin TH, Pan JL, Pei YC, Chu NK, et al. Market analysis for the need of individual-ized assisted device in patients with physical-mental disabilities. Taiwan J Phys Med Rehabil 2004; 32 (1): 1–10.
27. National Cheng Kung University Research and Development Foundation. Tainan report on living demand in physically and mentally disabled citizens, Taiwan, Republic of China, 1999.
29. Sonn U, Davegardh H, Lindskog AC, Steen B. The use and effectiveness of assistive devices in an elderly urban population. Aging. 1996; 8: 176–183. PMID:8862192
30. George J, Binns VE, Clayden AD, Mulley GP. Aids and adaptations for the elderly at home: Underpro-vided, underused, and undermaintained. Brit Med J Clin Res Ed. 1988; 296: 1365–1366.
31. Yeh SJ, Chang BW, Lee YH, Hung HL, Liu MY. Demand and satisfaction analysis of assistive technol-ogy for stroke patients. Cheng Ching Med J. 2012; 8: 8–16.
32. Parish SL. Federal income payments and mental retardation: the political and economic context. Ment Retard. 2003; 41: 446–459. PMID:14588057
33. Wehmeyer ML. National survey of the use of assistive technology by adults with mental retardation. Ment Retard. 1998; 36: 44–51. PMID:9492517
34. Mann WC, Hurren D, Tomita M. Assistive devices used by home-based elderly persons with arthritis. Am J Occup Ther. 1995; 49: 810–820. PMID:8526227
35. Holme SA, Kanny EM, Guthrie MR, Johnson KL. The use of environmental control units by occupa-tional therapists in spinal cord injury and disease services. Am J Occup Ther. 1997; 51: 42–48. PMID: 8978862
36. Haworth RJ, Hopkins J. Use of aids following hip replacement. Br J Occup Ther. 1980; 41: 336–339.
37. Mann WC, Hurren D, Tomita M. Comparison of assistive device use and needs of home-based older persons with different impairments. Am J Occup Ther. 1993; 47: 980–987. PMID:8279504
38. Chamberlain MA. Aids and appliances in the home: A critical survey of bath aids and their use. Int Rehabil Med. 1979; 1: 204–207. PMID:162481
39. Pinheiro CG, Naves Jr, Pino EL, Losson P, Andrade AO E, et al. Alternative communication systems for people with severe motor disabilities: A survey. Biomed Eng Online. 2011; 10: 31. doi:10.1186/ 1475-925X-10-31PMID:21507236
40. Ryan SE, Sawatzky B, Campbell KA, Rigby PJ, Montpetit K, Roxborough L, et al. Functional outcomes associated with adaptive seating interventions in children and youth with wheeled mobility needs. Arch Phys Med Rehabil. 2014; 95: 825–831. doi:10.1016/j.apmr.2013.09.001PMID:24035768
41. Wu TF, Chen MC, Chen YL. A survey of computer access devices for students with physical disabilities. Spec Educ Q. 2012; 122: 13–21.
42. LaPlante MP, Kaye HS. Demographics and trends in wheeled mobility equipment use and accessibility in the community. Assist Technol. 2010; 22: 3–17. doi:10.1080/10400430903501413PMID:
20402043
43. Forbes WF, Hayward LM, Agwani N. Factors associated with self-reported use and non-use of assistive devices among impaired elderly residing in the community. Can J public Health. 1993; 84: 53–57. PMID:8500059
44. Verbrugge LM, Sevak P. Use, type, and efficacy of assistance for disability. J Gerontol B Psychol Sci Soc Sci. 2002; 57: S366–79. PMID:12426445
45. Thyberg I, Hass UA, Nordenskiold U, Skogh T. Survey of the use and effect of assistive devices in patients with early rheumatoid arthritis: a two-year followup of women and men. Arthritis Rheum, 2004; 51: 413–421. PMID:15188327
46. Macken CL, A profile of functionally impaired elderly persons living in the community. Health Care Financ Rev. 1986; 7: 33–49. PMID:10311671
47. Manton KG, Corder L, Stallard E. Changes in the use of personal assistance and special equipment from 1982 to 1989: results from the 1982 and 1989 NLTCS. Gerontologist. 1993; 33: 168–176. PMID: 8468009