Canadian Studies in Population, Vol. 34.2, 2007, pp. 103-127
CSP 2007, 34.2: 103-127 103
Projected Population Size and Age Structure for Canada and
Provinces: With and Without International Migration
Shirley Loh
Demography Division Statistics Canada Ottawa, Ontario, Canada
M.V. George
Adjunct Professor
Departments of Global Health and Sociology Emory University
Atlanta, Georgia, USA
Department of Sociology University of Alberta Edmonton, Alberta, Canada
Adjunct Research Associate Center for Population Studies University of Mississippi University, Mississippi, USA
Abstract
This paper examines the effect of net international migration on prospective population growth and age structure in Canada for the next 50 years. It also examines the impact of international migration on provincial growth and distribution. The procedure used in this study is by comparing two projected population scenarios, one with international migration and the other without international migration, based on the latest 2005-based population projections. The analysis of the scenarios shows that the assumed level of international migration which is higher than the current level contributes to a continuous increase in population over the next 50 years, but has limited effect to prevent or offset the overall aging trend.
Shirley Loh and M. V. George
CSP 2007, 34.2: 103-127 104
Résumé
Ce document examine l’effet de la migration internationale sur la croissance prospective de la population et la structure par âge au Canada pour les 50 prochaines années. Il examine aussi l’impact de la migration internationale sur la croissance et la distribution provinciales. La démarche utilisée dans cette étude est de comparer les deux scénarios de population projetée l’un avec migration internationale et l’autre sans migration internationale, selon les dernières projections de population de 2005. L’analyse des scénarios démontre que le niveau présumé de migration internationale, plus élevé que le niveau actuel, contribue à une croissance continuelle de la population au coursdes 50 prochaines années, mais a peu d’effet quand à la prévention ou la tendance au vieillissement.
Mots clés: projections de population, immigration, émigration, migration internationale nulle
Introduction
Future population size and age structure of a country are determined by the past, present and future patterns, and levels of fertility, mortality and international migration (immigration and emigration). The fertility level in Canada has decreased steadily to below replacement level since 1972, and significant change in this component of growth is not expected in the near future. The mortality trend, in terms of life expectancy at birth, has been slightly upward over the years in Canada. However, it has been shown that the continuing slight increase in life expectancy at birth has limited effect on future population size (George, Loh and Verma, 1997).
Projected Population Size and Age Structure for Canada and Provinces: With or Without International Migration
CSP 2007, 34.2: 103-127 105
level of net international migration was 192,900 with an annual immigration level of 244,600, total emigration level of 45,600 and net non-permanent residents of -6000. When natural increase falls further and becomes negative, net international migration would become the sole factor of growth. The impact of high net international migration could have an effect on the growth and distribution of the provinces and territories as well.
Given the overwhelming significance of international migration to Canada’s population growth, this paper examines the role of net international migration on future population growth and age distribution. The analysis would also indicate the effect of international migration as a mechanism to postpone prospective population decline and to counteract the inevitable increase in population aging in Canada with the increase in the number and proportion of the elderly, which will accelerate with the baby boom cohorts reaching the age of 65 in around 2011. The focus of the paper is to answer the question: in the absence of migration, when and how great would be the decline in population size and how large would be the impact of migration on population aging? It also examines the impact of international migration on provincial growth and distribution2. It should be noted that migration has a direct and indirect effect on population growth and age pattern, the former from the net addition of migration to population and the latter from the reproductive effect of immigrants or their descendants, which is determined by the immigrants’ ages and their fertility level.
Shirley Loh and M. V. George
CSP 2007, 34.2: 103-127 106
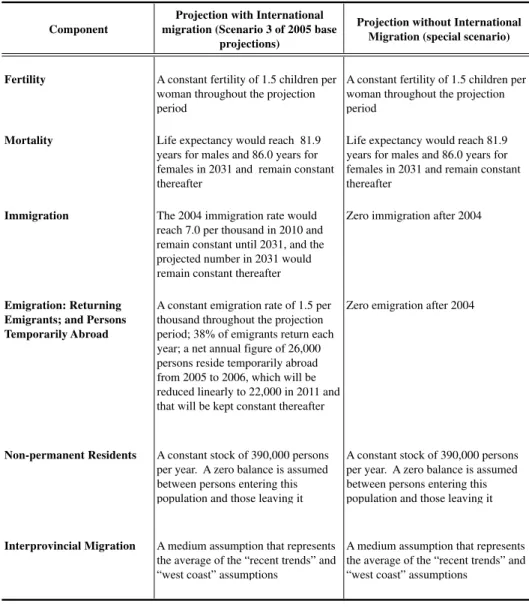
Before examining the effects of international migration, we should note the distinction between “zero international migration” and “zero net international migration”. The latter refers to a situation where the number of immigrants and emigrants is the same, while the former refers to a “closed population” in which there is no immigration or emigration, i.e., the population is not affected by international migration (for further explanations, see Bouvier, Poston and Zhai, 1997). Although several countries assume zero international migration for demographic analysis purposes, it actually exists only for the world as a whole. Canada being an immigrant country, the term zero migration is a misnomer in Canadian demographics. However, in order to isolate and examine the demographic effects of net international migration, we have considered two comparable population scenarios: one with migration, and the other without migration, i.e., with zero migration as a component (see Table 1 for further details).
Projection Method and Assumptions
The population projection model employed in this study is the regional cohort component method. The procedure starts with the base-year population distribution by age and sex. Age-and-sex specific survival ratios, age-specific fertility rates, immigration and emigration rates are applied to this distribution and generate projected numbers of births, deaths, immigrants and emigrants. Projected numbers are also derived for persons temporarily abroad, returning Canadians, non-permanent residents, and interprovincial net migration. These are then either added to or subtracted from the base-year population, depending upon the case, to obtain the projected population for the following year. In order to obtain comparable and consistent projections for Canada, the provinces and the territories, a “bottom up” approach is used for producing projections at the provincial and territorial level.Projections at the national level are then derived by aggregating the projections for the provinces and territories.
Component
Projection with International migration (Scenario 3 of 2005 base
projections)
Projection without International Migration (special scenario)
Fertility A constant fertility of 1.5 children per woman throughout the projection period
A constant fertility of 1.5 children per woman throughout the projection period
Mortality Life expectancy would reach 81.9 years for males and 86.0 years for females in 2031 and remain constant thereafter
Life expectancy would reach 81.9 years for males and 86.0 years for females in 2031 and remain constant thereafter
Immigration The 2004 immigration rate would reach 7.0 per thousand in 2010 and remain constant until 2031, and the projected number in 2031 would remain constant thereafter
Zero immigration after 2004
Emigration: Returning Emigrants; and Persons Temporarily Abroad
A constant emigration rate of 1.5 per thousand throughout the projection period; 38% of emigrants return each year; a net annual figure of 26,000 persons reside temporarily abroad from 2005 to 2006, which will be reduced linearly to 22,000 in 2011 and that will be kept constant thereafter
Zero emigration after 2004
Non-permanent Residents A constant stock of 390,000 persons per year. A zero balance is assumed between persons entering this population and those leaving it
A constant stock of 390,000 persons per year. A zero balance is assumed between persons entering this population and those leaving it
Interprovincial Migration A medium assumption that represents the average of the “recent trends” and “west coast” assumptions
A medium assumption that represents the average of the “recent trends” and “west coast” assumptions
Source: Statistics Canada 2005, Population Projections for Canada, Provinces and Territories, 2005-2031, Catalogue no. 91-520-XPE (Occasional).
Table 1. Summary of Component Assumptions: Medium Growth Scenario
Projected Population Size and Age Structure for Canada and Provinces: With and Without International Migration
Shirley Loh and M. V. George
CSP 2007, 34.2: 103-127 108
range projections enables us to assess the long-term growth and age structure implications of the assumed demographic trends.
A discussion on the rationale for the assumptions on each component is described in detail in the report, Population Projections for Canada, Provinces and Territories, 2005-2031 (Statistics Canada, 2005b). In providing the rationale of the high fertility assumption, it has been noted that the fertility of the growing proportions of immigrants coming from high fertility countries is higher than that of the rest of the Canadian population. A continuing increase in the percentage of immigrants from such countries is taken as a plausible factor for the high fertility assumption (Statistics Canada, 2005b, p. 18). However, separate assumptions have not been made in the fertility projections to take into account the fertility differences between immigrants and the Canadian-born population. The projection methodology assumes that after arriving in Canada the immigrants experience the same fertility and mortality conditions as the rest of the Canadians. This is considered plausible because high fertility levels tend to decline over time, and the impact on the projection results of assuming differential fertility assumptions will be negligible since newly arrived immigrants constitute less than 1% of the total population (George, Loh and Verma, 1997).
Projections Results
National Total Population
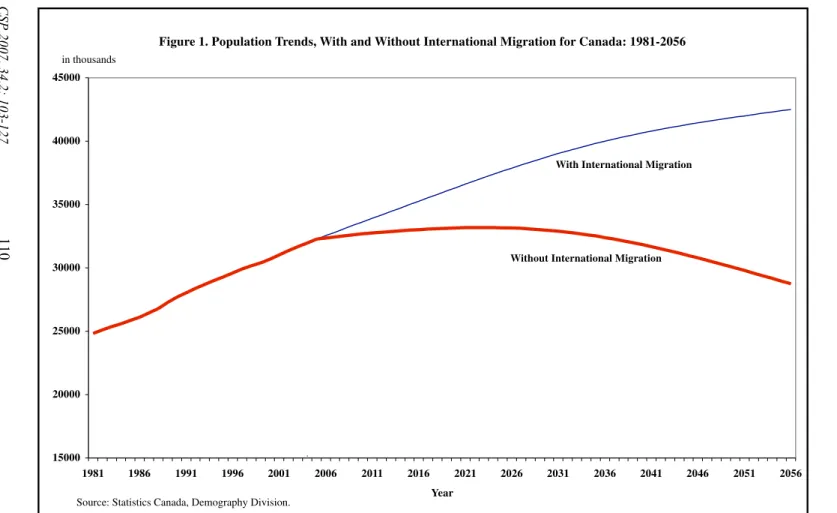
The comparison is made between two medium growth scenarios described above: one with international migration and the other without international migration. The population of Canada for the year 2005 was estimated at 32.3 million. This is the postcensal estimate of the population of Canada on July 1st, 2005, which is based on the 2001 Census, adjusted for net census undercoverage. With international migration, if the medium growth assumptions hold good as described in Table 1, the population of Canada will increase to around 39.0 million by 2031 (Table 2 and Figure 1). The population will continue to grow thereafter to reach about 42.5 million by 2056.
With Without
Year International Migration International Migration Difference
(in millions)
1996 29.6
2001 31.0
2005 32.3
2006 32.5 32.4 0.1
2011 33.9 32.8 1.1
2016 35.3 33.0 2.3
2021 36.6 33.2 3.4
2026 37.9 33.1 4.8
2031 39.0 32.9 6.1
2036 40.0 32.4 7.6
2041 40.8 31.7 9.1
2046 41.4 30.8 10.6
2051 42.0 29.8 12.2
2056 42.5 28.8 13.7
Source: 1996-2005: Statistics Canada, Annual Demographic Statistics, 2005, Catalogue no. 91-213-XIB; 2006-2056: Statistics Canada, Population Projections for Canada, Provinces and Territories, 2005-2031, Catalogue no. 91-520-XPE, and Statistics Canada, Demography Division.
Table 2
Population of Canada, With and Without International Migration
for Selected Years: 1996 to 2056
Projected Population Size and Age Structure for Canada and Provinces: With and Without International Migration
Figure 1. Population Trends, With and Without International Migration for Canada: 1981-2056
15000 20000 25000 30000 35000 40000 45000
1981 1986 1991 1996 2001 2006 2011 2016 2021 2026 2031 2036 2041 2046 2051 2056
Year
With International Migration
Without International Migration
in thousands
Source: Statistics Canada, Demography Division.
Shirley Loh and M. V. George
CSP 2007, 34.2: 103-127
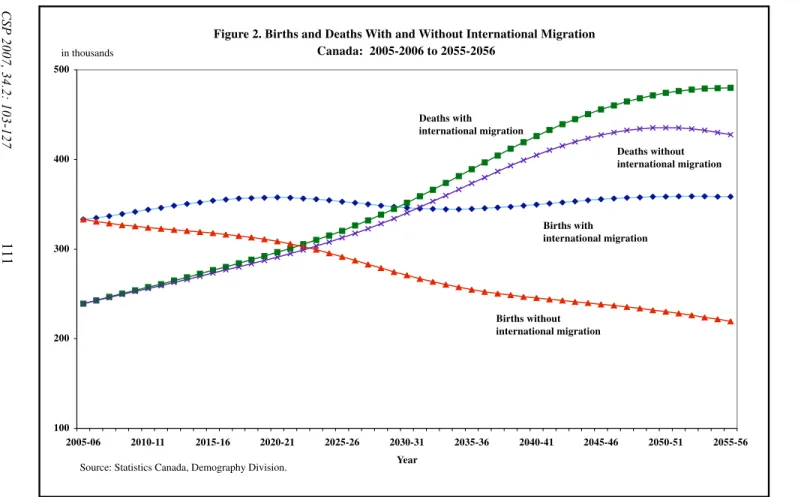
Figure 2. Births and Deaths With and Without International Migration Canada: 2005-2006 to 2055-2056
100 200 300 400 500
2005-06 2010-11 2015-16 2020-21 2025-26 2030-31 2035-36 2040-41 2045-46 2050-51 2055-56
Year
Births with
international migration Deaths with
international migration
Deaths without international migration
Births without international migration
in thousands
Source: Statistics Canada, Demography Division.
Projected Population Size and Age Structure for Canada and Provinces:
With and Without International Migration
CSP 2007, 34.2: 103-127
Shirley Loh and M. V. George
CSP 2007, 34.2: 103-127 112
If no international migration is to occur under the medium growth scenario, and the growth is the result of natural increase only, the population of Canada would continue to grow to 33.2 million by 2023 (when deaths will exceed births), and fall to 28.8 million in 2056. The study on stationary population by George, Lachapelle and Romaniuc (2002) has shown that under the scenario with zero international migration and below replacement fertility level, the population, in the long run, would eventually lead to extinction. In the present context of low fertility below replacement level and possible negative natural increase by around 2023, when deaths will exceed births, immigration becomes the main factor of growth.
The annual difference in total population size between the two scenarios can be discussed in terms of direct effects, and indirect effects, i.e., cumulative net international migration, and cumulative natural increase, respectively. The difference in total population between the medium scenario and the scenario that assumes no international migration indicates the numerical contribution of net international migration to population growth, which amounts to over 6 million in 26 years between 2005 and 2031 and 14 million in 51 years by 2056. The higher difference in the latter period could be attributed to different immigration assumptions for the two periods: an increasing immigration rate up to 2010 which would remain constant thereafter up to 2031; and a constant number of annual immigrants of around 280,000 which is the level reached in 2031, from 2032 to 2051 (see Table 1).
In addition to the direct impact of international migration, there are sizable indirect demographic effects on the receiving country due to immigration, since immigrants not only live in their country of destination, they also have children while living there (Bouvier, Poston and Zhai, 1997). The indirect effect of international migration in this comparison which can be measured as natural increase is less than 1 million when cumulated from 2005 to 2031 and to around 3 million for the period 2005 to 2056.
Projected Population Size and Age Structure for Canada and Provinces: With or Without International Migration
CSP 2007, 34.2: 103-127 113
Table 3
Average Annual Rate of Population Change
Canada: 1996-2001 and 2051-2056
Year With
International Migration
Without International
Migration
(in percent)
1996-2001 0.9 2001-2005 1.0
2005-2006 0.9 0.3
2006-2011 0.8 0.2
2011-2016 0.8 0.2
2016-2021 0.7 0.1
2021-2026 0.7 0.0
2026-2031 0.6 -0.2
2031-2036 0.5 -0.3
2036-2041 0.4 -0.4
2041-2046 0.3 -0.6
2046-2051 0.3 -0.7
2051-2056 0.2 -0.7
Source: 1996-2005: Statistics Canada, Annual Demographic Statistics, 2005, Catalogue no. 91-213-XIB; 2006-2056: Statistics Canada, Population Projections for Canada, Provinces and Territories, 2005-2031, Catalogue no. 91-520-XPE, and Statistics Canada, Demography Division.
Shirley Loh and M. V. George
CSP 2007, 34.2: 103-127 114
Total Population by Province4
Unlike at the national level, the provincial analysis covers the actual projection period, 2005-2031 and not extended beyond. The geographical distribution of immigrants is quite uneven among the provinces, with Ontario, British Columbia, Quebec and Alberta being the major receiving provinces which together received around 96% of the total immigrants (252,500) in 2000-2001. Ontario which accounts for 38% of the Canadian population attracted nearly 59% of immigrants in 2000-2001. In the same year the second province that attracted the most immigrants was British Columbia which took in almost 16% of the total immigrants, followed by Quebec with 15% and Alberta, 7% (Statistics Canada, 2002). By 2004-2005 the total number of immigrants had fallen to 244,600 with some change in provincial ranking of immigrants received. Ontario continued to receive the largest number of immigrants with53% of the Canada total followed by Quebec moving to the second rank with 18% of immigrants, British Columbia 17%, and Alberta 7% (Statistics Canada, 2005a).
How immigrants are distributed among the provinces and what is the impact of immigration on projected population growth? Figure 3 portrays the projected growth with and without international migration among the provinces during the projection period, 2005-2031. The growth of population with international migration includes the direct and indirect effects of immigrants. The indirect effect represents the natural increase among immigrants or the descendants of immigrants who arrived during the 26-year period. The analysis provides the decomposition of the direct and indirect effects of immigration by examining the growth with and without international migration. The description of the provincial distribution here is focused on the four major immigration destination provinces, and the analysis is limited to the first 26 years of the latestprojections, up to 2031.
Figure 3. Population by Province Showing Post-2005 Immigrants and Their Descendants for Canada: 2031
0 2000 4000 6000 8000 10000 12000 14000 16000 18000
Nfld. P.E.I. N.S. N.B. Que. Ont. Man. Sask. Alta. B.C.
Immigrants plus descendants
Projected population without international migration after 2005
in thousands
Source: Statistics Canada, Demography Division.
Projected Population Size and Age Structure for Canada and Provinces:
With and Without International Migration
CSP 2007, 34.2: 103-127
Shirley Loh and M. V. George
CSP 2007, 34.2: 103-127 116
In the medium-growth scenario with international migration, it is assumed that around 44,000 immigrants will enter Quebec annually between 2006 and 2031or roughly 35,000 net international migration. Under this assumption, the population of Quebec will continue to increase to 8.4 million around 2031 from 7.6 million in 2005. In the absence of international migration in the next 26 years, Quebec’s population will decline to 7.3 million by 2031. At the end of the projection period (2031), as a result of the combined direct and indirect effects of international migration, the difference in projected population between the scenarios with migration and without migration would amount to around 1 million.
Under the assumption that around 38,000 to 46,000 immigrants (or around 26,000 to 35,000 net international migration) enter British Columbia annually during the projection period (2006-2031), its population will increase from 4.3 million in 2005 to 5.5 million in 2031. If no international migration occurs after 2005, the population of British Columbia would be lower at 4.6 million in 2031. The difference in projected numbers between the two scenarios will be around 0.9 million.
Alberta’s population is projected to grow from nearly 3.3 million in 2005 to 4.1 million in 2031 if Alberta receives between 17,000 to 20,000 immigrants annually in the next 26 years or between 10,000 and 13,000 net international migration. If no international migration occurs in Alberta, the population will be growing at a slow pace to 3.7 million by 2031. The comparison between the projected populations under the medium-growth scenario with international migration and those under no international migration scenario shows that the contribution of international migration to population growth in Alberta could be around 428,000 over the next 26 years.
Total Population by Age
Projected Population Size and Age Structure for Canada and Provinces: With or Without International Migration
CSP 2007, 34.2: 103-127 117
has lowered the average age of the population in these seven countries by 0.4 to 1.4 years. Similar conclusions were reached by other studies that analyzed the effects of the inflows of immigrants on the future age structure of a host population. Lesthaeghe, Page and Surkyn (1988) projected the age structure of twelve European countries with and without migration up to the year 2060. They conclude that the overall aging trend in these countries can be attenuated through immigration but it cannot be prevented.
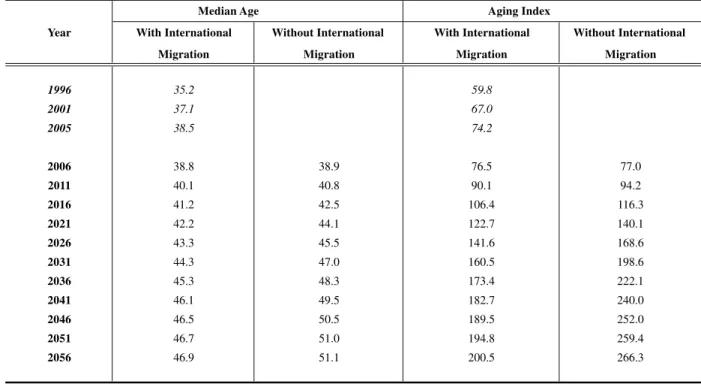
As a result of a continuing sub-replacement fertility level since the early 1970s and its assumed continuation during the projection period, Canada’s population will undergo considerable aging in the 21st century. This is reflected in the projected increase in the median age from 38.5 years in 2005 to 44.3 years in 2031 and further to 46.9 years in 2056, under the medium assumption on immigration and emigration (Table 4). In the absence of international migration, the median age would be 2.7 years older than that of the projected population with migration by 2031, and 4.2 years older by 2056.
Another measure of aging, aging index confirms the continuing enormous aging of the Canadian population in the scenarios with international migration and without international migration (Table 4). In 2005, Canada’s population can be described as old, with an aging index of 74.2 persons aged 65 and over to every 100 persons under 15. With international migration, the aging index will increase to 160.5 and 200.5 by 2031 and 2056, respectively. Without international migration, the aging index will increase to 198.6 by 2031 and to 266.3 by 2056. Thus, compared with the scenario without international migration will have 38 and 66 more persons aged 65 and over to every 100 persons under age 15 by 2031 and 2056, respectively. The reproductive effect of international migration on the receiving country helps to lower the aging index during the projection period but the aging trend cannot be prevented.
Table 4. Median Age and Aging Index, With and Without International Migration for Canada, Selected Years: 1996 to 2056
Median Age Aging Index
Year With International Without International With International Without International
Migration Migration Migration Migration
1996 35.2 59.8
2001 37.1 67.0
2005 38.5 74.2
2006 38.8 38.9 76.5 77.0
2011 40.1 40.8 90.1 94.2
2016 41.2 42.5 106.4 116.3
2021 42.2 44.1 122.7 140.1
2026 43.3 45.5 141.6 168.6
2031 44.3 47.0 160.5 198.6
2036 45.3 48.3 173.4 222.1
2041 46.1 49.5 182.7 240.0
2046 46.5 50.5 189.5 252.0
2051 46.7 51.0 194.8 259.4
2056 46.9 51.1 200.5 266.3
Note: The aging index refers to the number of people aged 65 and over per 100 persons under 15.
Source: 1996-2005: Statistics Canada, Annual Demographic Statistics, 2005, Catalogue no. 91-213-XIB;
2006-2056: Statistics Canada, Population Projections for Canada, Provinces and Territories,
2005-2031, Catalogue no. 91-520-XPE, and Statistics Canada, Demography
Division.
Shirley Loh and M. V. George
CSP 2007, 34.2: 103-127
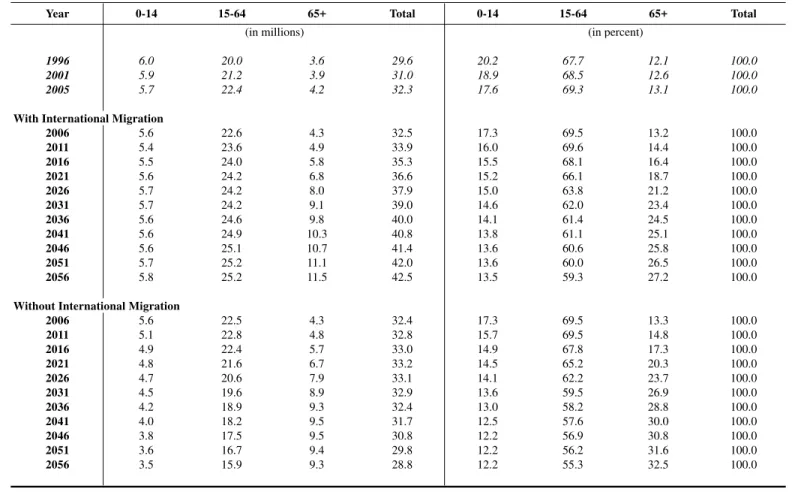
Table 5. Age Structure of Canada's Population, With and Without International Migration for Selected Years: 1996 to 2056
Year 0-14 15-64 65+ Total 0-14 15-64 65+ Total
1996 6.0 20.0 3.6 29.6 20.2 67.7 12.1 100.0
2001 5.9 21.2 3.9 31.0 18.9 68.5 12.6 100.0
2005 5.7 22.4 4.2 32.3 17.6 69.3 13.1 100.0
With International Migration
2006 5.6 22.6 4.3 32.5 17.3 69.5 13.2 100.0
2011 5.4 23.6 4.9 33.9 16.0 69.6 14.4 100.0
2016 5.5 24.0 5.8 35.3 15.5 68.1 16.4 100.0
2021 5.6 24.2 6.8 36.6 15.2 66.1 18.7 100.0
2026 5.7 24.2 8.0 37.9 15.0 63.8 21.2 100.0
2031 5.7 24.2 9.1 39.0 14.6 62.0 23.4 100.0
2036 5.6 24.6 9.8 40.0 14.1 61.4 24.5 100.0
2041 5.6 24.9 10.3 40.8 13.8 61.1 25.1 100.0
2046 5.6 25.1 10.7 41.4 13.6 60.6 25.8 100.0
2051 5.7 25.2 11.1 42.0 13.6 60.0 26.5 100.0
2056 5.8 25.2 11.5 42.5 13.5 59.3 27.2 100.0
Without International Migration
2006 5.6 22.5 4.3 32.4 17.3 69.5 13.3 100.0
2011 5.1 22.8 4.8 32.8 15.7 69.5 14.8 100.0
2016 4.9 22.4 5.7 33.0 14.9 67.8 17.3 100.0
2021 4.8 21.6 6.7 33.2 14.5 65.2 20.3 100.0
2026 4.7 20.6 7.9 33.1 14.1 62.2 23.7 100.0
2031 4.5 19.6 8.9 32.9 13.6 59.5 26.9 100.0
2036 4.2 18.9 9.3 32.4 13.0 58.2 28.8 100.0
2041 4.0 18.2 9.5 31.7 12.5 57.6 30.0 100.0
2046 3.8 17.5 9.5 30.8 12.2 56.9 30.8 100.0
2051 3.6 16.7 9.4 29.8 12.2 56.2 31.6 100.0
2056 3.5 15.9 9.3 28.8 12.2 55.3 32.5 100.0
Source: 1996-2005: Statistics Canada, Annual Demographic Statistics, 2005, Catalogue no. 91-213-XIB; 2006-2056: Statistics Canada,
Population Projections for Canada, Provinces and Territories, 2005-2031, Catalogue no. 91-520-XPE, and Statistics Canada, Demography Divisiion.
(in millions) (in percent)
Projected Population Size and Age Structure for Canada and Provinces:
With and Without International Migration
CSP 2007, 34.2: 103-127
Shirley Loh and M. V. George
CSP 2007, 34.2: 103-127 120
The comparison of the two scenarios also indicates that migration has had only a modest effect in rejuvenating the population of Canada. Even if the population is affected by a net gain in international migration of 183,000 to 221,000 annually over a 51-year period, 2005 to 2056, the proportion of the elderly to the total population would be lowered only by 5.3 percentage points.
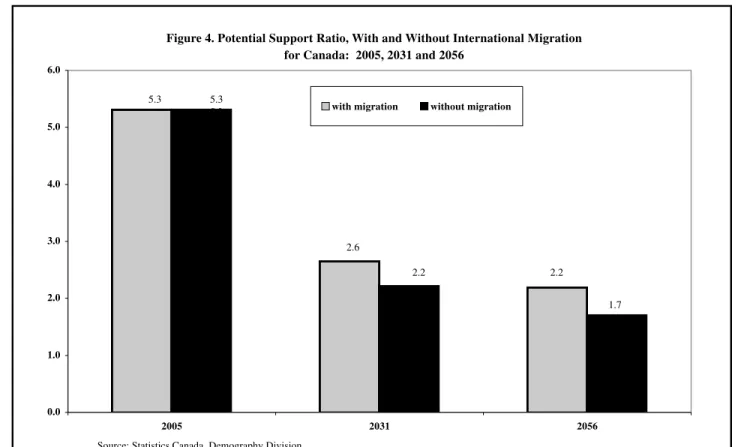
Further, the impact of continued aging of the population is readily apparent from the measure, potential support ratio, which is the number of working-age people per senior. Figure 4 shows that between 2005 and 2031, this ratio will decline from 5.3 working-age persons for each senior to about 2.6 in the scenario with migration and 2.2 in the scenario without migration. The ratio will decline further to around two working-age persons for each senior by 2056 whether the projections include international migration or exclude international migration.
In the latest population projections of Canada (Statistics Canada, 2005b), even in the high growth scenario (Scenario 6) assuming an increase in fertility to 1.7 children per woman by 2016, and an increase in immigration rate to 8.5 per thousand population by 2010 (i.e., an increase in annual immigrants from 239,000 in 2005 to 364,000 in 2056), the potential support ratio in 2031 is projected to be 2.7, about the same as that of the projection scenario with migration (Scenario 3) presented in this study, and by 2056, the ratio will only increase to 2.3 working-age persons for each senior, rather than 2.2. The limited effect of international migration on the future age structure of the Canadian population is also presented by George, Nault and Romaniuc (1991). A three-fold increase in the annual number of immigrants from 140,000 to 500,000 during a 25-year projection period would not produce significant effect on the young and elderly population. The proportion of the age group 0-19 would increase from 22.4% to 23.6%, while age group 65 and over would register a smaller decrease from 15.8% to 14.4%. The substantial increase in immigration would have almost no impact on the 20-64 age group, from 61.8% to 61.9%.
Under the medium-growth scenario with international migration, the working-age group will account for 62% of the total population in 2031, down from 69% in 2005. By 2056, this proportion would have dropped to 59%. In the absence of international migration, the working-age population will drop further to 60% and 55% by 2031 and 2056, respectively (Table 5).
Figure 4. Potential Support Ratio, With and Without International Migration for Canada: 2005, 2031 and 2056
0.0 1.0 2.0 3.0 4.0 5.0 6.0
2005 2031 2056
with migration without migration
5.3 5 3
2.6
2.2 2.2
1.7 5.3
Source: Statistics Canada, Demography Division.
Projected Population Size and Age Structure for Canada and Provinces:
With and Without International Migration
CSP 2007, 34.2: 103-127
Table 6. Dependency Ratios, With and Without International Migration,
for Canada, Selected Years: 1996 to 2056
Dependency Ratio
Children (0-14) Elderly people (65+) Total
Year
with without with without with without
1996 29.9 17.9 47.7
2001 27.6 18.5 46.0
2005 25.4 18.9 44.3
2006 24.9 24.8 19.0 19.1 43.9 44.0
2011 23.0 22.6 20.7 21.3 43.7 43.9
2016 22.7 22.0 24.1 25.6 46.8 47.6
2021 23.1 22.2 28.3 31.1 51.4 53.3
2026 23.5 22.6 33.3 38.2 56.8 60.8
2031 23.5 22.8 37.7 45.2 61.3 68.0
2036 23.0 22.3 39.9 49.5 62.9 71.8
2041 22.5 21.7 41.1 52.1 63.6 73.8
2046 22.4 21.5 42.5 54.2 65.0 75.7
2051 22.6 21.7 44.1 56.4 66.7 78.1
2056 22.9 22.1 45.8 58.8 68.7 80.9
Note: The dependency ratio refers to the number of people of "dependent age" per 100 persons of "working age".
Source: 1996-2005: Statistics Canada, Annual Demographic Statistics, 2005, Catalogue no. 91-213-XIB; 2006-2056: Statistics Canada, Population Projections for Canada, Provinces and Territories, 2005-2031, Catalogue no. 91-520-XPE, and Statistics Canada, Demography Division.
International migration International migration International migration
Shirley Loh and M. V. George
CSP 2007, 34.2: 103-127
Projected Population Size and Age Structure for Canada and Provinces: With or Without International Migration
CSP 2007, 34.2: 103-127 123
2031and to 69 by 2056. The dependency ratios will increase at a faster pace in the absence of international migration. The ratios would be 68 in 2031 and almost 81 by 2056. The rapid increase in the demographic dependency ratio in both scenarios after around 2011 is primarily due to the fact that the large baby- boom cohorts would be reaching age 65 and over from this year on, and the decline in the working-age population (Table 5).
As the number and percentage of working-age population is decreasing faster in the scenario without international migration, the total dependency ratios and those for the elderly are higher in this than in the scenario with international migration. Both scenarios show that the child dependency ratios after 2011 would be lower than those for the elderly people, and that the difference between the two ratios would be greater in the scenario without international migration. The below replacement fertility in the past two decades and the decline in mortality have contributed to the lower child dependency ratios for children than for the elderly. The assumed increasing international migration would be accentuating the difference in the dependency ratios for the elderly and for the children in future years.
Conclusion
As revealed by the latest 2005 base population projections, the population of Canada, under the medium-growth scenario with international migration, would continue to grow during the coming fifty years to 39.0 million in 2031 and to 42.5 million by 2056. In the absence of international migration, the population would increase to a peak of 33.2 million in around 2023 and then gradually start to fall to about 28.8 million in 2056. Thus, without international migration, Canada’s population will cease to grow after 2023 when deaths will exceed births. During this period of about 18 years, the population will increase only by 912,000 to 33.2 million in 2023. Thereafter, the population will decline to 32.9 million by 2031, and to 28.8 million by 2056. The comparison between the projected population under the medium-growth scenario with international migration and those under the no migration scenario shows that the contribution of net migration to population growth in Canada could be over 6 million over the next 26 years and about 14 million over the next 51 years (Statistics Canada 2005b).
Shirley Loh and M. V. George
CSP 2007, 34.2: 103-127 124
of roughly 183,000 to 221,000 net migration annually between 2005 and 2056, population decline would not happen within the projection period.
Among the provinces, the contribution of net international migration to the provincial population growth is proportional to the net number of immigrants entering the province. Since more than 50% of the total immigrants in Canada settle in Ontario (53% in 2005), the comparison of the scenarios with and without net international migration shows that the difference in its projected total population will be around 3 million by 2031, which is the largest among all the provinces.
Given the fact that age structure of immigrants is often younger than that of the host population, international migration seems to be a viable option in the short to medium term to reduce the decline in the working-age population. The projections presented show that with the presence of international migration, the working-age population in Canada will continue to grow during the projection period, with a size of 25.2 million in 2056 which is still larger than that in 2005 (22.4 million). In the absence of international migration, the projected working-age population will grow slower and will start to decline around 2016. By 2056, the size of the working-age population would be 15.9 million, 6.5 million less than that in 2005.
As a result of the persistent below replacement fertility level and increased longevity, there will be profound changes in the age structure of Canada’s population with an enormous increase in the number and proportion of the elderly. The scenarios presented show that international migration cannot prevent or offset the overall aging trend. A study done by George, Nault and Romaniuc (1991) comes up with similar conclusions that immigration effects are evenly spread over all age groups. Thus, it has little effect on age distribution. The study also shows that the initial age distribution would have the greatest impact on future age distribution. The future age distribution of the Canadian population will bear the mark of the post-war baby boom for many decades. A brief analysis of immigration on future population growth as a part of a broader study on impact of immigration in the receiving countries has come up with a similar conclusion that immigration assumptions (presented in the study) have a rather small impact on the age structure (Basavarajappa, Beaujot and Samuel, 1993).
Projected Population Size and Age Structure for Canada and Provinces: With or Without International Migration
CSP 2007, 34.2: 103-127 125
population scenarios, one with and the other without international migration, shows that even the increased assumed level of net international migration, which is higher than the current level, will not be able to reverse the population aging trend in Canada at least in the next 50 years.
Acknowledgements:
The authors wish to thank Alain Bélanger of Statistics Canada for providing the special projection scenario, and Ravi Verma, also of Statistics Canada for his helpful comments, and Daniel Larrivée of Health Canada and Julie Dussault of Statistics Canada for the French translation of the abstract. Support from Pamela White, Margaret Michalowski and André Cyr of Statistics Canada is gratefully acknowledged. Finally, we thank the two anonymous reviewers for their valuable comments and suggestions in an earlier version of this paper. The views expressed herein are those of the authors and do not necessarily reflect those of Statistics Canada.
End Notes:
1. This is a revised version of a paper presented at the annual meeting of the Canadian Population Society, Quebec City, 2001. It is extensively revised based on the updated Statistics Canada population projections for Canada, provinces and territories, 2005-2031.
2. The three territories are not included in the regional analysis due to the small number of immigrants destined to settle there. For example, in 2004-2005, the territories received a total of 147 immigrants out of the total annual number of 244,600 arrived in Canada.
3. These are the latest population projections for Canada,
provinces/territories produced by Statistics Canada (for details, refer to Statistics Canada, 2005b).
Shirley Loh and M. V. George
CSP 2007, 34.2: 103-127 126
References
Basavarajappa, K.G., R. P. Beaujot and T.J. Samuel. 1993. Impact of Migration in the Receiving Countries, Canada (ed. L.A. Kosinski). International Organization for Migration, Geneva.
Bouvier, L.F., D.L. Poston, Jr. and N.B. Zhai. 1997. “Population Growth Impacts of Zero Net International Migration”. International Migration Review, Vol. 31 (2): 294-311.
George, M.V., R. Lachepelle and A. Romaniuc. 2002. “Stationary Population as a Vision for the Future: An Exercise in Normative Projection”. Revised paper prepared for the annual meeting of the Canadian Population Society, May 30-June 1, 2002, Toronto, Ontario.
George, M. V., S. Loh and R. B. P. Verma. 1997. “The Impact of Varying the Component Assumptions on Projected Total Population and Age Structure in Canada”. Canadian Studies in Population, Vol. 24 (1): 67-86.
George, M. V., F. Nault and A. Romaniuc. 1991. “Effects of Fertility and International Migration on Changing Age Composition In Canada”. Statistics Journal of the United Nations Economic Commission for Europe, Vol. 8 (1): 13-24.
Le Bras, H. 1991. “Demographic Impact of Post-war Migration in Selected OECD Countries”. In Migration. The Demographic Aspects. Paris: Organization for Economic Co-operation and Development, pp. 15-26.
Lesthaeghe, R., H. Page and J. Surkyn. 1988. “Are Immigrants Substitutes for Births?” IPD Working Paper 1988-3. Brussels: Interuniversity Programme in Demography.
Statistics Canada. 2001a. Annual Demographic Statistics, 2000. Catalogue No. 91-213-XPB. Ottawa.
Statistics Canada.2001b. Population Projections for Canada, Provinces and Territories, 2000-2026. Catalogue No. 91-520 (Occasional). Ottawa.
Projected Population Size and Age Structure for Canada and Provinces: With or Without International Migration
CSP 2007, 34.2: 103-127 127
Statistics Canada. 2005a. Annual Demographic Statistics, 2005. Catalogue No. 91-213-XIB. Ottawa.
Statistics Canada. 2005b. Population Projections for Canada, Provinces and Territories, 2005-2031. Catalogue No. 91-520-XPE (Occasional). Ottawa.
United Nations. 2000. Replacement Migration: Is it a Solution to Declining and Ageing Populations? Population Division, New York.