SED
6, 887–917, 2014Biochar increases plant available water
M. T. de Melo Carvalho et al.
Title Page
Abstract Introduction
Conclusions References
Tables Figures
◭ ◮
◭ ◮
Back Close
Full Screen / Esc
Printer-friendly Version Interactive Discussion
Discussion
P
a
per
|
D
iscussion
P
a
per
|
Discussion
P
a
per
|
Discuss
ion
P
a
per
|
Solid Earth Discuss., 6, 887–917, 2014 www.solid-earth-discuss.net/6/887/2014/ doi:10.5194/sed-6-887-2014
© Author(s) 2014. CC Attribution 3.0 License.
Open Access
Solid Earth
Discussions
This discussion paper is/has been under review for the journal Solid Earth (SE). Please refer to the corresponding final paper in SE if available.
Biochar increases plant available water in
a sandy soil under an aerobic rice
cropping system
M. T. de Melo Carvalho1,2,3, A. de Holanda Nunes Maia4, B. E. Madari1, L. Bastiaans2, P. A. J. van Oort2,5, A. B. Heinemann1, M. A. Soler da Silva1, F. A. Petter6, and H. Meinke3
1
Embrapa Rice and Beans, Santo Antônio de Goiás, Goiás, Brazil
2
Wageningen University, Centre for Crop Systems Analysis, Wageningen, the Netherlands
3
Tasmanian Institute of Agriculture, University of Tasmania, Hobart, Australia
4
Embrapa Environment, Jaguariúna, SP, Brazil
5
Africa Rice Centre, Cotonou, Benin
6
Federal University of Mato Grosso, Sinop, Mato Grosso, Brazil
Received: 28 February 2014 – Accepted: 3 March 2014 – Published: 18 March 2014
Correspondence to: M. T. de Melo Carvalho ([email protected])
SED
6, 887–917, 2014Biochar increases plant available water
M. T. de Melo Carvalho et al.
Title Page
Abstract Introduction
Conclusions References
Tables Figures
◭ ◮
◭ ◮
Back Close
Full Screen / Esc
Printer-friendly Version Interactive Discussion
Discussion
P
a
per
|
D
iscussion
P
a
per
|
Discussion
P
a
per
|
Discuss
ion
P
a
per
|
Abstract
The main objective of this study was to assess the impact of biochar rate (0, 8, 16 and 32 t ha−1) on the water retention capacity (WRC) of a sandy Dystric Plinthosol. The ap-plied biochar was a by-product of slow pyrolysis (∼450◦C) of eucalyptus wood, milled to pass through a 2000 µm sieve that resulted in a material with an intrinsic porosity 5
≤10 µm and a specific surface area of∼3.2 m2g−1. The biochar was incorporated into the top 15 cm of the soil under an aerobic rice system. Our study focused on both the effects on WRC and rice yields at 2 and 3 years after application. Undisturbed soil samples were collected from 16 plots in two soil layers (5–10 and 15–20 cm). Soil wa-ter retention curves were modelled using a nonlinear mixed model which appropriately 10
accounts for uncertainties inherent of spatial variability and repeated measurements taken within a specific soil sample. We found an increase in plant available water in the upper soil layer proportional to the rate of biochar, with about 0.8 % for each t ha−1 of biochar amendment at 2 and 3 years after application. The impact of biochar on soil WRC was most likely related to an increase in overall porosity of the sandy soil, which 15
was evident from an increase in saturated soil moisture and macro porosity with 0.5 % and 1.6 % for each t ha−1 of biochar applied, respectively. The increment in soil WRC did not translate into an increase in rice yield, essentially because in both seasons the amount of rainfall during critical period for rice production exceeded 650 mm. The use of biochar as a soil amendment can be a worthy strategy to guarantee yield stability 20
SED
6, 887–917, 2014Biochar increases plant available water
M. T. de Melo Carvalho et al.
Title Page
Abstract Introduction
Conclusions References
Tables Figures
◭ ◮
◭ ◮
Back Close
Full Screen / Esc
Printer-friendly Version Interactive Discussion
Discussion
P
a
per
|
D
iscussion
P
a
per
|
Discussion
P
a
per
|
Discuss
ion
P
a
per
|
1 Introduction
Soil water retention capacity (WRC) is a potential indicator of soil quality and pro-ductivity. Several agronomic practices such as no-tillage, mulching and cover crops are implemented aiming to improve soil physical properties. An enhanced soil WRC through the adoption of these practices is attained via protection of the soil surface, 5
improved soil aeration and infiltration, or an increased soil organic matter level. The use of carbonised biomass, or biochar, has been regarded as an interesting option for improving soil physical properties (Glaser et al., 2002). The rising demand for charcoal by iron smelters in Brazil has resulted in a rapid increase in the area covered with tim-ber plantations. Between 2005 and 2010 the total increase was 23 %. In 2010, forest 10
plantations in Brazil covered six million hectares of which 73 % comprised of eucalyp-tus forests. Of all produced wood, around 35 % was destined to charcoal production (ABRAF, 2010). Small pieces of char (<8 mm) have to be compacted into bricks if they are to be used as charcoal by iron smelters. Alternatively, these pieces can be recycled as soil amendment. Potentially, a large quantity of this type of biochar is available for 15
Brazilian farmers. It is this material that was tested in the current study.
Tryon (1948) showed that soil moisture at field capacity in a sandy soil increased linearly with increasing wood biochar application rate. Several recent studies have also reported the potential of wood biochar to increase WRC of sandy soils (Pereira et al., 2012; Dempster et al., 2012; Basso et al., 2013; Abel et al., 2013; Ibrahim et al., 2013). 20
The majority of studies were conducted under artificially controlled conditions, testing the effect of a wide range of biochar amounts on WRC. Though such studies are use-ful, the extrapolation of their results to field conditions present some limitations: (i) the amounts of biochar tested are often larger than what is practically and economically feasible for incorporation into agricultural fields; (ii) the conditions for biochar applica-25
SED
6, 887–917, 2014Biochar increases plant available water
M. T. de Melo Carvalho et al.
Title Page
Abstract Introduction
Conclusions References
Tables Figures
◭ ◮
◭ ◮
Back Close
Full Screen / Esc
Printer-friendly Version Interactive Discussion
Discussion
P
a
per
|
D
iscussion
P
a
per
|
Discussion
P
a
per
|
Discuss
ion
P
a
per
|
conditions than under field trials. Thus, more long term studies on the effect of biochar under field conditions are required.
The increment in available water following biochar application is commonly related to the porous structure of the material. The pores behave as additional capillaries, favour-ing the WRC of the soil. Primarily, the number and size of pores is determined by the 5
type of feedstock, temperature level and time of pyrolysis. The specific surface area (SSA) of biochar increases with temperature of pyrolysis (Lei and Zhang, 2013; Borne-mann et al., 2007). At temperatures of 450◦C the SSA can be smaller than 10 m2g−1, while at temperatures of 600–750◦C it can rise to around 400 m2g−1 (Kookana et al., 2011). Clearly, SSA is a characteristic that should be considered when the impact of 10
biochar on soil WRC is investigated. Secondly, the particle size of biochar can be a de-terminant of the potential positive effect on soil WRC. Tryon (1948) showed that the impact on soil WRC was higher with finer material (<1000 µm) than with larger particle sized biochar (2000–5000 µm).
The soil WRC is represented by the nonlinear relation between volumetric soil 15
moisture and matric potential, referred to as the soil water retention curve (SWRC). Such curves can be used as indicators of changes in soil physical properties caused by the incorporation of biochar into the soil matrix. The van Genuchten model (van Genuchten, 1980) is one of the most widely used representations of the soil WRC. Gen-erally, statistical programs specifically designed to fit SWRC only allow fitting of curves 20
for isolated treatments, without accounting for experimental structure (e.g., Dourado-Neto et al., 2000). The isolated treatment-specific model fitting has three main disad-vantages: (i) comparison of SWRC between treatments via formal statistical tests is not possible due to the absence of an error structure that accounts for overall vari-ance within treatments; (ii) autocorrelations among random errors of moisture mea-25
SED
6, 887–917, 2014Biochar increases plant available water
M. T. de Melo Carvalho et al.
Title Page
Abstract Introduction
Conclusions References
Tables Figures
◭ ◮
◭ ◮
Back Close
Full Screen / Esc
Printer-friendly Version Interactive Discussion
Discussion
P
a
per
|
D
iscussion
P
a
per
|
Discussion
P
a
per
|
Discuss
ion
P
a
per
|
(Omuto et al., 2006). In this study we propose the use of nonlinear mixed (NLM) model to overcome these disadvantages.
Circa 40 % of overall Brazilian crop production is located in the Brazilian Midwest region (IBGE, 2012), where our study was conducted. The predominant biome in this region is a tropical savannah. Though a tropical savannah is a drought prone environ-5
ment (Peel et al., 2007), Brazilian farmers usually manage to grow two crops during the wet season (from October to March). However, rising temperatures and changes in rainfall distribution pattern have decreased the chances of an economically successful second harvest. Further temperature rises are projected to provoke decreases in suit-able area for cultivation of the majority of crops in Brazil, mainly due to an increase in 10
evapotranspiration (Assad et al., 2008). This further stresses the need of agronomic measures able to increase the water use efficiency in crop production.
The current study is a continuation of the experiment described by Petter et al. (2012), in which they showed that rice yields increased with around 3 % t ha−1 biochar amendment in the first and second seasons after application. Additionally, in 15
a pot experiment using a sterile sand, Pereira et al. (2012) observed an increase in soil WRC at matric potentials lower than−6 kPa with a rate of 12 %w/w of a similar biochar as the one tested in this study, accompanied by a delay in the point where rice transpiration rate is affected by water stress and declines. Hence, the main objective of this study was to test the impact of a range of wood biochar rates (up to 1.5 %w/w) 20
SED
6, 887–917, 2014Biochar increases plant available water
M. T. de Melo Carvalho et al.
Title Page
Abstract Introduction
Conclusions References
Tables Figures
◭ ◮
◭ ◮
Back Close
Full Screen / Esc
Printer-friendly Version Interactive Discussion
Discussion
P
a
per
|
D
iscussion
P
a
per
|
Discussion
P
a
per
|
Discuss
ion
P
a
per
|
2 Material and methods
2.1 Experimental set up and biochar characterization
In 2008, a permanent non irrigated field trial was set up at Estrela do Sul Farm in Nova Xavantina, Mato Grosso, in the Brazilian Midwest region on sandy Dystric Plinthosol (76 % sand, 17 % clay). The Köpper–Geiger climate classification of the region is Aw 5
(Peel et al., 2007). The monthly precipitation and average temperatures since the start of the field trial is presented in Fig. 1, based on data from Agritempo (2014). Details on the history of the field trial and soil chemical properties can be found in Petter et al. (2012), who reported on the influence of biochar application on rice growth and yields at one month and at one year after application. Here we report on the most re-10
cent growing seasons of rice: from 13 December 2010 to 2 April 2011, and from 13 December 2011 to 2 April 2012, corresponding to two (S2) and three (S3) years after biochar application, respectively. Our analysis focuses on the influence of biochar on two variables, namely soil WRC and rice yields. Biochar was applied once, when the field trial was established on 5 December 2008. Four levels of mineral fertilisation were 15
applied in strips, and the four levels of biochar (0, 8, 16 and 32 t ha−1) where applied within the strips in a randomized block design, with four replicates. Sixteen treatments were used, resulting in a total of 64 experimental plots, each with an area of 40 m2 (4×10 m). Mineral fertilisation was always applied in strips across the four blocks. In S2 and S3, four levels of N-fertilisation (0, 30, 60 and 90 kg N ha−1) were applied and 20
all plots were given the same rate of P-K (kg ha−1) at sowing (60–20 in S2, and 30–30 in S3) taking into account the soil chemical analysis prior sowing and fertilise rec-ommendations for aerobic rice systems in the Brazilian savannah (EMBRAPA, 2007). The N-fertiliser (urea) was divided into three applications: at sowing and at 25 and 45 days after emergence (DAE). Rice (BRS Primavera) was sown directly with a 5-row 25
SED
6, 887–917, 2014Biochar increases plant available water
M. T. de Melo Carvalho et al.
Title Page
Abstract Introduction
Conclusions References
Tables Figures
◭ ◮
◭ ◮
Back Close
Full Screen / Esc
Printer-friendly Version Interactive Discussion
Discussion
P
a
per
|
D
iscussion
P
a
per
|
Discussion
P
a
per
|
Discuss
ion
P
a
per
|
(5 L ha−1) applied at around 15 days prior to sowing and with 2–4 D (0.7 L ha−1) or Star Rice® (0.4 L ha−1) around 10 DAE. Additionally, manual weeding operations were conducted at around 45 and 75 DAE.
Air dried biochar (particle size≤2000 µm) was spread manually on the soil surface, and incorporated into the upper 15 cm, using a harrow. The amount of biochar applied 5
to the upper 15 cm was based on the average amount of pyrogenic C found in the fer-tile anthropogenic dark earths (ADE) of the Amazon. According to Glaser et al. (2001) the upper 30 cm of the ADE soils contain around 25 t ha−1 pyrogenic C, correspond-ing to an amount of 12.5 t ha−1 within 0–15 cm soil layer. As the biochar tested in our field trial had a concentration of 77 % pyrogenic C, we applied a lower (8 t ha−1), sim-10
ilar (16 t ha−1) and higher (32 t ha−1) rate of biochar than the amount of pyrogenic C found in ADE. Considering the soil bulk density and depth where biochar was applied, the application rate on a dry mass basis (weight of biochar/total weight of soil), was equivalent to 0.4, 0.7, and 1.5 % w/w. The biochar was made of eucalyptus timber via slow pyrolysis in a cylindrical metal kiln using temperatures around 400–500◦C. 15
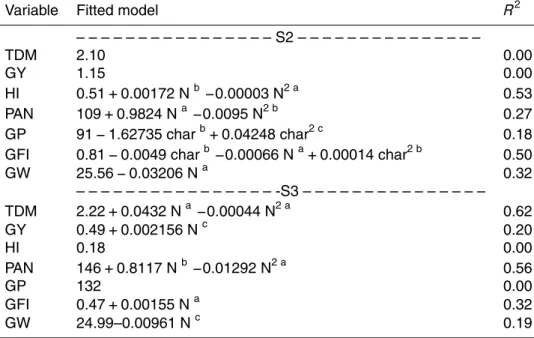
A single point surface area of biochar was determined by the Brunauer, Emmelet and Teller (BET) nitrogen absorption method (Brunauer et al., 1938), using nitrogen gas sorption analysis at 77.3 K (−195.9◦C). The specific surface area (SSA) of the biochar applied, with a bulk density of 0.3 g cm−3, was 3.2±0.5 m2g−1. The porous structure of the biochar (pore size≤10 µm) is shown in Fig. 2. Chemical properties of biochar 20
were described in Petter et al. (2012).
2.2 Measurements on soil WRC and the modelling of SWRCs
The soil WRC was evaluated at two (S2) and three (S3) years after biochar application. Soil samples (cylinders of inox steel of 5 cm height and 5 cm diameter) were collected from trenches 50 cm deep between rows of rice around 75 DAE. Setting of mini-25
SED
6, 887–917, 2014Biochar increases plant available water
M. T. de Melo Carvalho et al.
Title Page
Abstract Introduction
Conclusions References
Tables Figures
◭ ◮
◭ ◮
Back Close
Full Screen / Esc
Printer-friendly Version Interactive Discussion
Discussion
P
a
per
|
D
iscussion
P
a
per
|
Discussion
P
a
per
|
Discuss
ion
P
a
per
|
biochar was incorporated into the upper 15 cm layer, soil samples were collected in the centre (5–10 cm) and just below (15–20 cm) this layer to account for an effect of biochar that had possibly moved out the original layer. Samples were collected from 16 plots (4 biochar rates×4 plots, one sample per soil layer per plot) in a moist soil on 15 March 2011 and on 3 March 2012. The soil WRC was determined according to 5
EMBRAPA (1997). Samples were saturated with water for 12 h and analysed in a cen-trifuge Kokusan H-1400pF®, four samples at a time, for 30 min under seven speed levels: 600, 700, 800, 1300, 1800, 2400 and 9100 rpm (equivalent to 0, 33.00, 44.92, 58.67, 154.93, 297.03 and 528.05g). The volume of the soil water in the samples sub-jected to different speeds corresponded to seven matric potentials:−6,−8,−10,−33, 10
−60,−100 and−1500 kPa. The bulk density was determined as the ratio between the dried mass of soil and the volume of a cylinder. The bulk density was used to calculate the volumetric soil moisture (cm3cm−3). Saturated soil moisture was determined as the soil moisture content in saturated samples at 0 kPa right before subjecting samples to different speeds in the centrifuge.
15
The relation between observed volumetric soil moisture and soil matric potential (the soil water retention curve – SWRC) was determined by fitting the van Genuchten model described in Eq. (1).
θ(ψ)=θr+(θs−θr)
1 1+(αψ)n
m
(1) 20
where,θ(Ψ) is the volumetric soil moisture (cm3cm−3) at a given matric potential Ψ
(kPa);θr is the residual soil moisture (soil moisture content at a Ψ≥ −1500 kPa); θs is the saturated soil moisture (soil moisture content at 0 kPa); and m, α, and n are shape parameters. The Mualen constraintm=1−1/n(Mualem, 1976) was adopted to increase model parsimony.
25
SED
6, 887–917, 2014Biochar increases plant available water
M. T. de Melo Carvalho et al.
Title Page
Abstract Introduction
Conclusions References
Tables Figures
◭ ◮
◭ ◮
Back Close
Full Screen / Esc
Printer-friendly Version Interactive Discussion
Discussion
P
a
per
|
D
iscussion
P
a
per
|
Discussion
P
a
per
|
Discuss
ion
P
a
per
|
and θs as known parameters. By adopting such approach, the uncertainty of the es-timates of shape parameters α and n and the test of the null hypothesis of interest were performed considering the overall variance of soil moisture arising from within treatments variance. Further, the NLM model permits accounting for potential random effects associated to plot location, as proposed by Omuto et al. (2006). In our study, 5
correlations among measurements taken within the same sample unit (one cylinder per plot for each soil depth) were accounted for by including plot as a random effectu in the model. The core of the NLM model adopted is the van Genuchten–Mualen model (Eq. 1). The generic NLM model used to estimate the SWRC for each biochar level within two soil layers and two years was given by Eq. (2):
10
ˆ
θi jk =θr(i j)+(θs(i j)−θr(i j)) "
1 1+(αiψi jk)ni
#1−1/ni
+ei jk+ul (2)
where ˆθi jk is the predicted soil moisture of the treatment leveli (i =0, 8, 16, 32 t ha−1) in the replicationj (j=1, 2, 3, 4) at a matric potentialk (k=−6,−8,−10,−33,−60,
−100 kPa);θr(i j) andθs(i j)are the measured soil moisture at treatment level i in repli-15
catej at−1500 kPa and 0 kPa, respectively; αi and ni are the shape parameters for each treatment leveli;ei jk∼N (0, σ2), is the random error associated to each mea-surement ˆθi jk; andul ∼N (0,Σ), represents the random effect of latent variables asso-ciated to location of a plotl (l =1, . . . , 16).
The residual soil moisture (θr(i j)) was assumed as the measured soil moisture con-20
tent at−1500 kPa and the saturated soil moisture (θs(i j)) as the measured soil mois-ture content at 0 kPa. Shape parameters were estimated using the maximum likelihood method, implemented in NLMIXED Procedure of the SAS/STAT® software (SAS Insti-tute Inc., 2008). Comparisons of shape parameters between treatments control and biochar were performed byttests for linear contrasts.
SED
6, 887–917, 2014Biochar increases plant available water
M. T. de Melo Carvalho et al.
Title Page
Abstract Introduction
Conclusions References
Tables Figures
◭ ◮
◭ ◮
Back Close
Full Screen / Esc
Printer-friendly Version Interactive Discussion
Discussion
P
a
per
|
D
iscussion
P
a
per
|
Discussion
P
a
per
|
Discuss
ion
P
a
per
|
2.3 Analysis of soil physical-hydric variables response to biochar rate
The response of some key soil physical-hydric variables to biochar rate was evalu-ated via measurements of: (i) soil bulk density (BD); (ii) saturevalu-ated soil moisture (θs); (iii) residual soil moisture (θr); (iv) macro porosity (MAC), as the predicted soil moisture content between 0 and −6 kPa ( ˆθ0−θˆ6); (v) rice available water (RAW), as the pre-5
dicted soil moisture content between−6 and−100 kPa ( ˆθ6−θˆ100); and (vi) plant avail-able water (PAW) as the predicted soil moisture content between −6 and −1500 kPa ( ˆθ6−θˆ1500). The predicted volumetric soil moisture ( ˆθ) was estimated via model de-scribed in Eq. (2). The RAW was also estimated considering that the critical soil water volume for rice production should be defined at a matric potential of−100 kPa accord-10
ing to Wopereis et al. (1996).
Response of physical-hydric soil variables to biochar rate were analysed for each year and soil layer separately via the quadratic model described in Eq. (3):
yi j=β0+β1chari+β2char2i +ei j (3) 15
where,yi j is the observation of the response variabley corresponding to biochar level
i (i =0, 8, 16, 32 t ha−1) of the replicationj (j=1, 2, 3, 4);β0 is the intercept;β1 and
β2 are the linear and quadratic effects of biochar, respectively; and ei j is the random error associated to each observationyi j.
Analyses were performed using the MIXED procedure (Proc MIXED) of the statisti-20
cal software SAS/STAT®(SAS Institute Inc., 2008). The magnitude of the biochar effect was assessed by nominal significance levels (p values) derived from hypothesis test-ing ofβ1andβ2estimates. Due to the large experimental area, relatively high residual variances were anticipated to occur. For that reason, we adopted 0.10 as the appropri-atepvalue for the selection of model predictors in order to safeguard against high type 25
SED
6, 887–917, 2014Biochar increases plant available water
M. T. de Melo Carvalho et al.
Title Page
Abstract Introduction
Conclusions References
Tables Figures
◭ ◮
◭ ◮
Back Close
Full Screen / Esc
Printer-friendly Version Interactive Discussion
Discussion
P
a
per
|
D
iscussion
P
a
per
|
Discussion
P
a
per
|
Discuss
ion
P
a
per
|
2.4 Measurement and analysis of rice yield and yield components
The response of rice yield and yield components was measured for all biochar and N-fertilisation treatments. At crop maturity, around 100 DAE, total shoot dry matter, grain yield (weight of rice grains dried to 13 % moisture) and yield components (number of panicles, grains panicle−1, grain filling index and 1000-grain weight) were determined 5
in samples collected from 2 rows of 3 m in the centre of each plot. Harvest index was calculated as the ratio between grain yield and total shoot dry matter. Filled and unfilled grains from panicles within the harvested area were separated with a vertical blower and counted with a seed counter. Grain filling index was calculated as the ratio between the number of filled grains and the total number of grains.
10
We used a linear mixed model instead of the commonly used design based ANOVA to analyse the data due the incomplete randomisation of N treatments. The linear mixed model adopted allowed us to account for potential spatial auto-correlation among plot measurements. Location of a plot was established by its position in a specific block and row within a block. The location of a plot was included as a random effect. Biochar, N, 15
biochar×N and quadratic terms were included as fixed effects. Model parameters were estimated by the restricted maximum likelihood method – REML. Analyses were per-formed using the Mixed Procedure (Proc MIXED) of the statistical software SAS/STAT® (SAS Institute Inc., 2008). Graphical residual analysis, influence diagnostics and check-ing for potential violation of model assumption were conducted uscheck-ing the ODS GRAPH-20
ICS option. Response surfaces for identifying patterns of response of rice yields and yield components to biochar and N treatments were modelled for each season sep-arately. A complete quadratic model (Eq. 4) in which all predictors (biochar, N and biochar×N) were included was the starting point:
yi jbr=β0+β1chari+β2Nj+β3chari·Nj+β4char2i +β5Nj2+cb+dr+ei jbr (4) 25
inter-SED
6, 887–917, 2014Biochar increases plant available water
M. T. de Melo Carvalho et al.
Title Page
Abstract Introduction
Conclusions References
Tables Figures
◭ ◮
◭ ◮
Back Close
Full Screen / Esc
Printer-friendly Version Interactive Discussion
Discussion
P
a
per
|
D
iscussion
P
a
per
|
Discussion
P
a
per
|
Discuss
ion
P
a
per
|
cept;β1 and β2 are linear effects of biochar and N, respectively;β3 is the interaction effect biochar×N; β4 and β5 are quadratic effects of biochar and N, respectively; cb anddr∼N (0,Σ) are the potential random effects related to location of a plot in a block
b(b=1, 2, 3, 4) and in a rowr (r =1, 2, 3, 4) within a blockb; andei jbr∼N (0,σ2) is the random error associated to each observationyi jbr.
5
Again, we adopted 0.10 as the appropriateplevel in the process of predictors’ selec-tion. To determine the appropriate response surface, predictors containing the highest
pvalue (p >0.10) were progressively excluded respecting the hierarchy of effects: lin-ear terms were retained whenever interaction or quadratic terms were significant (Mac-Cullagh and Nelder, 1983). The magnitude and evidence of the effects was assessed 10
by estimates and their respective nominal significance levels.
3 Results
3.1 The use of NLM to adjust SWRCs and effects of biochar rate on
shape parameters
Overall, the goodness of fit was high (R2: 0.77 to 0.98), indicating the adequacy of 15
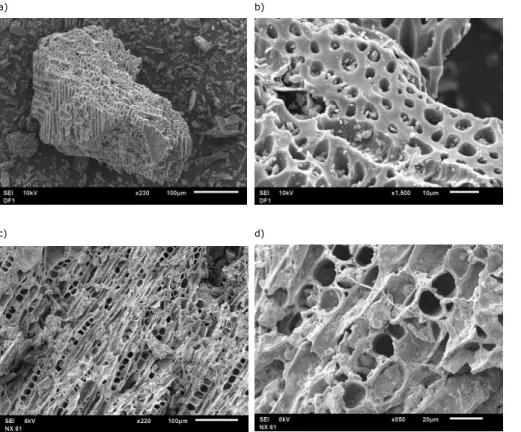
the proposed nonlinear mixed (NLM) model to estimate the shape parameters of the SWRCs (Table 1). Inclusion of the random effectusignificantly increased the accuracy of the SWRC modelling (Fig. 3). The consistent SWRC underestimation at high matric potential was likely due to increases in soil moisture content with biochar application, which was particularly evident from SWRCs for treatments with 8 and 32 t ha−1 in the 20
upper and lower soil layers in S2.
The evidence of the effects of biochar on shape parameters can be seen through changes in patterns of the SWRCs. At 2 years after biochar application in both soil layers for the treatment with 8 t ha−1 the shape parametersα andnwere significantly lower and higher than control, respectively (Table 1). Also in S2, in the upper layer 25
SED
6, 887–917, 2014Biochar increases plant available water
M. T. de Melo Carvalho et al.
Title Page
Abstract Introduction
Conclusions References
Tables Figures
◭ ◮
◭ ◮
Back Close
Full Screen / Esc
Printer-friendly Version Interactive Discussion
Discussion
P
a
per
|
D
iscussion
P
a
per
|
Discussion
P
a
per
|
Discuss
ion
P
a
per
|
the control. The SWRCs in the upper layer for the treatment with 8 and 32 t ha−1were above that of the control treatment at matric potentials between−0.03 kPa and−33 kPa (Fig. 4). In S2, the most significant difference (p≤0.05) was for the parameternof the treatment with 8 t ha−1 in the lower soil layer 15–20 cm. The SWRC in the lower layer for the treatment with 8 t ha−1 was above that of control at matric potentials between 5
−1 and−10 kPa.
In S3, no significant effects of biochar amendment on shape parameters were ob-served. In the upper layer, the SWRCs of the treatments with biochar amendment were all above the SWRC of the control treatment at matric potentials higher than
−1 kPa, whereas at matric potentials lower than −10 kPa, the soil moisture content 10
dropped abruptly to below that of the control treatment. This was particularly evident with 32 t ha−1. In S3, in the lower soil layer, the same pattern was observed, but in this layer soil moisture content for treatments with biochar dropped under matric potential lower than−6 kPa, except for the SWRC of the highest biochar treatment (32 t ha−1), which was now slightly below that of the control treatment already under matric poten-15
tial higher than−1 kPa.
3.2 Response of soil physical-hydric variables to biochar application rate
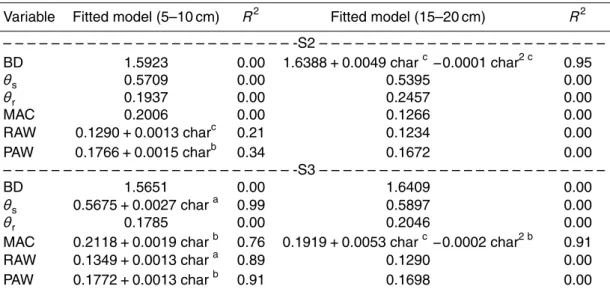
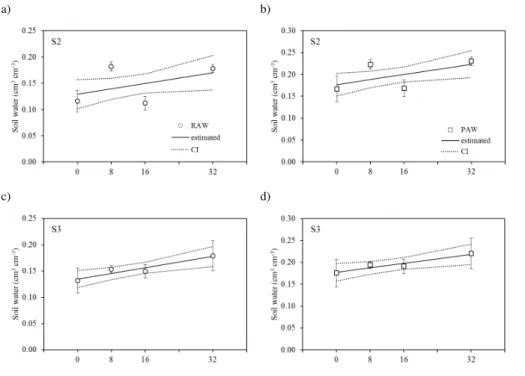
Most significant responses to biochar application rate were observed in the upper soil layer (5–10 cm), with minor responses in the lower soil layer (15–20 cm; Table 2). In the upper layer, RAW and PAW increased linearly with biochar application rate. The 20
increment in RAW and PAW was with around 1 and 0.8 % for each t ha−1 of biochar applied or 21 and 17 % with 1 %w/w rate of biochar amendment, respectively. The response of RAW and PAW to biochar rate was stronger in S3 (p≤0.05) than in S2 (p≤0.10), with narrower confidence intervals in S3 (Fig. 5).
In S2 in the lower layer only BD was significantly affected by biochar application. The 25
SED
6, 887–917, 2014Biochar increases plant available water
M. T. de Melo Carvalho et al.
Title Page
Abstract Introduction
Conclusions References
Tables Figures
◭ ◮
◭ ◮
Back Close
Full Screen / Esc
Printer-friendly Version Interactive Discussion
Discussion
P
a
per
|
D
iscussion
P
a
per
|
Discussion
P
a
per
|
Discuss
ion
P
a
per
|
in the upper layer, saturated soil moisture (θs) and MAC increased linearly (p≤0.05) with 0.5 and 1.6 % for each t ha−1of biochar applied, respectively; whereas in the lower layer only MAC was significantly affected by biochar application. The response of MAC to biochar rate in the lower layer followed a quadratic pattern with maximum at 16 t ha−1 (0.2299±0.0152) and minimum at 32 t ha−1(0.1744±0.0184).
5
3.3 Response of rice yields and yield components to biochar and N application
rate
There was no response of rice yields to biochar application rate in either season (Ta-ble 3). In S2, total shoot dry matter (TDM) and grain yield (GY) were not affected by biochar or N application rate. Both TDM and GY varied greatly, from 0.57 and 10
0.17 t ha−1 (with 32 t ha−1 and without N) to 4.04 and 1.99 t ha−1 (with 32 t ha−1 and 90 kg N ha−1), respectively. Most significant (p≤0.05) effects of biochar were observed on number of grains panicle−1(GP) and grain filling index (GFI). The response of GP and GFI to biochar rate followed a quadratic pattern with a minimum obtained at about 16 t ha−1. The response of harvest index (HI) and number of panicles m−2 (PAN) to 15
N rate followed a quadratic pattern with a maximum at around 30 to 60 kg N ha−1. The estimated HI (mean±standard error) varied from a minimum at 0.42±0.02 (with 90 kg N ha−1) to a maximum at 0.53±0.02 (with 30 kg N ha−1) and PAN from 109±7 (without N) to 133±5 (with 60 kg N ha−1). The GFI and 1000-grain weight (GW) de-creased with increasing N rate.
20
A year later, in S3, the effect of biochar on any characteristic measured at crop ma-turity of rice was totally absent. The response of TDM and PAN to N rate followed a quadratic pattern with a maximum at 30 to 60 kg N ha−1, whereas GY and GFI in-creased linearly with increasing N rate. Estimated GY inin-creased from 0.49±0.2 t ha−1 (without N) to 0.69±0.2 t ha−1 (90 kg N ha−1), regardless of biochar application (Ta-25
SED
6, 887–917, 2014Biochar increases plant available water
M. T. de Melo Carvalho et al.
Title Page
Abstract Introduction
Conclusions References
Tables Figures
◭ ◮
◭ ◮
Back Close
Full Screen / Esc
Printer-friendly Version Interactive Discussion
Discussion
P
a
per
|
D
iscussion
P
a
per
|
Discussion
P
a
per
|
Discuss
ion
P
a
per
|
seasons were rather low, mainly due to weeds infestation. Chemical and mechanical controls were applied when necessary, but these could not sufficiently compensate for the low resistance of the cultivar BRS Primavera to biotic stresses.
4 Discussion
Here we summarize and discuss the main findings of this study as follows: (i) the 5
impact of the wood biochar application rate on WRC of the sandy Dystric Plinthosol is positive and persistent at 2 and 3 years after application; (ii) although soil WRC increases with biochar application rate, we did not observe any impact on rice yield; and (iii) the proposed nonlinear mixed (NLM) model was an innovative analytical tool for such a large field trial.
10
Our results showed that in both seasons PAW and RAW in the upper 5–10 cm layer of the sandy soil increased proportionally to biochar application rate with about 0.8 and 1 % for each t ha−1 of biochar applied, respectively (Fig. 5). The consistent increase in soil WRC seems to be related to a slight increase in soil moisture at −6 kPa for the treatment with 32 t ha−1, as can be observed by means of SWRCs in S2 and S3 15
(Fig. 4), with a significant effect on the shape parameterαin S2 (Table 1). In S2 we also observed significant changes in shape parameters of the SWRC with 8 t ha−1(Table 1). However, there was no such effect for the treatment with 16 t ha−1, where the increase in soil WRC seems to be a consequence of a decrease in soil moisture content with biochar rate up to 16 t ha−1at matric potentials of −100 kPa (p≤0.13) and−1500 kPa 20
(p≤0.16) in S2. The uncertainty of the linear response of PAW and RAW to biochar rate was higher in S2 than in S3, predominantly for rates of 8 and 16 t ha−1(Fig. 5). The uncertainty can be related to changes in BD affecting the overall response to biochar application. In fact, BD was generally 1.7 % higher in S2 than in S3 (Table 2), which was a consequence of mechanical weeding using a tractor which passed twice over all 25
SED
6, 887–917, 2014Biochar increases plant available water
M. T. de Melo Carvalho et al.
Title Page
Abstract Introduction
Conclusions References
Tables Figures
◭ ◮
◭ ◮
Back Close
Full Screen / Esc
Printer-friendly Version Interactive Discussion
Discussion
P
a
per
|
D
iscussion
P
a
per
|
Discussion
P
a
per
|
Discuss
ion
P
a
per
|
biochar rate on BD in the upper soil layer, in the lower soil layer 15–20 cm BD increased with biochar rate up to 16 t ha−1.
At matric potentials lower than −8 kPa the amount of water in soils treated with biochar decreased abruptly in both years while in S3 in the upper soil layerθsand MAC increased significantly with increasing biochar rate (Table 2). It seems that biochar ap-5
plication lead to an increase in soil moisture at a matric potential up to around −6 and−8 kPa that was not necessarily sustained under lower matric potentials (Fig. 4). Therefore, the effect of biochar on soil WRC is most likely a consequence of an in-crease in overall porosity of the soil. We found a notable inin-crease in MAC of 51 % with 1.5 %w/wbiochar amendment. The increase in MAC with biochar application rate was 10
mostly related to the large particle size (≤2000 µm) of the biochar tested. For instance, Abel et al. (2013) reported an increase of 15 % in total porosity and 6 % in air capacity with application of 5 %w/w beech wood biochar (particle sized<5000 µm) that lead to a 35 % increase in PAW in a loamy sand soil. According to the van Genuchten model described by Ibrahim et al. (2013), there was an 8 % increase in PAW with application 15
of 1.5 %w/w very fine particle sized biochar (44–149 µm) in a sandy loam soil. Addi-tionally, the SWRCs that they modelled indicate a greater impact on soil WRC at low matric potentials. However, application of fine particle size material under field condi-tions is difficult since it is easily moved by wind. Combination of biochar with liquid or solid fertilisers could be an option to avoid such kind of losses and capture the potential 20
positive effect of biochar on soil WRC. Liu et al. (2012), for example, observed that ap-plication of 20 t ha−1of biochar with 50 t ha−1of organic compost has a more prominent positive effect on water availability than application of pure compost.
The biochar we applied in the field trial is a by-product of slow pyrolysis (under ∼
450◦C) of eucalyptus wood, which resulted in a material with an intrinsic porosity ≤
25
SED
6, 887–917, 2014Biochar increases plant available water
M. T. de Melo Carvalho et al.
Title Page
Abstract Introduction
Conclusions References
Tables Figures
◭ ◮
◭ ◮
Back Close
Full Screen / Esc
Printer-friendly Version Interactive Discussion
Discussion
P
a
per
|
D
iscussion
P
a
per
|
Discussion
P
a
per
|
Discuss
ion
P
a
per
|
127 %, respectively, with application of 1.8 %w/wbiochar (SSA 273 m2g−1) artificially packed with a sandy soil. Logically a higher SSA biochar has more and finer pores and therefore a greater effect on soil WRC, as demonstrated by Lei and Zhang (2013). They observed a tremendous increase in soil water content between−33 and−1500 kPa in a sandy loam soil treated with 5 %w/w woodchip biochar pyrolysized at 300, 500 and 5
700◦C (SSA 24, 67 and 124 m2g−1) of 39, 51 and 55 %, respectively. We found a rise of 6, 13 and 26 % in PAW, accompanied by a 4, 8 and 16 % increase inθswith 0.4, 0.7, and 1.5 %w/w biochar, respectively (Table 2). Relatively, the increase in θs is much higher than the 0.2 % increase with 1 %w/w biochar observed by Abel et al. (2013). The rise in PAW that we found, though, is lower than the 28 % rise observed by Abel 10
et al. (2013), and higher than the 6 % rise found by Ibrahim et al. (2013) with 1 %w/w
biochar. Apart from differences in time after application and conditions of experimental setup, SSA of the biochar used is probably the main cause for these discrepancies. However, neither Abel et al. (2013) nor Ibrahim et al. (2013) determined the SSA of the biochar they used. High resolution images indicate that there are differences in the pore 15
structure of the beech wood biochar used by Abel et al. (2013) and the one used in our study (Fig. 2). The SSA of the biochar we used is similar to the birch wood biochar (particle sized <10 000 µm) used by Karhu et al. (2011) but lower than the SSA of the eucalyptus biochar produced at 450◦C (milled to powder) described by Borneman et al. (2007). Karhu et al. (2011) observed an effect in gravimetric soil moisture at 0 kPa 20
relatively higher than the effect we observed on volumetric soil moisture at 0 kPa (θs) with application of 0.3 %w/w biochar.
Beyond the influence that both SSA and particle size of biochar have per se on the soil WRC of a sandy soil, we must also consider the application rate. The maximum rate applied in our study was of 1.5 % w/w, which is half of the minimum rate (3 % 25
SED
6, 887–917, 2014Biochar increases plant available water
M. T. de Melo Carvalho et al.
Title Page
Abstract Introduction
Conclusions References
Tables Figures
◭ ◮
◭ ◮
Back Close
Full Screen / Esc
Printer-friendly Version Interactive Discussion
Discussion
P
a
per
|
D
iscussion
P
a
per
|
Discussion
P
a
per
|
Discuss
ion
P
a
per
|
6 %w/w fast pyrolysis red oak biochar, respectively. Feasibility of application of such high rates in agricultural fields should be assessed regionally. The highest rate applied in our study is already pushing the limits for practical applications. For example, ac-cording to Filiberto and Gaunt (2013), assuming yield increase and fertiliser savings, the costs for application of 25 t ha−1biochar rate in agricultural fields may not be eco-5
nomically feasible under current US$ circumstances. Besides the differences in the rate of biochar used, studies are frequently conducted under artificially controlled con-ditions and did not evaluate the effect on plant biomass. One of the exceptions is Asai et al. (2009), who tested the effect of a wood residue biochar on saturated hydraulic conductivity accompanied by measurements on rice yield. They found an increase in 10
saturated hydraulic conductivity with application of 16 t ha−1biochar in the 0–5 cm sur-face of a silt loam soil, but no effect on rice yield.
According to a meta-analysis done by Jeffery et al. (2011) biochar application gen-erally leads to a 10 % increase in crop yields, although causes are poorly quantified and effects differ between crops. We observed no response of rice GY to biochar ap-15
plication rate during both seasons under assessment (Table 3). Yet, in S2, GFI and GP, which are yield components strongly sensitive to water stress (Fageria, 2001), in-creased with biochar rate higher than 16 t ha−1. In rain fed systems soil matric potential can drop below −100 kPa any time during the growing season. The associated wa-ter stress leads to a reduction in overall wawa-ter use efficiency by rice (Wopereis et al., 20
1996). Therefore, we defined a rice stress free available water content as the soil mois-ture content between−6 and−100 kPa (RAW). We observed an increase of 32 % in RAW with the addition of 32 t ha−1, which is equivalent to 17 to 18 mm in the upper 5–10 cm layer of the sandy soil. This additional amount of water would be sufficient to satisfy the crop demand for approximately 4 additional days without rainfall, considering 25
SED
6, 887–917, 2014Biochar increases plant available water
M. T. de Melo Carvalho et al.
Title Page
Abstract Introduction
Conclusions References
Tables Figures
◭ ◮
◭ ◮
Back Close
Full Screen / Esc
Printer-friendly Version Interactive Discussion
Discussion
P
a
per
|
D
iscussion
P
a
per
|
Discussion
P
a
per
|
Discuss
ion
P
a
per
|
January/February 2012 (S3), the amount of rainfall was high (∼650 mm) and twice the amount during the critical period in previous seasons, in February/March 2009 and Jan-uary/February 2010 (Fig. 1). If there is a positive effect of biochar on RAW of a sandy soil, the effect on rice GY would be a consequence of lower precipitation rate, such as in the first seasons of the trial reported by Petter et al. (2012). Throughout the latest 5
32 years (from 1979 to 2013) average precipitation rate during the months of January and February in the municipality where the field trial is located was 507 mm and the frequency of an amount of rainfall lower than 650 mm was 81 % (Agritempo, 2014). In other words, in this region of Brazil’s tropical savannah, rainfall during the critical pe-riod for rice production is frequently lower than 650 mm. This means that application of 10
biochar could be sound agronomic practice that could reduce water stress and improve yield stability.
Finally, we have demonstrated that NLM can be used as an innovative analytical tool to model SWRC and compare the shape parametersα andnvia formal tests. By using a NLM model, we were able to account for the random effect of latent variables 15
related to measurements taken in the same sample unit within a specific location (plot), leading to a reduction in the uncertainty of estimation of the SWRCs (Fig. 3). By using the SAS program, results of model fitting were generated by year and soil layer in one run, facilitating the management of the large data set.
5 Conclusions
20
We found a consistent increase in plant available water and rice available water in the upper soil layer with around 0.8 % and 1 % for each t ha−1 of biochar amendment, re-spectively, at 2 and 3 years after application. The impact on water retention capacity of the sandy soil is mostly related to an increment in overall porosity of the soil matrix and did not result in increased rice yield, most likely because rainfall during critical period 25
SED
6, 887–917, 2014Biochar increases plant available water
M. T. de Melo Carvalho et al.
Title Page
Abstract Introduction
Conclusions References
Tables Figures
◭ ◮
◭ ◮
Back Close
Full Screen / Esc
Printer-friendly Version Interactive Discussion
Discussion
P
a
per
|
D
iscussion
P
a
per
|
Discussion
P
a
per
|
Discuss
ion
P
a
per
|
findings call for longer term field trials with feasible amounts of biochar application, which are usually lower than those applied in artificially controlled studies. In addition, detailed analyses of all biochar properties should become a standard procedure in order to better target its use as a soil amendment; different sources and methods of creating biochar can lead to very different char properties. Important properties to be 5
reported are specific surface area and particle size. Expression of the rate of biochar on a dry mass basis can also facilitate comparison of findings. In addition to our main findings, we also demonstrated the utility and adequacy of the nonlinear mixed mod-elling to make statistical inferences on SWRCs by accounting for spatial variability and expected dependencies arising from measurements taken in the same sample unit 10
within a specific plot in the field trial.
Acknowledgements. This study was funded by the Brazilian Agricultural Research Corporation
(EMBRAPA, project n◦ 03.10.01.009). We thank Embrapa Rice and Beans’ staff for support
provided during data collection and analysis and José A. A. Moreira, João Carlos Medeiros and Willem Hoogmoed for enlightening discussions about SWRCs. We also acknowledge CNPq for 15
providing PQ Fellowship and the Departments of Physics and Chemistry at Federal University of Goiás (UFG) where SEM images and BET analysis of biochar were made. We are grateful to the farmers Carlos A. Petter and Marino Petter for their support for the establishment of the field trial on their Estrela do Sul farm. We also thank Ben Hur Marimon Junior for providing facilities at University of Mato Grosso (Unemat, Campus Nova Xavantina) and Diogo Machado, Laissa 20
Gonçalves, Leidimar de Morais and Fabrício Andrade who were involved in the maintenance of the field trial.
References
Abel, S., Peters, A., Trinks, S., Schonsky, H., Facklam, M., and Wessolek, G.: Impact of biochar and hydrochar addition on water retention and water repellency of sandy soil, Geoderma, 25
202–203, 183–191, 2013.
SED
6, 887–917, 2014Biochar increases plant available water
M. T. de Melo Carvalho et al.
Title Page
Abstract Introduction
Conclusions References
Tables Figures
◭ ◮
◭ ◮
Back Close
Full Screen / Esc
Printer-friendly Version Interactive Discussion
Discussion
P
a
per
|
D
iscussion
P
a
per
|
Discussion
P
a
per
|
Discuss
ion
P
a
per
|
Agritempo: The Brazilian System for Meteorological Monitoring, Embrapa Informática Agropecuária, available at: http://www.agritempo.gov.br/index.php, 2014.
Asai, H., Samson, B. K., Stephan, H. M., Songyikhangsuthor, K., Homma, K., Kiyono, Y., In-oue, Y., Shiraiwa, T., and Horie, T.: Biochar amendment techniques for upland rice production in Northern Laos 1. Soil physical properties, leaf SPAD and grain yield, Field Crop Res., 111, 5
8–84, 2009.
Assad, E. and Pinto, H. S.: Global Warming and the Future Scenarios Brazilian Agriculture, Uni-camp/Embrapa, available in Portuguese at: http://www.agritempo.gov.br/climaeagricultura/ download.html, 84 pp., 2008.
Basso, A. S., Miguez, F. E., Laird, D. A., Horton, R., and Westgate, M.: Assessing potential of 10
biochar for increasing water-holding capacity of sandy soils, Global Change Biology Bioen-ergy, 5, 132–143, 2013.
Bornemann, L. C., Kookana, R. S., and Welp, G.: Differential sorption behaviour of aromatic
hy-drocarbons on charcoals prepared at different temperatures from grass and wood,
Chemo-sphere, 67, 1033–1042, 2007. 15
Brunauer, S., Emmet, P. H., and Teller, E.: Adsorption of gases in multimolecular layers, The Bureau of Chemistry and Soils and George Washington University, 60, 309–319, 1938. Dempster, D. N., Jones, D. L., and Murphy, D. V.: Clay and biochar amendments decreased
inorganic bout not dissolved organic nitrogen leaching in soil, Soil Res., 50, 216–221, 2012. Dourado-Neto, D., Nielsen, D. R., Hopmans, J. W., Reichardt, K., and Bacchi, O. O. S.: Software 20
to model soil water retention curves (SWRC, version 2.00), Sci. Agr., 57, 191–192, 2000. EMBRAPA, Brazilian Agricultural Research Corporation: Manual de Métodos de Análise de
Solo, Embrapa Solos, Documentos 1, 212 pp., 1997.
EMBRAPA, Brazilian Agricultural Research Corporation: Informações Técnicas Sobre o Arroz de Terras Altas, Estados de Mato Grosso e Rondônia, Safra 2007/2008, Embrapa Arroz e 25
Feijão, Documentos 212, 84 pp., 2007.
Fageria, N. K.: Nutrient management for improving upland rice productivity and sustainability, Commun. Soil Sci. Plan., 32, 2603–2629, 2001.
Filiberto, D. M. and Gaunt, J. L.: Practicality of biochar additions to enhance soil and crop productivity, Agriculture, 3, 715–725, 2013.
30
SED
6, 887–917, 2014Biochar increases plant available water
M. T. de Melo Carvalho et al.
Title Page
Abstract Introduction
Conclusions References
Tables Figures
◭ ◮
◭ ◮
Back Close
Full Screen / Esc
Printer-friendly Version Interactive Discussion
Discussion
P
a
per
|
D
iscussion
P
a
per
|
Discussion
P
a
per
|
Discuss
ion
P
a
per
|
Glaser, B., Lehmann, J., and Zech, W.: Ameliorating physical and chemical properties of highly weathered soils in the tropics with charcoal – a review, Biol. Fert. Soils, 35, 219–230, 2002. IBGE, The Brazilian Institute of Geography and Statistics: Systematic Survey of Agricultural
Production, available at: http://www.ibge.gov.br/ (last access: 15 July 2013), 2012.
Ibrahim, H. M., Al-Wabel, M. I., Usman, A. R. A., and Al-Omran, A.: Effect of Conocarpus
5
biochar application on the hydraulic properties of a sandy loam soil, Soil Sci., 178, 165–173, 2013.
Jeffery, S., Verheijen, F. G. A., Van Der Velde, M., and Bastos, A. C.: A quantitative review of the effects of biochar application to soils on crop productivity using meta-analysis, Agr. Ecosyst. Environ., 144, 175–187, 2011.
10
Karhu, K., Mattila, T., Bergström, I., and Regina, K.: Biochar addition to agricultural soil in-creased CH4 uptake and water holding capacity – results from short-term pilot field study,
Agr. Ecosyst. Environ., 140, 309–313, 2011.
Kookana, R. S., Sarmah, A. K., Van Zwieten, L., Krull, E., and Singh, B.: Biochar application to soil: agronomic and environmental benefits and unintended consequences, Adv. Agron., 15
112, 103–143, 2011.
Lei, O. and Zhang, R.: Effects of biochars derived from different feedstocks and pyrolysis tem-peratures on soil physical and hydraulic properties, J. Soils Sediments, 13, 1561–1572, 2013.
Liu, J., Schulz, H., Brandl, S., Miehtke, H., Huwe, B., and Glaser, B.: Short-term effect of biochar 20
and compost on soil fertility and water status of a Dystric Cambisol in NE Germany under field conditions, J. Plant Nutr. Soil Sc., 175, 698–707, 2012.
MacCullagh, P. and Nelder, J. A.: Models for continuous data with constant variance, Chapt. 3, in: Generalized Linear Models, edited by: McCullagh, P. and Nelder, J. A., Chapman and Hall, New York, 35–71, 1983.
25
Mualem, Y.: A new model for predicting the hydraulic conductivity of unsaturated porous media, Water Resour. Res. (Washington), 12, 513–522, 1976.
Omuto, T. C., Minasny, B., McBratney, A. B., and Biamah, E. K.: Nonlinear mixed effect mod-elling for improved estimation of water retention and infiltration parameters, J. Hydrol., 330, 748–758, 2006.
30
SED
6, 887–917, 2014Biochar increases plant available water
M. T. de Melo Carvalho et al.
Title Page
Abstract Introduction
Conclusions References
Tables Figures
◭ ◮
◭ ◮
Back Close
Full Screen / Esc
Printer-friendly Version Interactive Discussion
Discussion
P
a
per
|
D
iscussion
P
a
per
|
Discussion
P
a
per
|
Discuss
ion
P
a
per
|
Pereira, R. G., Heinemann, A. B., Madari, B. E., Carvalho, M. T. M., Kliemann, H. J., and dos Santos, A. P.: Transpiration response of upland rice to water deficit changed by different levels of eucalyptus biochar, Pesqui. Agropecu. Bras., 47, 716–721, 2012.
Petter, F. A., Madari, B. E., Silva, M. A. S., Carneiro, M. A. C., Carvalho, M. T. M., Marimon Jr., B. H., and Pacheco, L. P.: Soil fertility and upland rice yield after biochar application in 5
the Cerrado, Pesqui. Agropecu. Bras., 47, 699–706, 2012.
SAS Institute Inc.: SAS Version 9.2©2002–2008, Cary, NC, USA, 2008.
Stone, L. F. and Moreira, J. A. A.: Irrigação do Arroz de Terras Altas em Função da Porcentagem de Cobertura do Solo Pela Palhada no Sistema Plantio Direto, Circular Técnica 69, Embrapa Arroz e Feijão, 2005.
10
Tryon, E. H.: Effect of charcoal on certain physical, chemical and biological properties of forest soils, Ecological Society of America, 18, 81–115, 1948.
Van Genuchten, M. Th.: A closed-form equation for predicting the hydraulic conductivity of unsaturated soils, Soil Sci. Soc. Am. J. (Madison), 44, 892–898, 1980.
Wopereis, M. C. S., Kropff, M. J., Maligaya, A. R., and Tuong, T. P.: Drought-stress responses 15
SED
6, 887–917, 2014Biochar increases plant available water
M. T. de Melo Carvalho et al.
Title Page
Abstract Introduction
Conclusions References
Tables Figures
◭ ◮
◭ ◮
Back Close
Full Screen / Esc
Printer-friendly Version Interactive Discussion
Discussion
P
a
per
|
D
iscussion
P
a
per
|
Discussion
P
a
per
|
Discuss
ion
P
a
per
|
Table 1.Estimates of shape parameters of the Van Genutchen model fitted to represent soil
water retention within 5–10 cm and 15–20 cm layers at two (S2) and three (S3) years after application of 8, 16 and 32 t ha−1biochar into a sandy Dystric Plinthosol.
Treatment Parameter estimates (5–10 cm) R2 Parameter estimates (15–20 cm) R2
– – – –α– – – – – – n – – – - – – – –α– – – - – – – n – – –
– – – – – – – – – – – – – – – – – – – – – –S2 – – – – – – – – – – – – – – – – – – – – – –
control 0.1110 (0.0533) 1.578 (0.093) 0.94 0.0344 (0.0147) 1.656 (0.088) 0.94
8 0.0154b(0.0052) 1.882b(0.110) 0.83 0.0061b(0.0023) 1.951a(0.103) 0.83
16 0.1443 (0.0725) 1.533 (0.088) 0.95 0.0760 (0.0371) 1.513 (0.075) 0.89
32 0.0166b(0.0056) 1.794 (0.089) 0.77 0.0131 (0.0055) 1.741 (0.087) 0.82
– – – – – – – – – – – – – – – – – – – – – – S3 – – – – – – – – – – – – – – – – – – – – – –
control 0.0651 (0.0168) 1.677 (0.071) 0.97 0.0661 (0.0175) 1.653 (0.065) 0.97
8 0.0723 (0.0150) 1.738 (0.081) 0.95 0.0895 (0.0196) 1.678 (0.067) 0.97
16 0.0969 (0.0204) 1.707 (0.074) 0.98 0.1049 (0.0253) 1.675 (0.075) 0.96
32 0.0622 (0.0110) 1.781 (0.078) 0.97 0.0410 (0.0113) 1.636 (0.052) 0.94
SED
6, 887–917, 2014Biochar increases plant available water
M. T. de Melo Carvalho et al.
Title Page
Abstract Introduction
Conclusions References
Tables Figures
◭ ◮
◭ ◮
Back Close
Full Screen / Esc
Printer-friendly Version Interactive Discussion
Discussion
P
a
per
|
D
iscussion
P
a
per
|
Discussion
P
a
per
|
Discuss
ion
P
a
per
|
Table 2.Response of key physical hydric variables to biochar rate (char) at two (S2) and three
(S3) years after application in a sandy Dystric Plinthosol soil.
Variable Fitted model (5–10 cm) R2 Fitted model (15–20 cm) R2
– – – – – – – – – – – – – – – – – – – – – – – – -S2 – – – – – – – – – – – – – – – – – – – – – – – –
BD 1.5923 0.00 1.6388+0.0049 charc−0.0001 char2 c 0.95
θs 0.5709 0.00 0.5395 0.00
θr 0.1937 0.00 0.2457 0.00
MAC 0.2006 0.00 0.1266 0.00
RAW 0.1290+0.0013 charc 0.21 0.1234 0.00
PAW 0.1766+0.0015 charb 0.34 0.1672 0.00
– – – – – – – – – – – – – – – – – – – – – – – – -S3 – – – – – – – – – – – – – – – – – – – – – – – –
BD 1.5651 0.00 1.6409 0.00
θs 0.5675+0.0027 char
a
0.99 0.5897 0.00
θr 0.1785 0.00 0.2046 0.00
MAC 0.2118+0.0019 charb 0.76 0.1919+0.0053 charc−0.0002 char2 b 0.91
RAW 0.1349+0.0013 chara 0.89 0.1290 0.00
PAW 0.1772+0.0013 charb 0.91 0.1698 0.00
SED
6, 887–917, 2014Biochar increases plant available water
M. T. de Melo Carvalho et al.
Title Page
Abstract Introduction
Conclusions References
Tables Figures
◭ ◮
◭ ◮
Back Close
Full Screen / Esc
Printer-friendly Version Interactive Discussion
Discussion
P
a
per
|
D
iscussion
P
a
per
|
Discussion
P
a
per
|
Discuss
ion
P
a
per
|
Table 3. Response surfaces representing the effect of biochar (char) and N-fertilisation (N)
rates on total shoot dry matter (TDM, t ha−1), grain yield (GY, t ha−1), harvest index (HI) and yield components of aerobic rice at two (S2) and three (S3) years after application in a sandy Dystric Plinthosol.
Variable Fitted model R2
– – – – – – – – – – – – – – – – S2 – – – – – – – – – – – – – – –
TDM 2.10 0.00
GY 1.15 0.00
HI 0.51+0.00172 Nb−0.00003 N2 a 0.53
PAN 109+0.9824 Na−0.0095 N2 b 0.27
GP 91−1.62735 charb+0.04248 char2 c 0.18
GFI 0.81−0.0049 charb−0.00066 Na+0.00014 char2 b 0.50
GW 25.56−0.03206 Na 0.32
– – – – – – – – – – – – – – – – -S3 – – – – – – – – – – – – – – –
TDM 2.22+0.0432 Na−0.00044 N2 a 0.62
GY 0.49+0.002156 Nc 0.20
HI 0.18 0.00
PAN 146+0.8117 Nb−0.01292 N2 a 0.56
GP 132 0.00
GFI 0.47+0.00155 Na 0.32
GW 24.99–0.00961 Nc 0.19
SED
6, 887–917, 2014Biochar increases plant available water
M. T. de Melo Carvalho et al.
Title Page
Abstract Introduction
Conclusions References
Tables Figures
◭ ◮
◭ ◮
Back Close
Full Screen / Esc
Printer-friendly Version Interactive Discussion
Discussion
P
a
per
|
D
iscussion
P
a
per
|
Discussion
P
a
per
|
Discuss
ion
P
a
per
|
Fig. 1.Monthly precipitation (rain) and average of maxima (T max) and minima (T min)
SED
6, 887–917, 2014Biochar increases plant available water
M. T. de Melo Carvalho et al.
Title Page
Abstract Introduction
Conclusions References
Tables Figures
◭ ◮
◭ ◮
Back Close
Full Screen / Esc
Printer-friendly Version Interactive Discussion
Discussion
P
a
per
|
D
iscussion
P
a
per
|
Discussion
P
a
per
|
Discuss
ion
P
a
per
|
a) b)
c) d)
High resolution images of Eucalyptus wood biochar (particle sized ≤ 2000 μm) before
Fig. 2.High resolution images of Eucalyptus wood biochar (particle size ≤2000 µm) before
SED
6, 887–917, 2014Biochar increases plant available water
M. T. de Melo Carvalho et al.
Title Page
Abstract Introduction
Conclusions References
Tables Figures
◭ ◮
◭ ◮
Back Close
Full Screen / Esc
Printer-friendly Version Interactive Discussion
Discussion
P
a
per
|
D
iscussion
P
a
per
|
Discussion
P
a
per
|
Discuss
ion
P
a
per
|
a) b)
c) d)
pac
Fig. 3.Goodness of fit of the nonlinear mixed model used to predict soil water retention capacity,
summarized via correlation coefficient (R2) and root of mean square error (RMSE). Agreement
between measured and predicted moisture values(a, c); agreement between measured and
SED
6, 887–917, 2014Biochar increases plant available water
M. T. de Melo Carvalho et al.
Title Page
Abstract Introduction
Conclusions References
Tables Figures
◭ ◮
◭ ◮
Back Close
Full Screen / Esc
Printer-friendly Version Interactive Discussion
Discussion
P
a
per
|
D
iscussion
P
a
per
|
Discussion
P
a
per
|
Discuss
ion
P
a
per
|
a) b)
Soil
m
o
is
tur
e (
cm
3 cm -3)
c) d)
Log |k| (kPa)
Fig. 4.Predicted (lines) soil water retention curves and measured soil moisture (symbols) at
SED
6, 887–917, 2014Biochar increases plant available water
M. T. de Melo Carvalho et al.
Title Page
Abstract Introduction
Conclusions References
Tables Figures
◭ ◮
◭ ◮
Back Close
Full Screen / Esc
Printer-friendly Version Interactive Discussion
Discussion
P
a
per
|
D
iscussion
P
a
per
|
Discussion
P
a
per
|
Discuss
ion
P
a
per
|
a) b)
c) d)
Rate of biochar (t ha-1)
Rice available water (○RAW: ˆˆ ) and plant available water (□PAW: ˆˆ
– –
Fig. 5.Rice available water (RAW: ˆθ6−θˆ100) and plant available water (PAW: ˆθ6– ˆθ1500)
in the upper 5–10 cm layer of a sandy Dystric Plinthosol at two (S2 –a,b) and three (S3 –
c,d) years after application of biochar rate (0, 8, 16 and 32 t ha−1). Symbols represent means