____________________________________
1 DS, Instituto Federal de Educação Ciência e Tecnologia Baiano, Guanambi - BA, moises.ribeiro@guanambi.ifbaiano.edu.br. 2 Ph.D., Professor Associado, Departamento de Engenharia, Universidade Federal de Lavras, Lavras - MG, acolombo@deg.ufla.br. 3 Ph.D., Professor Associado, Departamento de Engenharia, Universidade Federal de Lavras, Lavras - MG, acolombo@deg.ufla.br. 4 Enga Agrônoma, Rua Alba Gonzaga-108, Unai - MG, ana_cecilia_dmc@hotmail.com.
5 DS, Professor, UNIMONTES - CCET/DCA, Janauba - MG, fabio.faria@unimontes.br.
Recebido pelo Conselho Editorial em: 28-4-2011
SPRAY EMITTER NOZZLES
MOISES S. RIBEIRO1, LUIZ A. LIMA2, ALBERTO COLOMBO3,
ANA C. D. M. CALDEIRA4, FABIO H. DE S. FARIA5
ABSTRACT: The objective of this study was to characterize water application rate, water application pattern width, flow rate, water distribution uniformity and soil loss caused by nozzles of the Low Energy Precision Aplication (LEPA) type Quad-Spray emitter. The study was carried out at the Hydraulic and Irrigation Laboratory of the Department of Engineering at the Federal University of Lavras, in Lavras, state of Minas Gerais - MG, Brazil. Twenty-two (22) LEPA Quad-Spray emitter nozzles were evaluated, with nozzle diameter ranging from 1.59 to 9.92 mm. The experimental design used was entirely randomized, with three replications. Increasing values of nozzle flow rate ranging from 77.44 up to 3,044 L h-1, were obtained with increasing nozzle diameter sizes. Application pattern width ranged from 0.56 up to 3.24m, according to nozzles diameter size. Low values of CDU (maximum of 35.73%) were observed when using the Quad-Spray nozzles. Observed average water application rates covered the range between 68.05 mm h-1 (the lowest value that was obtained with the 2.38mm nozzle) and 258.15 mm h-1 (the highest value that was observed with the 9.92 mm). Average water application rates increased in a simple non-linear function with the increase of nozzle size diameter. However, the weighted average increase in the amount of soil loss by erosion was not related to the increase of weighted average water application values.
KEYWORDS: technical characteristics of the Quad-Spray, resizing of nozzles, erosive impact.
CARACTERÍSTICAS DE DISTRIBUIÇÃO DE ÁGUA E PERDAS DE SOLO DE BOCAIS DO EMISSOR QUAD-SPRAY TIPO LEPA
RESUMO: Foi objetivo deste trabalho caracterizar a taxa de aplicação de água, largura do padrão molhado, vazão, uniformidade de distribuição de água e perdas de solo de bocais do emissor Quad-Spray tipo Low Energy Precision Aplication (LEPA). O trabalho foi realizado no Laboratório de Hidráulica e Irrigação (LHI), do Departamento de Engenharia (DEG), na Universidade Federal de Lavras (UFLA), Lavras - MG. Foram avaliados 22 bocais com diâmetro de bocal variando de 1,59 a 9,92 mm. O delineamento experimental estatístico foi o inteiramente casualizado, com três repetições. Valores crescentes de vazão dos bocais variaram de 77,44 a 3.044 L h-1, com o aumento do diâmetro de bocal. Foram observados valores de largura do padrão de molhamento de 0,56 a 3,24 m, de acordo com o diâmetro dos bocais. Baixos valores de CUD (máximo de 35,73%) foram verificados entre os bocais do Quad-Spray. As taxas médias de aplicação de água foram 68,05 mm h-1 (menor valor) e 258,15 mm h-1 (maior valor), verificadas, respectivamente, para os bocais de 2,38 e 9,92 mm de diâmetro que aumentaram em uma função não linear simples com o aumento do diâmetro do bocal. O aumento da média ponderada de perda de solo por erosão hídrica não está relacionado com o aumento da média ponderada de taxa média de aplicação de água.
INTRODUCTION
When considering the 62 major permanent and temporary crops, the irrigated area in Brazil represents 5.89% (3,440,470 ha) of cropland and accounts for 16% of the production. From this irrigated area, 21% is occupied by center pivot, which represents 18% (710,000 ha) of the area irrigated by center pivot in the world. In Brazil, only the states of São Paulo, Goiás, Minas Gerais and Bahia account for over 80% of the area irrigated by center pivot, and approximately 800 units are commercialized each year (CARVALHO & SILVA, 2007).
The center pivot equipment is a device that has been widely sold in the country. The use of LEPA (Low Energy Precision Application) emitters is making it more competitive against other irrigation system. The LEPA concept of irrigation arose from the basic idea of developing a water application system that could reduce energy requirements and allow a more accurate application of irrigation water (TOMAZELA et al., 2003).
Currently, the use of LEPA for coffee irrigation on areas with circular planting has progressively increased. Its use has expanded to regions with low rainfall amounts and with higher risks of extended periods of drought, as the Triângulo Mineiro, Northern and Alto Parnaíba regions in the state of Minas Gerais, Northern of the state of Espírito Santo and Southern and Western regions of the state of Bahia (TOMAZELA et al., 2003).
Despite its advantages, such as high irrigation efficiency and high water application uniformity, problems have been reported in some center pivot irrigated areas. In these systems, because the area irrigated per lateral length unit increases from the pivot point up to end of the lateral line, water application rate also increases Thus, as equipment length becomes larger, it worsens the problem of water application rate increase.
KINCAID (2005) developed an equation for predicting water application pattern width for different emitter models. For a specific type of emitter, the water application pattern width is computed based on nozzle discharge, nozzle pressure, and installation height above the soil surface. When the emitter set up chart, that describes nozzle sizes and positions, installation heights, and working pressures is available, this equation, combined with the nozzle size-flow rate equation for each specific type of emitter (Spray, i-wob, among others), promotes a way for predicting the average and maximum application rates along a center pivot lateral line.
The water application pattern width is defined as the width of the strip that is simultaneously irrigated by the center pivot lateral line, measured perpendicularly to this literal line. In a given point along the lateral line, the water application pattern width is determined by the wetted radius of the emitters near to that point. According to COLOMBO (2003), in a center pivot equipment that presents emitters with increasing flow along the lateral line, the width of the wet pattern tends to increase as it is moved away from the central pivot point.
Temporal variations in the value of the application rate of water in central pivot are analyzed under the assumption that during the time interval corresponding to the time of wetting, the application rate of water follows a template elliptical (KINCAID et al., 1969; DILLON et al., 1972; GILLEY, 1984; BERNUTH & GILLEY, 1985). However, others believe that the parabolic profile (LUZ & HEERMANN, 2005) or the trapezoidal pattern (DEBOER et al., 2001; KINCAID, 2005) are more suitable.
Whereas in all irrigated area is applied a same gross depth, the mean value (imedrs) of the actual water application rate required at each distance along the lateral (rs) from the pivot point, which is the ratio between the applied gross depth (Lb in mm) and actual application time (Tmrs in hours), can be estimated according to KELLER & BLIESNER (1990).
According to ASSOULINE & BEM-HUR (2006), application rate and soil surface slope are strongly related to interhill erosion, which involves the breakdown and transport of soil particles by the impact of water drops. Compared the soil resistance to erosion and slope, application rate was considered by LAFLEN & WATSON (1986) as the most important variable for predicting interhill erosion.
In center pivots systems equipped with LEPA emitters, reduction on application pattern width aims to turn them into localized irrigation systems and, thus, reduce water use. According to TOMAZELA et al. (2003), at the beginning of the use of LEPA emitters, producers and technicians who guided and disseminated this system were simply resizing the nozzles and making the necessary adaptations to change the emitters without considering the benefits of pump resizing and consequently reduction on water application costs. According to the authors, after several studies and field observations, the following parameters for the design of such equipment were found: variable spacing of emitters from 1.6 to 3.9 m, water savings of about 35%, average application pattern width 2 m, and a 4% limit for land slope in circular areas. However, by reducing application pattern width, the artificial rain application rate becomes intensively erosive, without even considering the impacts on soil surface. The problem is even greater in crops such as coffee, because, on its early stage of development, it does not have enough cover to protect the soil surface from the impact of droplets or jets of water, preventing problems of breakdown in its surface, as well as superficial runoff. Such problems are likely to occur in larger proportions on soils of medium texture, such as the Latosols present on areas with predominance of LEPA.
Impact erosion occurs by the impact of drops on a soil without vegetation, when soil particles are easily broken down and swept away by runoff. Consequently, the finer particles that remain in suspension are able to reach deeper soil layers, where deposition of these particles may happen when a horizon that prevent them from passing, causing even more damage (GOMES, 2006).
The introduction of center pivots assembled with LEPA emitters in parts of the Cerrado region, in Minas Gerais and Bahia states, requires the study of soil surface and drop impact interations, which should be clarified in order to improve the performance of center pivot irrigated areas with LEPA. In this context, this study aimed to characterize water application rate, application pattern width, flow rate, uniformity of water distribution and soil losses caused by nozzles of the Low Energy Precision Aplication (LEPA) type Quad-Spray emitter
MATERIAL AND METHODS
Characterization of experimental area
The experiment was conducted at the Laboratory of Hydraulics and Irrigation (LHI), of the Engineering Department (DEG), on the campus of the Federal University of Lavras (UFLA), in Lavras - MG, Brazil. Water application rate, application pattern width, flow rate , water distribution uniformity and soil loss due to water erosion (impact and Interhill erosion) of a Red Yellow Latosol of medium texture, were characterized under for different nozzles sizes of the Senninger Irrigation Quad-Spray emitter, operating at the Bubble configuration (LEPA 1)
galvanized steel lateral pipe with an internal diameter of 57.3 mm, through a drop tube (white PVC pipe) with an internal diameter of 19.1 mm.
The 22 nozzles were individually connected to the Quad-Spray, standing at a height of two meters above soil samples and catch cans positioned on a mobile platform called Controlled Linear Displacement Device (DMLC). This mobile platform was able to move on a metal rail, passing under the Quad-Spray emitter. With the aid of a variable frequency drive it was possible to control the platform linear speed and to reverse the displacement direction. By adjusting the platform linear velocity speed it was possible to simulate the application of the same irrigation depth with the Quad-Spray operating with different nozzle sizes.
Irrigation control
To evaluate the average water application rate and soil losses by erosion due to the use of the Quad-Spray emitter, in LEPA 1 configuration, with the 22 different nozzle sizes, it was necessary to measure the flow rate (qb) and the application pattern width (Wrs) of each nozzle size. The application of the same irrigation gross depth (Lb = 3.5mm) at the same time interval per revolution (Tg= 8 hours) was simulated for all nozzle sizes. DMLC linear velocity for each Quad-Spray emitter nozzle size was computed based on these values. Thus, water application time to the collectors and soil samples was just enough to the emitter to apply the same water depth for all the different nozzle sizes.
Flow rate
Quad-Spray emitter flow rate, for nozzles sizes varying from 1.59 up to 9.92 mm, was measured with the aid of a 20L container and a stopwatch. The flow rate of each nozzle was measured considering, the same working pressure as provided by a pressure regulator with a 68.95 kPa nominal pressure. For all tests, emitter working pressure was measured with the help of a differential mercury manometer connected to the pressure regulator outlet
Water application pattern
Due to the almost circular shape of water application pattern, for each Quad-Spray emitter nozzle size, the width of the application pattern was measured with the aid of a measuring tape, taking in account four different directions. The average width of each nozzle size was considered when computing the DMLC linear velocity at each one of the 22 tests
Average water application rate
FIGURE 1. Top view of water collectors
The application pattern width (Wri) was calculated at the distance ri from the emitter along the width of the wetted area according to SMITH et al. (2008).
Due to the variation of application width inside the wetted area, it was calculated the average value of average water application rate (imedri) at each collector distance ri from the nozzle. All average water application rates were computed assuming an elliptical model, according to the equation presented by SMITH et al. (2008).
The actual average rate of water application (imedrs) for each nozzle size used in the
Quad-Spray emitter, at a rs distance from the pivot point, was estimated by eq.(1):
ri c
n1 i
c ri ri n
1 i rs
S W
S W imed imed
(1)
where,
imedrs - average emitter application rate at the distance rs from the pivot point, mm h-1; imedri– average application rate at distance ri from the emitter, mm h-1;
Wri– application water pattern width at a distance a ri from the emitter, m; Sc– water collector spacing (0,12 m), and
n - number of collectors along the application pattern width (“n” variable in accordance with the nozzle size).
Water distribution uniformity
Water application inside the wetted pattern beneath a single Quad-Spray emitter, operating with each one of the 22 nozzles sizes evaluated, was measured by the Coefficient of Distribution Uniformity (CDU), as presented by BERNARDO et al. (2008). The weighting factor used for CDU of each emitter was the size of the area corresponding to the wet pattern width of each collector along the water distribution profile. Water distribution uniformity for a center pivot system assembled with a set of emitters presenting the 22 different nozzle sizes was calculated using as the weighting factor the order number of the nozzles along the center pivot lateral pivot.
2
0 Lrs
ri
Displacent rail
Wrs = Maximum Wri
Nozzle
Evaluation of soil loss due to water erosion
Soil losses were evaluated from deformed soil samples prepared in aluminum cans of 0.098 m of diameter. Soil samples were arranged in a line perpendicular to the direction of the DMLC linear displacement, at a distance of 1.12m from the line of collectors used to find the average water application rate. By using the same spacing among soil samples as used for water collection (0.12m) it was possible to obtain the same number of collecting points and to determine soil losses at the same positions where average application rate were determined. For each one of the nozzles sizes used in the Quad-Spray emitter, at each collection point, soil losses by erosion, in g m-2, were quantified by the difference in the dry weight of soil samples as measured before and after the application of the same average depth in function.
In order to obtain for each nozzle size a weighted value of average soil loss, the same process applied to the average application rate was used. .According to eq.(2), the weighting factor considered for the average soil loss was the area represented by each collection point inside the water application pattern:
ri c
n 1 i c ri ri n 1 i rs S W S W ps ps (2)
where,
psrs - weighted average amount of soil loss due to water erosion in function of emitter at a rs distance from the pivot, g m-2 mm-1;
psri - soil loss due to water erosion at the distance a ri from the nozzle, g m-2 mm-1; Wri– application pattern width at a ri distance from the nozzle, m;
Sc - soil sample spacing (0.12 m);
n - number of samples along the application pattern width (“n” variable according with the nozzle diameter).
Data analysis
A completely randomized experimental design with three replications was used for evaluation of the Quad-Spray emitter operating with each one of the 22 nozzles. The hypothesis of error normality on the data sampled for average water application rate, soil losses and flow rate was assessed by the Shapiro-Wilk test. For the same data, the homogeneity of error variance was analyzed by the Bartlett's test. On both tests a significance level of 5% was considered. After that, analysis of variance tests were carried out by F test ( = 5%). The comparison among averages determined for the 22 nozzles sizes used with the Quad-Spray emitter was carried out through the Skott-Knott test ( = 5%). The SISVAR (FERREIRA, 2006) and R (R DEVELOPMENT CORE TEAM, 2008) statistical programs were used for all analyzes.
RESULTS AND DISCUSSION
TABLE 1. Relationship fitted to flow rates reported by the manufacturer and flow rate measured with Quad-Spray emitter operating with different nozzle sizes.
Statistical Parameters
Model a b R2
Linear 0.963** 23.56* 99.97**
C.V.% 0.56 35.67
Significative at 1%**, 5%* through t test, at 5% probability.
TABLE 2. Adjustment model of nozzle flow related to the diameter of the Quad-Spray emitter nozzles.
Statistical Parameters
Model a b R2
Potential 35.78** 1.94** 99.97**
C.V.% 3.05 0.74
at 1%**, 5%* through t test, at 5% probability
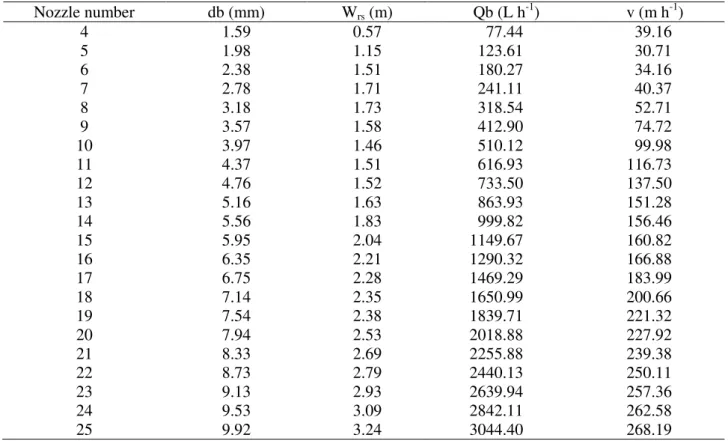
Values of Quad-Spray emitter nozzle size number, nozzle diameter, application pattern width, nozzle flow rate, and DMLC linear displacement velocity are shown in Table 3. Values of the DMLC linear displacement velocity were estimated after determinig flow rate and width of water application pattern of each nozzle size.
TABLE 3. Nozzle diameter nozzle sizes of the (db), water applicatiom pattern widdth(Wrs), and tangential speed of the DMLC (v) during te tests of each Quad-Spray emitter nozzle size.
Nozzle number db (mm) Wrs (m) Qb (L h-1) v (m h-1)
4 1.59 0.57 77.44 39.16
5 1.98 1.15 123.61 30.71
6 2.38 1.51 180.27 34.16
7 2.78 1.71 241.11 40.37
8 3.18 1.73 318.54 52.71
9 3.57 1.58 412.90 74.72
10 3.97 1.46 510.12 99.98
11 4.37 1.51 616.93 116.73
12 4.76 1.52 733.50 137.50
13 5.16 1.63 863.93 151.28
14 5.56 1.83 999.82 156.46
15 5.95 2.04 1149.67 160.82
16 6.35 2.21 1290.32 166.88
17 6.75 2.28 1469.29 183.99
18 7.14 2.35 1650.99 200.66
19 7.54 2.38 1839.71 221.32
20 7.94 2.53 2018.88 227.92
21 8.33 2.69 2255.88 239.38
22 8.73 2.79 2440.13 250.11
23 9.13 2.93 2639.94 257.36
24 9.53 3.09 2842.11 262.58
25 9.92 3.24 3044.40 268.19
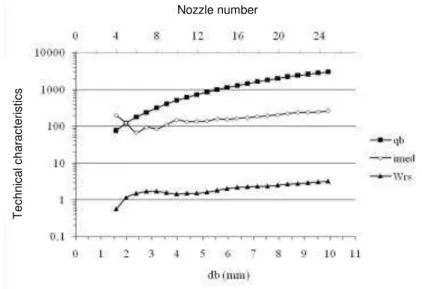
generally used practical value of 2.0m may lead to improper use of nozzles and, consequently, changes in their water average application values, causing problems of of the soil surface degradation and even irrigation management. Although finding an increasing function of average and wet pattern width regarding the increase of nozzle diameter, for some diameters it was detected decreasing values of these two variables, although nozzle flowflow rate continously increases with their diameter size , as shown in Figure 2. It is believed that the decrease on water application pattern width and on water application rate of some nozzles are due to some manufacture reasons, which were not expected, because flow rate increases continously with increasing nozzle diameter size. PEREIRA (2002) observed considerable variation in Quad-Spray emitter water pattern along the pivot lateral .
FIGURE 2. Flow rate (qb), in L h-1; weighted water application average rate (imed), in mm h-1, and application pattern width (Wrs), in m, related to the nozzle size (db) of the Quad-Spray emitter.
Loss of soil by water erosion
There was a high intensity among the values of loss of soil by water erosion and rate of application of water along the wet area in function of the 22 nozzles with different diameters, the emitter Quad-Spray, as seen in high values of correlation coefficient, shown in Table 4, significantly greater (<0.01).
By positive values of correlation coefficients, it was found that there was an increase in the amount of soil lost through erosion by increasing the average rate of application of water along the wet area of each nozzle. BRANDÃO et al. (2007) submitted a Red Yellow Latosol to six levels of kinetic energy, lower than the intensity of a rainfall of 156 mm h-1 of one hour, and found values of soil loss between 230 to 3230 g m-2.
Considering the short duration of exposure of soil samples submitted to the Quad-Spray emitter nozzle, just about some seconds, the excessive soil loss is remarkable when compared to soil losses under simulated or natural rainfall in literature. Researches on operational characteristics of sprayers and sprays are restricted to the study of the kinetic energy and water application rates, then without assessing soil loss by water erosion.
An uneven distribution of water over the wet area for each Quad-Spray emitter nozzles was observed, as per the low coefficient of water distribution uniformity (CDU) shown in Table 4.
The uneven water distribution presented by the Quad-Spray emitter can be observed by the water distribution profiles used for some of the nozzles shown in Figure 3. A more concentrated distribution of water near the periphery of the wet area, or in a ring on the outer edge of the wet
Nozzle number
Tec
h
n
ic
a
l
c
h
a
ra
c
te
ri
s
tic
circle , similarly to the pattern of wetting the Spray emitter shows in the catalog of SENNINGER IRRIGATION INC. (2008) was observed, and little water is applied to the area inside the wet circle. Besides the concentration of water applied around the wetted area by the Quad-Spray emitter nozzles, one application was observed located in the center of the wet area when nozzles used with up to 4.37 mm of diameter, due to a sort of central application (drip) from manufacturing characteristics of the emitter itself.
TABLE 4. Simple linear correlation of values of soil loss by water erosion (ps), related to the average rate values of water application (imed), and coefficient of uniformity of water distribuition (CDU) in function of nozzle diameters (db) used by the Quad-Spray emitter.
Weighted Average
ps (g m-2 mm-1) imed (mm h-1) CDU (%) db (mm) R
173.73 197.88 11.90 1.59 96.67**
202.03 122.22 0.68 1.98 93.76**
273.68 68.05 2.95 2.38 94.60**
292.69 94.29 21.19 2.78 98.75**
276.36 85.38 7.07 3.18 98.30**
180.11 111.29 8.29 3.57 89.73**
125.89 147.23 7.30 3.97 80.67**
171.17 133.18 6.36 4.37 93.79**
189.02 135.20 7.37 4.76 98.21**
176.08 138.36 4.49 5.16 98.30**
152.48 158.11 10.83 5.56 93.62**
158.27 154.39 3.69 5.95 93.70**
173.23 165.33 6.40 6.35 93.89**
167.31 171.35 4.75 6.75 95.52**
155.56 182.61 8.79 7.14 94.96**
177.18 193.08 23.83 7.54 91.55**
170.58 206.77 6.90 7.94 91.10**
206.17 223.97 14.83 8.33 92.70**
223.40 236.14 24.34 8.73 92.50**
186.50 237.32 24.98 9.13 93.45**
180.89 244.53 32.73 9.53 86.21**
175.58 258.15 35.73 9.92 90.73**
FIGURE 3. Profile of water distribuition and soil losses of some nozzle diameters of the Quad-Spray emitter.
Nozzle 3.97 mm Nozzle 1.59 mm
Nozzle 5.95 mm Nozzle 7.99 mm
Nozzle 9.53 mm Nozzle 9.92 mm
Space between collectors (m) Space between collectors (m) Space between collectors (m) Space between collectors (m) Space between collectors (m) Space between collectors (m)
-1.92 -1.44 -0.96 -0.48 0 0.48 0.96 1.44 1.92 -1.92 -1.44 -0.96 -0.48 0 0.48 0.96 1.44 1.92
-1.92 -1.44 -0.96 -0.48 0 0.48 0.96 1.44 1.92
-1.92 -1.44 -0.96 -0.48 0 0.48 0.96 1.44 1.92
The low values of water distribution uniformity (CDU) shown in Table 5 indicte uneven application of water along a center pivot lateral assembled with the set of 22 nozzles sizes of the Quad-Spray emitter. According to the ABNT (1998), center pivot systems values of CDU below 70%, from 70 to 74%, from 75 to 81% and over 80% are rated, respectively, as a bad, fair, good, and very good. PEREIRA (2002) observed a CDU of 95.88% on a center pivot equipped with Quad-Spray emitters. However, for each nozzle, the water depths were calculated based on the volume of water collected per nozzle and on a fixed 1.5m wide wetted area. When evaluating the water distribution uniformity of seven center pivot systems equipped with Quad-Spray emitter, MANTOVANI et al. (2007) found CDU values between 66.8 and 89.64%, based on measured flow values of 100% of the assessed emitters. Care must be taken ton evaluating the uniformity of water distribution of LEPA emitters, since there is a variation in the width of the wetted strip among different nozzles. It also must be considered that in Brazil, LEPA systems are used without water dikes are essential for CDU estimated based only on emitter flow measurements.
TABLE 5. Simple linear correlation of weighted average of soil loss by water erosion as function of average values of weighted water application rate (Source of variation) and coefficient weighted of uniformiity water distribuition (CDU) of the set of 22 nozzle diameters of the Quad-Spray emitter.
Source of Variation CDU (%) R
Model 51.71 -44.18*
Significative at 1%**, 5%* through t test, at 5% probability.
It should be noted that much of the total of soil lost by water erosion (values up to 71.86%) by the action of the emitter was due to the effect of the impact of droplets. Despite the high correlation of soil loss by water erosion, it was found that these two variables did not show a good correlation with the increasing of nozzle diameter, as seen by the low value of correlation coefficient shown in Table 5, significantly greater (<0.01). It is observed that, besides the low correlation, it is a negative correlation, which means there was an increased loss of soil by erosion with decreasing average rate of water application. This fact shows that the mean weighted average rate of application of water and soil loss by water erosion, depending on the diameter of the Quad-Spray emitter nozzle, are unreliable for use in deterministic functional relationships.
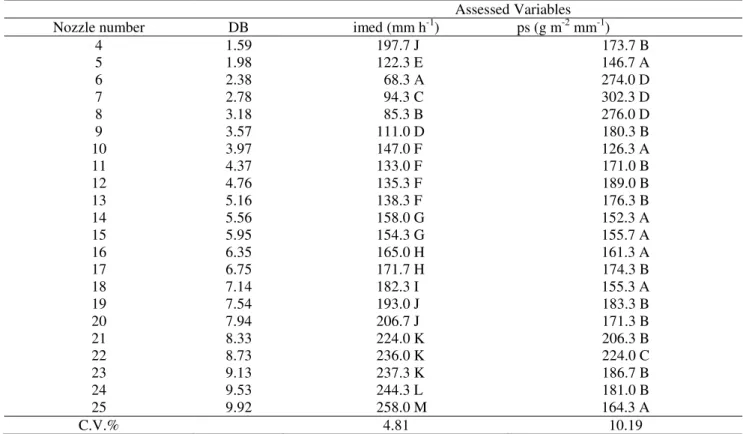
TABLE 6. Effect of Quad-Spray emitter nozzle diameter (db) on the weighted average water application rate (imed) and the weighted average soil loss by erosion (ps).
Assessed Variables
Nozzle number DB imed (mm h-1) ps (g m-2 mm-1)
4 1.59 197.7 J 173.7 B
5 1.98 122.3 E 146.7 A
6 2.38 68.3 A 274.0 D
7 2.78 94.3 C 302.3 D
8 3.18 85.3 B 276.0 D
9 3.57 111.0 D 180.3 B
10 3.97 147.0 F 126.3 A
11 4.37 133.0 F 171.0 B
12 4.76 135.3 F 189.0 B
13 5.16 138.3 F 176.3 B
14 5.56 158.0 G 152.3 A
15 5.95 154.3 G 155.7 A
16 6.35 165.0 H 161.3 A
17 6.75 171.7 H 174.3 B
18 7.14 182.3 I 155.3 A
19 7.54 193.0 J 183.3 B
20 7.94 206.7 J 171.3 B
21 8.33 224.0 K 206.3 B
22 8.73 236.0 K 224.0 C
23 9.13 237.3 K 186.7 B
24 9.53 244.3 L 181.0 B
25 9.92 258.0 M 164.3 A
C.V.% 4.81 10.19
Averages followed by the same letter do not differ through the Skott-Knott test at a significance of 5%.
FIGURE 4. Weighted average values of soil loss by water erosion (ps), in g m2 mm-1, and average water application rate (imed), in mm h-1, observed for different Quad-Spray emitter nozzle sizes.
CONCLUSIONS
Measured flow rate values of the Quad-Spray emitter operating with nozzles sizes from 1.59 up to 9.92mm were close to the flow rate values reported in manufacturer's catalog.
The width of water application pattern varied according to nozzle size, ranging from 0.57 to 3.24m and it suggests a more suitable design of the Quad-Spray emitter nozzles than the process based on a constant value of 2m, generally used.
Nozzle number
A
sse
sse
d
v
a
ri
a
b
le
High uneven water distribution was found along the wet area of each nozzle of the Spray emitter, as well as along the lateral line of a center pivot assembled with a set of 22 Quad-Spray emitter nozzle sizes.
Soil losses by erosion are extremely dependent on the average rate of water application over the area wetted by the Quad-Spray emitter. However, weighted average values of soil loss by erosion do not show good relationship with average weighted values of water application rate that increases with nozzle diameter size.
ACKNOWLEDGEMENTS
To FAPEMIG due to the financial support for the Research Project, and to CAPES for providing a PhD scholarship.
REFERENCES
ASSOCIAÇÃO BRASILEIRA DE NORMAS TÉCNICAS. NBR 14244:equipamentos de irrigação mecanizada: pivô central e lateral móvel providos de emissores fixos ou rotativos: determinação da uniformidade de distribuição de água. Rio de Janeiro, 1998. 11 p.
ASSOULINE, S.; BEN-HUR, M. Effects of rainfall intensity and slope gradient on the dynamics of interrill erosion during soil surface sealing. Catena, Amsterdam, v.66, p.211-220, 2006.
BERNARDO, S.; SOARES, A. A.; MANTOVANI, E. C. Manual de irrigação. 8.ed. Viçosa: UFV, 2008. 625 p.
BERNUTH, R. D. von; GILLEY, J. R. Evaluation of center pivot application packages considering droplet induced infiltration reduction. Transaction of the ASAE, Saint Joseph, v.28, n.6, p.1940-1946, 1985.
BRANDÃO, V. dos S.; SILVA, D.D. da.; RUIZ, H.A.; PRUSKI, F.F.; SCHAEFER, C.E.G.R; MARTINEZ, M.A.; SILVA, E.O. Perdas de solo e caracterização física e microbiológica de crostas formadas em solo sob chuva simulada. Engenharia Agrícola, Jaboticabal, v.27, n.1, p.129-138, jan./abr. 2007.
CARVALHO, D. A.; SILVA, L. D. B. A evolução dos pivôs. A Granja, Porto Alegre, p. 44-47, set. 2007.
COLOMBO, A. Pivô central. In: MIRANDA, J. H. de; PIRES, R. C. de M.Irrigação: série Engenharia Agrícola. Jaboticabal: FUNEP, 2003. p.209-258.
DEBOER, D. W.; MONNES, M. J.; KINCAID, D. C. Measurement of sprinkler droplet size. Transactions of the ASAE, St. Joseph, v.17, n.1, p.11-15, 2001.
DILLON, R. C.; HILER, E. A. J.; VITTEROE, G. Center-pivot sprinkler design based on intake characteristics. Transactions of the ASAE, St. Joseph, v.15, n.5, p.996-1001, 1972.
FERREIRA, D. F. Programa de análises estatísticas (statistical analysis software) e planejamento de experimentos - SISVAR 5.1 (Build 72). Lavras: DEX/UFLA, 2006.
GILLEY, J. R. Suitability of reduced pressure center-pivot. Journal of Irrigation and Drainage Engineering, New York, v.110, n.1, p.22-34, 1984.
GOMES, G. L. M. Diagnósticos de áreas degradadas por voçorocas no município de alterosa/MG. 2006. 59 f. Dissertação (Mestrado em Tecnologia Ambiental) - Universidade de Ribeirão Preto, Ribeirão Preto, 2006.
KINCAID, D. C. Application rates from center pivot irrigation with current sprinkler types. Transaction of the ASAE, St. Joseph, v.21, n.4, p.605-610, 2005.
KINCAID, D. C.; HEERMANN, D. F.; KRUSE, E. G. Application rates and runoff in center-pivot sprinkler irrigation under low-energy. Transactions of the ASAE, St. Joseph, v.12, n.6, p.790-794, 1969.
LUZ, P. B.; HEERMANN, D. A statistical approach to estimating runoff in center pivot irrigation with crust conditions. Agricultural Water Management, Amsterdam, v.72, n.11, p.33-46, 2005. MANTOVANI, E.C.; TEIXEIRA, M.B.; RAMOS, M.M.; OLIVEIRA, R.A. de; SOUZA, D.O. Densidade de coleta de dados e sua influência na caracterização da uniformidade em pivô central LEPA. Irriga, Botucatu, v.12, n.3, p.297-306, jul./set. 2007.
PEREIRA, L.S. Avaliação hidráulica de um sistema de irrigação por pivô central tipo LEPA. 2002. 45 f. Monografia (Graduação em Agronomia) – Universidade Estadual de Montes Claros, Janaúba, 2002.
R DEVELOPMENT CORE TEAM. R: a language and environment for statistical computing. Vienna: R foundation for Statistical Computing, 2008. Disponível em: <http://www.R-project.org>. Acesso em: 12 ago. 2009.
SENNINGER IRRIGATION INC. Pivot-master: irrigation products. Disponível em: <http://www.senninger.com/literature/Pivot%20Catalog.pdf>. Acesso em: 20 fev. 2008. SMITH, R. J.; GILLIES, M. H.; NEWELL, G.; FOLEY, J. P. A decision support model for travelling gun irrigation machines. Biosystems Engineering, London, v.100, n.1, p.126-136, 2008. TOMAZELA, C.; MANTOVANI, E. C.; FERNANDES, A. L. T. Irrigação localizada com sistema pivô central e linear: a nova fronteira da irrigação no Brasil. ITEM: Irrigação & Tecnologia
Moderna,Brasília, n.60, p.70-79, jun. 2003.