Consumer
’
s inlation expectations in Brazil
♦
Fernando Ormonde Teixeira Pesquisador – Fundação Getúlio Vargas (FGV)
Endereço: Rua Barão de Itambi, 60, 6º andar – Botafogo – Rio de Janeiro/RJ CEP: 22250-900 – E-mail: [email protected]
Ingrid Christyne Luquett de Oliveira
Funcionária – Instituto Brasileiro de Geografia e Estatística (IBGE)
Endereço: Av. República do Chile, 500 - 10º andar – Centro – Rio de Janeiro/RJ CEP: 20031-170 – E-mail: [email protected]
Pedro Costa Ferreira
Professor – Fundação Getúlio Vargas (FGV)
Endereço: Rua Barão de Itambi, 60, 6º andar – Botafogo – Rio de Janeiro/RJ CEP: 22250-900 – E-mail: [email protected]
Recebido: 05/07/2016. Aceite: 12/05/2017.
Abstract
This paper investigates what are the main components of consumer’s inflation expectations. We combine the FGV’s Consumer Survey with the indices of inflation (IPCA and government regulated prices), professional forecasts disclosed in the Focus report, and media data which we crawl from one of the biggest and most important Brazilian newspapers, Folha de São Paulo, to determine what factors are responsible for and improve consumer’s forecast accuracy. We found gender, age and city of residence as major elements when analyzing micro-data. Aggregate data shows the past inflation as an important trigger in the formation of consumers’ expectations and professional forecasts as negligible. Moreover, the media plays a significant role, accounting not only for the expectations’ formation but for a better understanding of actual inflation as well.
Keywords
Inflation expectations. Media. Brazil. Consumers.
Resumo
O artigo investiga as principais variáveis que influenciam a formação das expectativas de in-flação dos consumidores brasileiros. Combinamos sondagem do consumidor, divulgada pela FGV, índices de inflação (IPCA e preços regulados pelo governo), previsões do mercado para o IPCA publicadas no Boletim Focus e informações sobre a circulação de notícias de inflação em um dos maiores e mais importantes jornais nacionais, Folha de São Paulo, a fim de determinar fatores relevantes para previsão da inflação dos consumidores e melhoria da acurácia da mesma. A análise dos microdados da sondagem do consumidor identificou como principais variáveis o gênero, a idade e a cidade de residência. Dados agregados mostram a inflação passada como fator importante na formação das expectativas dos consumidores enquanto a previsão do
mercado não é significativa. Além disso, a mídia desempenha papel significativo, contando não apenas para a formação das expectativas como também para a melhora da compreensão sobre a inflação atual.
Palavras-Chave
Expectativas de inflação. Mídia. Brasil. Consumidores.
Classiicação JEL C22. D1. D84. E31. E52.
1. Introduction
Brazilian inflation trade-off debate in the past years and how it affects economy in the short and in the long run makes the understanding of how consumers frame their inflation expectations a crucial matter. In this study, we aim to understand how consumers form their inflation ex-pectations. This can provide guidance to Central Banks and other govern-ment agencies so as to improve their managegovern-ment over the inflation rate. Economists have long understood that macroeconomic outcomes depend heavily upon agents’ expectations. Since the 1970s the academic literatu-re has sought to incorporate expectation in Macro models. Moliteratu-re literatu-recent models started to take into account that agents may not be fully infor-med about all economic variables (Carroll 2003; Curtin 2007; Arora et al. 2013). Being able to anchor agents and mainly the consumers’ expectations is a tool that no government can disregard.
The data used here come from the “Sondagem do Consumidor” (Consumer Survey) conducted by FGV/IBRE (Fundação Getulio Vargas - Getulio Vargas Foundation), the Brazilian Institute of Geography and Statistics, the Brazilian Central Bank and the Folha de São Paulo (FSP) newspaper. The consumer survey resembles deeply and was inspired by the Surveys of Consumers conducted by the Michigan University.
choosing phrases that were clearly related to inflation. We approach the subject using multiple econometric models, taking consumers’ inflation expectations as the dependent variable and as explanatory variables a ge-neral inflation index, professional forecasts and the media variable, along with other controls.
We first look at micro data from the Consumer Survey by running an OLS model of inflation expectations against individual characteristics such as income, education, city of residence, age, gender and time fixed effects. We find out that gender, age, education, city of residence and income play major roles in explaining expectations. Also, time is a non-negligible factor as almost all of the time dummies are significant. These results, with an updated database, are in conformity with the previous findings of Campelo et al. (2014), reasserting our results.
As a third step, we run error correction models using aggregate data. We were able to reproduce some of the results found for other countries, showing that inflation has a short- and a long-term positive influence on expectations. Moreover, the inflation target is an anchor to consumers’ expectation, while the media helps to reduce consumers’ forecasting er-rors (Carroll 2003). The only result different from the previous literature was that professional forecasts have no significant effect on consumers’ expectations (Easaw et al. 2012). However, this result is in accordance with Campelo et al. (2014).
There are four sections, the first being this introduction. Section 2 des-cribes the data and the empirical strategy. Section 3 presents our results, emphasizing our main contribution, i.e., the inclusion of the media variable into the formation of inflation expectations. Finally, the fourth section draws conclusions and addresses the study limitations.
2. Data
circula-tion in the country. The Consumer Survey is provided by the Getulio Vargas Foundation (FGV) in conjunction with the Brazilian Institute of Economics (IBRE) following research done in other countries such as the Surveys of Consumers conducted by the University of Michigan in the United States and the ISAE Consumers Survey in Italy. Since mid-2005, the monthly FGV/IBRE survey on consumer’s opinions added a quantitati-ve question about inflation expectations that allows us to replicate studies about consumers’ inflation expectations seen in the USA and Europe. The media news information comes from a crawler written in the R language, originating from the scan of the printed version of Folha de São Paulo ne-wspaper. Information regarding the twelve month cumulative IPCA and the Focus report were harvested in the IBGE and Bacen websites, respec-tively. Both can be found in a monthly frequency and in a bigger time-span than needed, not requiring any kind of data manipulation.
The economic trend surveys are conducted continuously through time and generate vital information to enable monitoring and anticipation of events in the economy, providing timely tools to deal with aggregate economic variables. The insights brought by surveys allow policy makers to anticipate the directions to take in order to accommodate the short term economic course. The intuitions that emerge from the responses given about agents’ decisions of spending and savings, extracting psychological behaviour, are impossible to be captured through classical approaches. The behaviour understanding improvement grants enhanced economic models. In spite of surveys being mostly about qualitative questions, FGV/IBRE introduced in its monthly research the quantitative query about consumers’ inflation expectations and kept track of these expectations for more than a decade, which allows to deepen the knowledge about the subject.
The raw data harvested by the consumer’s survey comprise a window going from December 2005 to February 2016, whereas the media data coming from FSP newspaper begins in 1999. This database can only be analyzed from June 2007 on, since before that date FSP did not widely adopt the internet as a media vehicle, which led to a sparse database. Thus, the definitive set of data constitutes 105 observations, which implies almost 9 years of collected information and a window big enough for this study, going from June 2007 to February 2016.
a. Data handling and analysis
i. The Consumer Survey
The survey conducted by FGV/IBRE brings to the surface crucial percep-tions of agents following the Likert scale. This scale presents itself with five different answers and three different types of sentiments expressions, or levels. Results can be characterized as positive, neutral or negative fol-lowing what the respondents reckon about an addressed issue. Also, the survey provides information about income, city of residence, education, age and gender (cf. Table 3) and the respondents are identified according to the specifications provided by FGV/IBRE, being preferably the house-holder and mandatorily of full legal age. Respondents are contacted by telephone and are part of a FGV/IBRE consumers’ pool. As previously stated, the Consumer Survey brings more qualitative than quantitative information, the question: “In your opinion, what will be the Brazilian inflation in the next 12 months?’’ (Translated from: “Na sua opinião, de quanto será a inflação brasileira nos próximos 12 meses?’’) being the single question requiring a quantitative answer. The envisaged answer is given in percentage amounts and does not assume negative values or values bigger than 500%. These cut-off points were arbitrarily chosen because they are in conflict with the inflationary levels observed since the advent of the Real currency in 1994, which suggests a misunderstanding of the question.
consumption. The information presented in this table is the survey’s sam-ple foundation. Table 2 summarizes the first four statistical moments and a few other raw, trimmed and inflation data characteristics.
Consumers overestimate the real inflation level and this overestimation persists after we apply trimming techniques. Even looking at the data first quantile, the consumer’s expectation is inflated when compared to the IPCA average. We understand that consumers are not necessarily thinking of the IPCA index when answering the question. This happens since the question in the survey does not make a direct link between the index and the answer asked. Consumers might form their expectations as the com-position of two behaviors described in Easaw et al. (2012, 2013): “inatten-tiveness” and “anchoring”. This behavior occurs since acquiring information bears costs and, therefore, agents do it discretely over time. Also, more important than the correct inflation prediction is the high correlation between the two series.
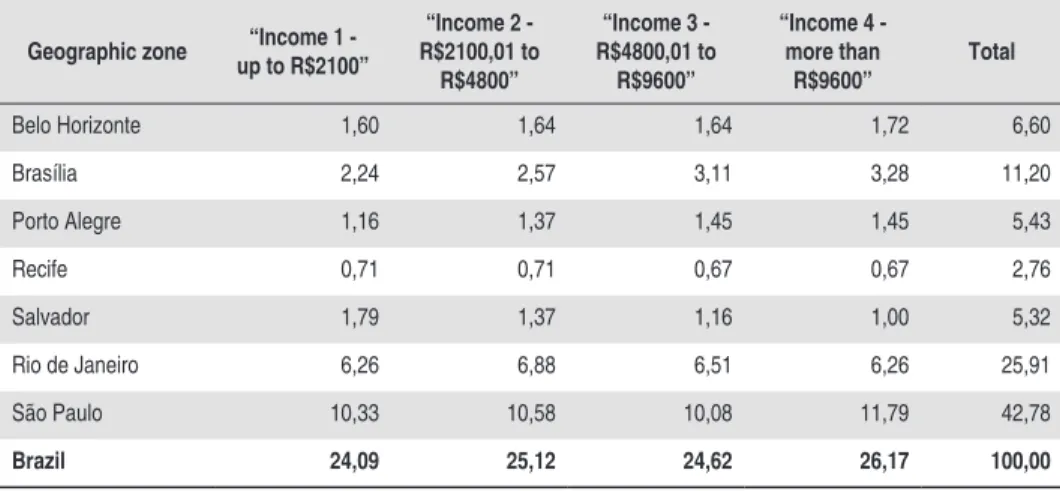
Table 1 - Consumption distribution for the target cities of the survey
Geographic zone “Income 1 - up to R$2100”
“Income 2 - R$2100,01 to
R$4800”
“Income 3 - R$4800,01 to
R$9600”
“Income 4 - more than
R$9600”
Total
Belo Horizonte 1,60 1,64 1,64 1,72 6,60
Brasília 2,24 2,57 3,11 3,28 11,20
Porto Alegre 1,16 1,37 1,45 1,45 5,43
Recife 0,71 0,71 0,67 0,67 2,76
Salvador 1,79 1,37 1,16 1,00 5,32
Rio de Janeiro 6,26 6,88 6,51 6,26 25,91
São Paulo 10,33 10,58 10,08 11,79 42,78
Brazil 24,09 25,12 24,62 26,17 100,00
Table 2 - Inflation Expectation of Brazilian Consumers, 2007-2016
No Trimming Trimming Boxplot Trimming Percentil IPCA
Mean 8,85 7,28 7,74 6,09
Median 8,39 7,02 7,43 5,91
Std Dev 0,18 0,12 0,13 0,15
Std Error 0,02 0,02 0,02 0,02
Q1 7,77 6,59 6,95 5,10
Q3 9,48 7,60 8,06 6,52
Max 14,67 11,49 12,67 10,71
Min 5,94 5,04 5,45 3,69
Kurtosis 2,17 2,93 3,16 1,44
Skewness 1,50 1,59 1,75 1,21
Obs. 105,00 105,00 105,00 105,00
Source: Authors
Equation 1 shows the individual inflation expectation for the next 12 months, expressed as Eth(π{t+12}); where h represents the individuals and t represents current time. As stated before, individuals are selected from a pool of consumers, which means that individuals do not answer the survey every month and, as a consequence, the data are not panel but a cross-section repetition. Equations 1 and 2 were modelled so as to capture each individual characteristic effect studied1 to avoid the clear correlation between variables (example: education and income).
Eth(π{t+12} ) = α0 + αkD(k)th+ ϵth (1)
Eth(π{t+12}) = αtτt+ α{k}D(k)th+ ϵth (2)
A number of k dummy variables were created for each sociodemogra-phic characteristic where D(k)=1 if an individual has a certain characte-ristic and zero otherwise. Equation 1 shows α0 as the intercept whereas in Equation 2 this coefficient is switched for a temporal dummy. These
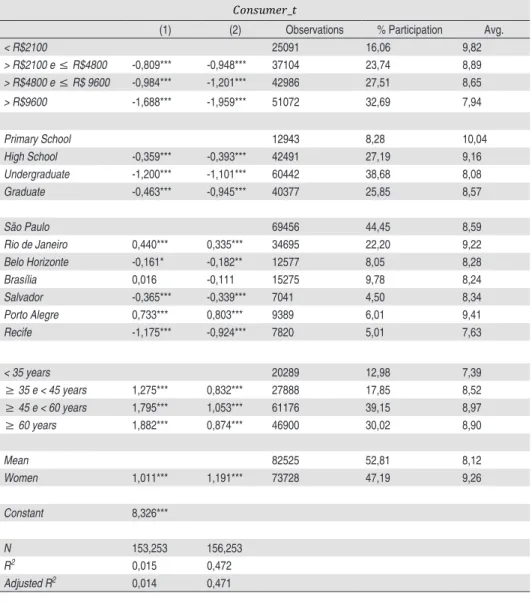
coefficients represent the inflation expectations averages for the referen-ce group in each period and are omitted from the results in Table 3. All omitted coefficients are highly significant and the reference group can be described as a male, with monthly income smaller than R$ 2,100, primary school education, living in São Paulo and 35 years of age or less.
Table 3 shows in columns 1 and 2 two regression models that will be bet-ter described labet-ter, column 3 and 4 show the number of observations of each group and its percentage participation in the sample. The last column shows the averages of expected inflation of each sociodemographic group.
The expected inflation averages of each sociodemographic group being correlated, the interpretation of these results should be seen with caution, nonetheless we can assert that the group with higher inflation expectation in the sample is the one with at most primary school education.
Table 3 - Micro-data Models
��������_�
(1) (2) Observations % Participation Avg.
< R$2100 25091 16,06 9,82
> R$2100 e ≤ R$4800 -0,809*** -0,948*** 37104 23,74 8,89 > R$4800 e ≤ R$ 9600 -0,984*** -1,201*** 42986 27,51 8,65
> R$9600 -1,688*** -1,959*** 51072 32,69 7,94
Primary School 12943 8,28 10,04
High School -0,359*** -0,393*** 42491 27,19 9,16
Undergraduate -1,200*** -1,101*** 60442 38,68 8,08
Graduate -0,463*** -0,945*** 40377 25,85 8,57
São Paulo 69456 44,45 8,59
Rio de Janeiro 0,440*** 0,335*** 34695 22,20 9,22
Belo Horizonte -0,161* -0,182** 12577 8,05 8,28
Brasília 0,016 -0,111 15275 9,78 8,24
Salvador -0,365*** -0,339*** 7041 4,50 8,34
Porto Alegre 0,733*** 0,803*** 9389 6,01 9,41
Recife -1,175*** -0,924*** 7820 5,01 7,63
< 35 years 20289 12,98 7,39
≥ 35 e < 45 years 1,275*** 0,832*** 27888 17,85 8,52 ≥ 45 e < 60 years 1,795*** 1,053*** 61176 39,15 8,97
≥ 60 years 1,882*** 0,874*** 46900 30,02 8,90
Mean 82525 52,81 8,12
Women 1,011*** 1,191*** 73728 47,19 9,26
Constant 8,326***
N 153,253 156,253
R2 0,015 0,472
Adjusted R2 0,014 0,471
Notes: ***Significant at the 1 percent level **Significant at the 5 percent level *Significant at the 10 percent level
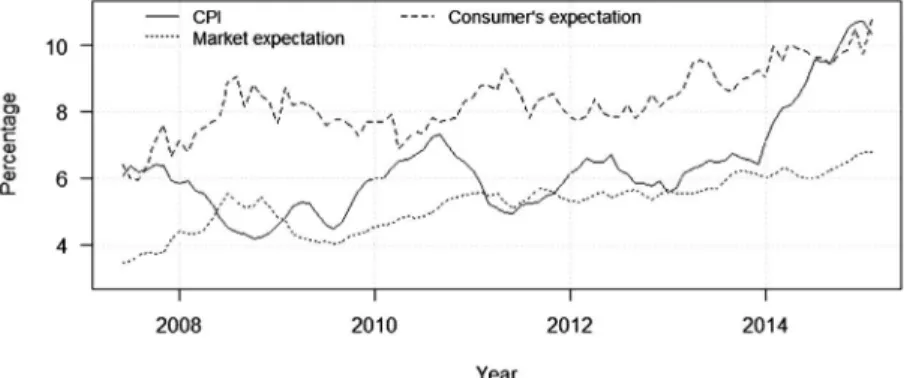
period t+12. Figure 2 clearly shows that consumers overestimate inflation in their forecasts and that the expectation error of the professional econo-mic agents (Focus) is smaller than the consumers’ error, nevertheless it is also evident according to the data that professionals likely underestimate inflation.
Another factor brought up by Figure 1 is that there are movements in ex-pectations that reduce the forecasts errors of consumers. Id est, consumers close the gap between their expectations and real inflation and also the professionals become less accurate. These movements are also perceptible in 2007/08 and 2010/11. A possible explanation for these two “bumps” shown in Figure 1 is the sub-prime crisis in United States that began in 2007 and arrived in Brazil in 2008 and the 2010/2011 US debt-ceiling along with the European crisis, when Greece threatened default and was rescued by the European Union. Since 2014, Brazil experiences its own internal political and economical crisis steepening the inflation increase movement that starts in 2013.
An alternative explanation is the rise in regulated prices inflation. Even though we did not plot, we ran the same exercise shown below to the CPI-R — regulated prices (we also tried the CPI related to food and be-verages with no success). In 2010/11 and since 2014 until the end of the series the regulated prices are the major responsible for the CPI levels. The 2007/08 gap reduction would remain without explanation in this context.
Figure 1 - Inflation Forecasts x IPCA
Although the consumers’ expectation error is, in absolute values, clearly bigger than the professionals’ and that it is non negligible in percentage value, both expectations follow a similar trend as shows the Figure 2. Also, since the question in the consumer survey does not make any reference to the IPCA index, there is no direct mapping between consumers’ ex-pectations and the exex-pectations disclosed by the professional forecasters.
Figure 2 - Forecast Error Comparative
Source: Authors.
When we compare the correlation between series it seems clear that consumers generate their expectations for twelve months ahead just by looking at the inflation levels that they are experiencing at that date. The correlations are of 88% when we compare the expectations with actual inflation. That number falls sharply to a 25.8% when the compari-son is drawn with the expectations and the twelve month ahead realized inflation.
ii. Media Data
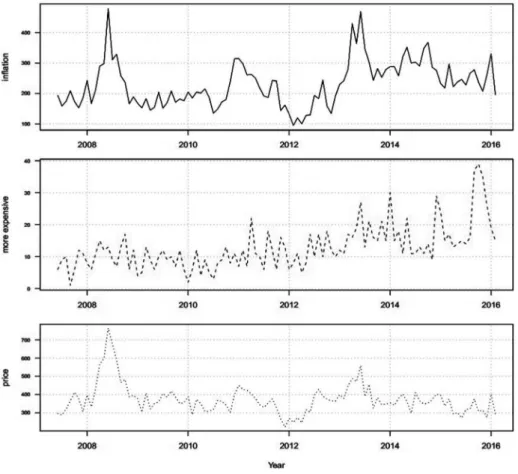
Data concerning news was captured through the website of the newspaper Folha de São Paulo. This newspaper was chosen because it is one of the most sold newspapers in the country, from the biggest Brazilian city and arguably the most important in social impact. The mixture of objective and subjective criteria is not ideal, but choosing based only on objective criteria could lead to tabloids, since there are a vast number of them cir-culating in the country and they sell more copies than the “traditional” newspapers, even though their social impact is almost irrelevant.
Media data capture was from only one newspaper because of technical limitations, but in accordance with literature (Carroll 2005). Each news-paper website requires different settings since they all work in different ways, restraining our possibilities. Our crawler, written in R programming language, accessed and stored all the online news on a daily basis. The phrases chosen to represent the concept of inflation in our study were “inflação” (inflation), “encarece” (more expensive), and combinations of the words “preço(s)” (price(s)) and “subiu”, “subir(am)”, “sobe(m)”, “alta”, “aument(a/ou/aram/am)” (rise(s), increase(s)). These words and expressions were empirically chosen looking at the contexts in which they are regularly applied and how often they are employed by the press.
Figure 3 - Researched Expression
Source: Authors.
As we stated before, each news item containing the researched terms was catalogued for future consultation. The raw data are piled up in a database with the following columns: dates (day, month and year), the number of news items and a third column counting each term researched.
The media variable created and tested is a proportion dummy, this kind of variable takes into account that there was an increase in the total number of monthly news items through time. This increase would bring challen-ges if we used the raw numbers. There are chanchallen-ges in the total number of news items through time in the online newspaper, but the news’ ratios of specific themes should not suffer variations, ceteris paribus. As we only have one source of media information and considering that newspapers are local compared to other medias, like TV stations, we might incur a bias. Nonetheless, the online newspapers are more likely to target a national audience than their printed counterparts and, FSP being arguably the more respected and read along with O Globo and O Estado de São Paulo, this bias should not interfere with results.
Figure 4 - News Captured Source: Authors
3. Model and results
The models presented previously, with raw data about individuals through time have temporal limitation. This means that dynamic analyses are im-possible since there is no guarantee that the same interviewee will be present throughout time (no respondent shows up throughout all the time period). This peculiarity forbids the use of “persistent information” ex-pectations or epidemiological models and, even though we know that the groups heterogeneity might create bias in the aggregated series (Easaw et al. 2012), it rests clear that no group in the sample has characteristics so different and striking that would allow it to bias the series as a whole.
For these new models, we call the consumers’ average inflation expecta-tions 12 months ahead as Consumer, the 12 month cumulative inflation measured by IBGE is named as IPCA (national index of the broad con-sumer), the professional expectations average released by the Brazilian Central Bank is the Focus, and the dummy variable to capture media, Media.
We tested the regulated prices (prices managed by the federal govern-ment as it has control over these markets) and household debt as variables. These variables were exhaustively repeated in “focal groups” (these are control groups where pilot research is applied) promoted by FGV/IBRE as being the most important for their expectation formation. The regu-lated prices did not present themselves as a better proxy for inflation, hence we kept IPCA as our variable of choice. More information about why the IPCA showed itself as a better variable will be further discussed. Moreover, the debt variable did not show statistical significance, which means that we do not have enough evidence to reject the null hypothesis and, thereafter, debt does not affect consumers’ inflation expectations formation.
The model presented in equation 3 attempts to reproduce those observed in Campelo et al. (2014), Easaw et al. (2012) and Malgarini (2009).
Δ ��������� = �1 Δ ����{�−1} + �2 Δ ������ + � (��������{�−1} − �1 ����{�−2}
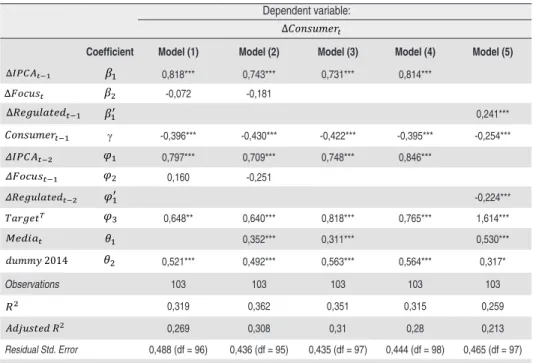
In this equation, apart from the variables already depicted such as the Consumer, IPCA and Focus we added the inflation target as a part of the model, working as a constant since it remains unchanged through the period studied. The inflation target in Brazil is at 4.5% and its addition to the model follows the literature, as it is supposed to be an anchor for inflation expectations (Campelo et al. 2014; Easaw et al. 2012; Malgarini 2009; Strohsal et al. 2016). Moreover,�t is representing the model errors.
The model (1) parameters �1 and �2 in Table 4 are to be read as short time adjustments of the consumers’ inflation expectations for the inflation and professional forecast variables, respectively. The first presented model shows results that resemble those found in Campelo et al. (2014) since the professional forecasts do not affect the Consumer variable and the IPCA variable is significant. This result is not verified in Carroll (2001) where both variables are significant at 5%. The coefficient �1 statistically different from zero, points out a possible “myopic” consumer behaviour, for which we already had a clue when we compared correlations between the inflation forecast and the actual inflation in the previous section. The coefficient �1 turns out to be significant as well, indicating that the long
term inflation is a factor too. Furthermore, the coefficient of the profes-sionals is not significant in the long run, which can be verified looking at coefficient �2. The inflation target variable works as our constant, but we
are not allowed to identify separate values for �3 and �������, meaning
that we are not able to verify whether ������� is consistent with the inflation target of 4.5%. We can only infer that there is an anchoring me-chanism in place, since the coefficient �3 is positive and very significant.
The � coefficient brings a unique interpretation. If � = 0, then there is no long term effect of actual inflation, professional forecasts or inflation target on consumers’ expectations. The speed of adjustment found is si-milar to the one found in Campelo et al. (2014), being 0.43 in our second model tested and 0.42 in their work. This 0.42 can be translated as a rate of mean reversion between the long run inflation expectations level and the actual level, the disequilibrium gap among the two variables is dissi-pated by 42% after a month.
Table 4 - Error Correction Models
Dependent variable:
���������
Coeficient Model (1) Model (2) Model (3) Model (4) Model (5)
Δ�����−1 �1 0,818*** 0,743*** 0,731*** 0,814***
������ �2 -0,072 -0,181
Δ����������−1 �1′ 0,241***
���������−1 γ -0,396*** -0,430*** -0,422*** -0,395*** -0,254***
������−2 �1 0,797*** 0,709*** 0,748*** 0,846***
�������−1 �2 0,160 -0,251
�����������−2 �1′ -0,224***
������� �3 0,648** 0,640*** 0,818*** 0,765*** 1,614***
������ �1 0,352*** 0,311*** 0,530***
����� 2014 �2 0,521*** 0,492*** 0,563*** 0,564*** 0,317*
Observations 103 103 103 103 103
�2 0,319 0,362 0,351 0,315 0,259
�������� �2 0,269 0,308 0,31 0,28 0,213
Residual Std. Error 0,488 (df = 96) 0,436 (df = 95) 0,435 (df = 97) 0,444 (df = 98) 0,465 (df = 97)
F Statistic 6,419*** (df = 7; 96) 6,729*** (df = 8; 95) 8,730*** (df = 6;97) 9,022*** (df = 5;98) 5,658*** (df = 6;97)
Note: ∗ � < 0,1; ∗∗ � < 0,05; ∗∗∗ � < 0,01
To analyze the possible bias brought by the media we verify the effect of increased inflation news in the consumers’ forecast errors. As we have observed a myopic behavior from consumers, we compare their responses to the news of the actual consumers’ inflation expectations with the ac-tual inflation. The comparison was made using the MAPE (mean absolute percentage error) metric. The MAPE has the advantage of both taking into account positive and negative errors and that it compares percentage error instead of real values. This is especially positive considering that inflation goes from under 4% in the beginning of our time frame and ends over 10% in 2016 since one percentage point error then represented a 25% error and now it represents less than 10%.
When comparing the MAPE between the periods with and without big media influence we notice a decrease in the forecast errors from 48% to 44%, or 4 percentage points. This result, ratified by an analysis of variance test, points out that the media brings the right information to consumers, thus improving their expectations significantly.
Table 5: Household accuracy when there is media coverage
Dependent variable: ����
Coluna1 (1) (2)
������ -3,235
(4,428)
-4,024 (4,097)
����� 2014 -1,772
(3,687)
Constant 48,375*** (1,737) 48,056*** (1,599)
Observations 105 105
�2 0,012 0,009
�������� �2 -0,008 -0,0003
Residual Std. Error 15,144 (df = 102) 15,087 (df = 103)
F Statistic 0,594 (df = 2;102) 0,965 (df = 1; 103)
Note: ∗ � < 0,1; ∗∗ � < 0,05; ∗∗∗ � < 0,01
4. Conclusions
This paper revisits the database provided by the Consumer’s Survey conducted by FGV/IBRE under the paradigm developed by Easaw et al. (2012) and the Campelo et al. (2014) discussion paper. It brings updated data, reinforcing previous results found and an analysis of the reaction of the Brazilian consumer to the media, something never done in the context of Brazil that we are aware of.
Looking at the city of residence factor we see mixed signs as there are ci-ties where people forecast smaller inflation rates than São Paulo and two that show consumers with higher expectations: Rio de Janeiro and Porto Alegre. We cannot determine if the regional expectations differences are the result of different regional inflation.
Aggregated data analysis showed that consumers adjust their expectations considering both the short and long term, which is a display that even if consumers are relatively “myopic” they do not completely erase the long term from their minds. This result is lined up with literature and other empirical studies. Another result found that is aligned with the literature is that consumers do not take into account professional forecasts as this variable is considered expensive to get.
The dummies we created to capture the effects of the media in the consu-mers’ expectations formation and a trend on inflation since 2014 showed positive coefficients. The trend dummy result was expected since Figure 1 shows a big leap in inflation from 2014 on. The results that could not be anticipated were the ones of the effects of the media on the consumers’ forecasts. Results showed that, not only media contributes to the forma-tion of consumers’ expectaforma-tions, but that they subsidize people to better understand the inflation phenomenon, allowing them to reduce the gap between their expectations and the actual inflation.
References
Arora, Vipin, Pedro Gomis-Porqueras and Shuping Shi. 2013. “The divergence between core and headline inlation: Implications for consumers’ inlation expectations.” Journal of Macroeconomics 38: 497 – 504.
Campelo, A., et al. 2014. “Inlation expectations of Brazilian consumers: an analysis based on the FGV survey.” Texto de Discussão 64. Instituto Brasileiro de Economia – Fundação Getúlio Vargas.
Carroll, Christopher D. 2001. “The epidemiology of macroeconomic expectations.” National Bureau of Economic
Research - Technical report 8695.
Carroll, Christopher D. 2003. “Macroeconomic expectations of households and professional forecasters.” The Quarterly Journal of economics: 269 – 298.
Carroll, Christopher D. 2005. “The epidemiology of macroeconomic expectations.” In The Economy as an Evolving Complex System, III: Current Perspectives and Future Directions, Edited by Lawrence E. Blume and Steven N. Durlauf. 2005.
Curtin, Richard. 2007. “What us consumers know about economic conditions.” Paper presented at OECD World Forum.
Easaw, Joshy, Roberto Golinelli and Marco Malgarini. 2012. “Do households anchor their inlation expectations? Theory and evidence from a household survey.” Acessed May 11, 2017. https://papers.ssrn.com/sol3/Delivery. cfm? abstractid=2136862.
Easaw, Joshy, Roberto Golinelli and Marco Malgarini. 2013. “What determines households inlation expectations? Theory and evidence from a households survey.” European Economic Review 61: 1 – 13.
Ehrmann, Michael, Damjan Pfajfar and Emiliano Santoro. 2015. “Consumers’ attitudes and their inlation ex
-pectations.” Finance and Economics Discussion Series 15.
FGV/IBRE. 2005. “Sondagem do consumidor.” Acessed December 14, 2016. https://goo.gl/SstliN.
Lamla, Michael J., and Sarah Lein. 2014. “The role of media for consumers’ inlation expectation formation.” Journal of Economic Behavior & Organization 106: 62-77. doi:10.3929/ethz-a-005640674.
Malgarini, Marco. 2009. “Quantitative inlation perceptions and expectations of Italian consumers.” Giornale degli Economisti e Annali di Economia: 53 – 82.
R Development Core Team. 2015. “R: A Language and Environment for Statistical Computing.” R Foundation
for Statistical Computing. Vienna: Austria.
Reis, Ricardo. 2006. “Inattentive producers.” The Review of Economic Studies 73 (3): 793 – 821.
Strohsal, Till, Rai Melnick and Dieter Nautz. 2016. “The time-varying degree of inlation expectations ancho