Naércio aquiNo MeNezes-Filho José Paulo chahad hélio zylberstaJN elaiNe toldo Pazello
Resumo
Este artigo analisa, pela primeira vez na literatura, o impacto dos sindicatos de trabalhadores em vários indicadores de desempenho econômico de firmas industriais brasileiras. Realizou-se uma pesquisa ret-rospectiva sobre a densidade sindical de 1000 estabelecimentos industriais brasileiros e seus resultados foram combinados aos indicadores de desempenho econômico da Pesquisa Industrial Anual (PIA) de 1990 a 2000. Os resultados indicam que a relação entre a densidade sindical na firma e seus salários, emprego e produtividade, é não-linear, ou seja, um aumento no grau de sindicalização leva a um melhor desem-penho, porém a taxas decrescentes. Observou-se, também, uma relação negativa entre sindicalização e rentabilidade. Finalmente, estabelecimentos que introduziram mecanismos de ‘participação nos lucros’ aumentaram sua produtividade e rentabilidade no período e pagaram maiores salários nas firmas onde o grau de sindicalização era maior.
PalavRas-chave
sindicatos, produtividade, rentabilidade e salários
abstRact
This paper examines, for the first time in the literature, the impact of trade unions on various performance indicators of Brazilian establishments. A unionism retrospective survey was carried out among 1,000 es-tablishments in the manufacturing sector and its results were matched to performance indicators available from the Brazilian Industrial Surveys between 1990 and 2000. The results using the pooled data indicate that the relationship between unionism and some performance indicators, such as average wages, em-ployment and productivity is non-linear (concave), so that a rise in unionism from low levels is associated with higher performance, but at a decreasing rate. Unions also reduce profitability. Establishments that introduced profit-sharing schemes increased their productivity and profitability overall and paid higher wages in more unionized plants.
KeywoRds
unions, productivity, profitability, wages
Jel classification
J5, L25
this paper benefited from funding from the inter-american development bank under the project “the effect of unions in latin america”. We thank Gustavo Marques, Peter Kuhn, two anonymous referees and the other par-ticipants for many useful comments and suggestions. the results from the unionism survey are available from the authors upon request. the data from the industrial surveys are confidential.
ibMec-sP e Fea-usP. e-mail: : naercioamf@isp.edu.br. contact adress: rua quatá, 300, ceP: 04546-042, são
Paulo, sP.
Fea-usP. e-mails: jpchahad@usp.br; hzylbers@usp.br. Fea-rP / usP. e-mail: epazello@usp.br.
1. IntRoductIon
Economists have always been concerned about the impact of labor unions on eco-nomic performance. Studies in the ecoeco-nomics and industrial relations literature have examined the impact of union presence and density on several performance outcomes, measured at the plant, firm or industry level. These outcomes either reflect static performance, such as profitability and productivity, or dynamic efficiency, such as investments in physical capital and in R&D.
Blanchflower and Bryson (2003) survey the evidence on the union wage mark-up in many countries and find that unions are able to raise wages by significant amounts in most cases. Metcalf (2003) summarizes the recent research on the impact of union-ization on productivity, financial performance and investment in various countries and concludes that unions tend to reduce profits and harm financial performance in most cases. The effects of unionism on productivity, however, generally depend on the quality of management and trade unions, and on institutional aspects particular to each country.
Menezes-Filho and Van Reenen (2003) summarize the evidence on the relationship between unions and various technology indicators. In the U.S. unions are associated with lower R&D, innovation and productivity growth, but in Europe the evidence is more mixed. In the UK, for example, the authors uncover a negative correlation between unionism and R&D spending in the U.K., but this correlation basically disappears when cohort dummies and technological opportunities are controlled for, giving way to a concave relationship between the two variables. The differences be-tween the North-American and European studies could be related to the differences in institutions and in the scope of bargaining in the two regions.
In Latin America, there are very few econometric studies of the economic effect of unions, which is surprising given the importance of unions in shaping various economic and political outcomes in these countries. There have been some studies examining the effect of unions on wages, such as Arbache (1999), which finds that unions increase wage dispersion in Brazil, contrary to almost all studies in the devel-oped world. This highlights the need for research on the effect of unions on economic performance in Latin America, so that a better understanding of the their role can be gained and economic policies devised to improve the relationship between workers and managers.
union officers are still relatively insulated from rank-and-file pressures to represent workers’ interests. Figures from the Brazilian Labor Ministry indicate that there are about 18,000 unions in the country. It would incorrect to say that all are led by non-representative, illegitimate officers. In fact, there is an important part of the Brazilian labor movement, within CUT (the largest national umbrella organization), which advocates the signing of Convention 87. Some Brazilian unions give back to the work-ers they represent the dues collected by the government (the “Union Contribution”). Some unions fight to establish formal representation at the plant level, through work-ers councils, and to establish direct negotiations with management.
All Brazilian laborers working in formally organized firms are formally represented by a trade union. The union engages in collective bargaining at least once a year. Bargaining outcomes are automatically extended to all workers in the industry, re-gardless of the membership status of individual workers. However, trade unions do negotiate, on a plant-by-plant basis, about working conditions and practices, employ-ment levels, shifts, introduction of new machinery, etc. Therefore, we will test the hypothesis that the wages and practices defined at the industry level act as a floor (outside option) for the workers’ demands within a plant, and that a second-round bargaining process takes place within each establishment that will affect various per-formance indicators, depending on the relative bargaining power of its workers. The bargaining power depends on the union strength, which will be proxied here by union density, that is, the share of workers in each establishment that belongs to a trade union.
In sum, trade unions have played a very important role in Brazilian society, espe-cially in recent times, since the re-democratization process that took place in the early 1980s. Despite this important role played by unions in our society, there is not a single econometric study assessing the impact of unions on static and dynamic ef-ficiency in Brazil. This paper aims at starting to fill this gap.
2. EconoMEtRIc MEtHodology
In order to investigate the role of trade unions in Brazil, we estimate simple panel data econometric models such as:
it i it it it t it
Y
= α + β
Union
+ θ
Competition
+ γ
X
+ δ + ε
(1)where i refers to an establishment observed in year t, Y is the dependent variable of interest (profitability, productivity, employment or wages),
α
iis the unobserved firmfixed effect, union is a proxy for union power (e.g. union density), competition proxies for local and foreign product market competition1, and the vector X represents econo-metric controls potentially correlated with unionization and with performance indica-tors, such as market share for example.
Since we have panel data, there are many possible estimation strategies. Firstly, we pool the data over the years and estimate ordinary least squares models to have an idea of the magnitude of the union impact on different indicators of economic per-formance in Brazil and compare them with available estimates in the developed and developing world. Following Menezes-Filho et al (1998), we also try to identify non-linearities in the relationship between unionism and performance. Then, we split the sample and run separate regressions for the periods before and after the period of trade liberalization and economic stabilization, to check whether the coefficients on union density are stable over time.
In a second stage, we use the time-varying (retrospective) information on union den-sity to estimate equation (1) in long-differences, to check whether the union impact estimated in the pooled sample is robust to the inclusion of plant-level fixed-effects. We then use the information on the introduction profit-sharing schemes, also gath-ered by our survey, to check whether this policy has improved efficiency at the plant level and whether this effect differs according to union status.
In order to identify the effects of trade unions on several performance indicators we have to rely on the assumption that there are no omitted variables correlated with union density and with the performance indicators, conditionally on the other ex-planatory variables and on the fixed effects (in the panel specifications). Therefore we have to be careful before attributing a causal interpretation to the regression coef-ficients (Angrist and Krueger, 1999).
3. tHE data
The data we use in this research come from two different sources. The next two sub-sections describe the data.
3.1 annual Industrial survey (PIa)
The first source is the Brazilian Annual Industrial Survey (PIA), carried out between 1988 and 2000 by the Brazilian census bureau (IBGE).2 Firms qualify for the PIA if at least half of their revenues stem from manufacturing activity and if they are formally registered with the Brazilian tax authorities. The PIA sample of firms was constructed from three layers: a non-random sample of the largest Brazilian manu-facturers, plus a random sample of the medium firms and a non-random selection of newly founded firms. The average number of firms is 10,000 per year.3
The variables we use from the surveys are: payroll, fringe benefits, sales revenue, cost of raw materials and energy, value added, number of employees and capital stock. With these variables we constructed four performance indicators: Profitability, value added, Employment, and the average Wages (see the appendix for the description of the variables).
3.2 union survey
There is no information on unionism in the Industrial Surveys. Therefore, we pro-ceeded as in Menezes-Filho et al (1998) and carried out our own (retrospective) survey among manufacturing firms. We surveyed 1,000 manufacturing plants from different regions, mainly of medium to large size in terms of employment. The interviews were conducted by telephone, which guaranteed a high response rate of around 95%. The establishments were asked about the percentage of workers that were unionized in 2000, as well as about changes in union status between 1995-2000 (1990-1995) and about the introduction of a profit-sharing scheme. They were also asked about the degree of competition they faced in 2000 (1995), both locally and from abroad, and about changes in competition between 1995-2000 (1990-1995). The questionnaire is included in the appendix. We were able to match 285 of the surveyed plants to the Industrial Surveys conducted by IBGE.
Table 1 describes the main variables used in our empirical exercises. The data in our sample accord well with the stylized facts of the Brazilian economy in the 1990s. Productivity, profitability and real wages rose substantially between 1990 and 1993 and fluctuated with the trade cycle afterwards. Many papers attribute the rise in the values of these variables to the trade liberalization process.4 Employment in
manu-facturing declined between 1990 and 1993 and continued to decline until the end of the sample period, so that the productivity gains were obtained by maintaining the production levels constant with a smaller workforce.
taBlE 1 – dEscRIPtIvE statIstIcs
Years Employment Real Wages Labor Productivity
Proitability N
1990 990 860.57 55,681.46 0.29 229
(1488) (516,89) (70,836.19) (0.32)
1992 874 969.46 86,534.19 0.41 257
(1350) (596.65) (130,181.70) (0.27)
1993 850 1,058.23 92,123.06 0.40 258
(1219) (730.55) (114,284.90) (0.30)
1994 876 1,012.95 91,138.07 0.42 274
(1245) (681.88) (133,958.70) (0.23)
1995 838 1,170.82 69,189.29 0.26 265
(1135) (750.15) (101,222.90) (0.25)
1996 634 1,378.31 80,032.33 0.32 276
(891) (861.43) (108,138.40) (0.22)
1997 600 1,412.54 87,559.24 0.32 221
(910) (871.79) (119,748.00) (0.22)
1998 569 1,443.24 86,568.44 0.31 274
(891) (983.13) (115,925.60) (0.23)
1999 558 1,257.65 91,333.84 0.32 239
(937) (747.66) (134,067.10) (0.23)
2000 603 1,125.55 79,445.58 0.29 236
(1050) (718.19) (115,264.70) (0.29)
Average 740 1,170.94 82,167.77 0.34 2529
90-00 (1135) (781.53) (116,269.70) (0.26)
Source: annual Industrial survey (PI a) – IBgE. For definitions of the variables, see text. Standard Deviations are in brackets.
Table 2 tabulates the results of the survey in terms of union presence over our sample period. It shows that about half of the establishments have less than 25% of their
workforce unionized, with the other half split among the other quartiles of union density, which means that there is enough variation in union density to identify its effects on economic performance. With respect to changes over time, Table 3 shows that many firms experienced changes in union density amongst their employees, with 10% reporting a rise in union density between 1995 and 2000, 58% reporting stability and 32% reporting a reduction. The percentages between 1990 and 1995 are similar to these.
taBlE 2 – unIon dEnsIty In 2000
Density Frequency
Den <25% 50%
25%< Den <=50% 22.7% 50%< Den <=75% 13.4%
Den >75% 13.8%
Number of Firms 285
taBlE 3 – cHangEs In unIon dEnsIty
1990-1995 1995-2000
Increase in Density 11.1% 9.9%
Constant Density 60.4% 57.8%
Decline in Density 28.4% 32.2%
Number of Firms 285 285
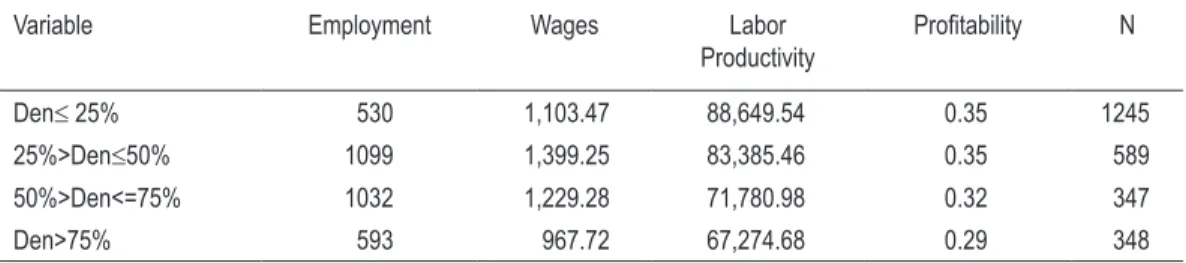
Table 4 compares the mean outcomes across establishments with different levels of unionization. In terms of employment and average wages, one can note that there is a non-linear (concave) relationship with the percentage of workers unionized in 2000. These variables tend to rise with unionization up to a certain level and decrease there-after, while productivity and profitability decline continuously with unionization.
taBlE 4 – avER agE PERFoR M ancE By unIon dEnsIty
Variable Employment Wages Labor Productivity
Proitability N
Den≤ 25% 530 1,103.47 88,649.54 0.35 1245 25%>Den≤50% 1099 1,399.25 83,385.46 0.35 589 50%>Den<=75% 1032 1,229.28 71,780.98 0.32 347
Den>75% 593 967.72 67,274.68 0.29 348
4. tHE REsults
4.1 Pooled sample
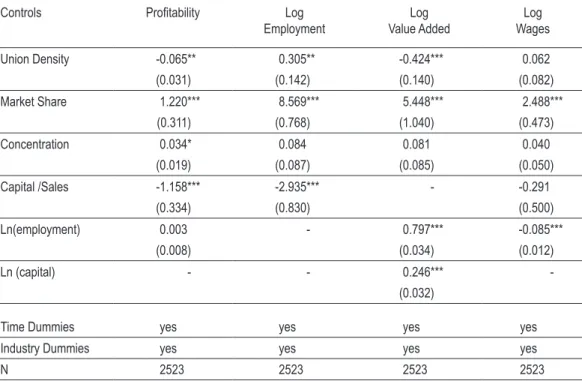
Table 5 presents the results of the levels regressions, using the 1990-2000 pooled data. All models were estimated using a random-effects procedure, which takes into account the presence of serial correlation induced by persistent establishment-specific effects and a set of two-digit industry dummies. It is important to note that the union density variable is fixed in 2000, that is, it does not vary over time. Therefore, this variable in included to capture the strength of union power in the firm, and we as-sume that this strength does not vary a lot over time.
taBlE 5 – lEvEls REgREssIons – 1990-2000
Controls Proitability Log Employment
Log Value Added
Log Wages
Union Density -0.065** 0.305** -0.424*** 0.062 (0.031) (0.142) (0.140) (0.082)
Market Share 1.220*** 8.569*** 5.448*** 2.488*** (0.311) (0.768) (1.040) (0.473)
Concentration 0.034* 0.084 0.081 0.040
(0.019) (0.087) (0.085) (0.050)
Capital /Sales -1.158*** -2.935*** - -0.291
(0.334) (0.830) (0.500)
Ln(employment) 0.003 - 0.797*** -0.085***
(0.008) (0.034) (0.012)
Ln (capital) - - 0.246***
-(0.032)
Time Dummies yes yes yes yes
Industry Dummies yes yes yes yes
N 2523 2523 2523 2523
Source: PIa – IBgE. Random-Effects Regression. Standard Errors (robust to heteroscedasticity) are in brackets. * Denotes statistically significant at the .10 level; **at the .05 level; ***at the .01 level.
for market share, market concentration,5 employment, capital intensity and sector
dummies. It is interesting to note that both market share and market concentration positively impact profitability, suggesting the importance of both the efficiency and the market power considerations in the Brazilian industry.
In terms of employment, a positive and significant coefficient is reported in column (2), suggesting that unionized plants employ more people, even conditionally on market share, capital intensity and the sector dummies. In terms of value added, the results in column (3) indicate that more unionized plants produce less output, given the levels of employment and capital, than less unionized ones. It is also interesting to note that market share has a positive impact on productivity, but concentration does not, implying a cost-based interpretation for this market share effect. In terms of average wages, column (4) shows the impact of union density is positive but not significant at conventional levels. It is interesting to point out, however, that both market share and employment attract positive and significant coefficients in the wage equations. This provides evidence of a noncompetitive wage determination process, in particular of rent- sharing.
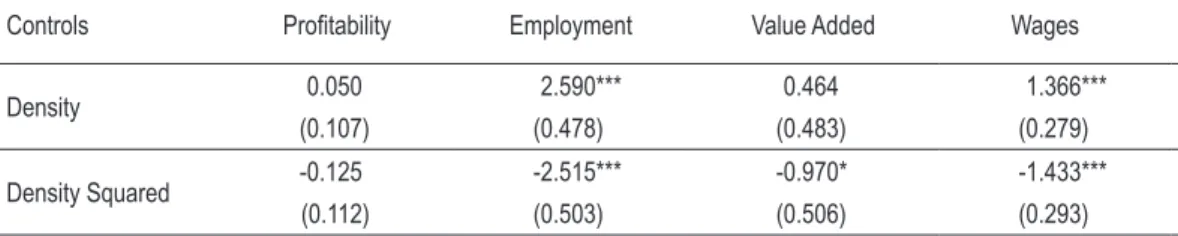
The models so far imposed the restriction that the relationship between unionization and performance is linear (or log-linear), but both the descriptive statistics presented in Table 4 and the results of Menezes-Filho et al (1998) suggest a non-linear rela-tionship between union density and the performance indicators. Therefore, in Table we include union density squared as an additional explanatory variable in all the specifications. The results of the random-effects specifications show that the non-linear specification fits the data better in the cases of employment, value added and average wages, while it does not in the case of profitability.7
taBlE 6 – lEvEls REgREssIons – non-lInEaR dEnsIty -1990-2000
Controls Proitability Employment Value Added Wages
Density 0.050 2.590*** 0.464 1.366***
(0.107) (0.478) (0.483) (0.279)
Density Squared -0.125 -2.515*** -0.970* -1.433*** (0.112) (0.503) (0.506) (0.293)
Source: PIa – IBgE. Random-Effects Regression. Standard Errors (robust to heteroscedasticity) are in brackets. All controls of Table 5 are included in the regressions. * Denotes statistically significant at the .10 level; **at the .05 level; ***at the .01 level.
5 The concentration measure we use is based on our survey. The managers were asked whether they face more than 5 competitors in their market (see appendix).
See Slade (2004).
In the case of employment, the results imply that it increases up to a union density of about 50%, declining after that.8 Some unionism also seems to be good for the plants’ productivity, but when union density reaches about 30%, productivity starts to decline, and after 50% of the employees are unionized, productivity is lower on average than in non-unionized establishments. A similar phenomenon occurs with average wages, as the impact of unionism reaches its maximum when approximately half of the plant’s workforce is unionized and is actually lower than in non-unionized plants when all workers belong to a trade union.
One explanation consistent with these findings is that wages and employment depend on the plant’s performance, and the presence of trade unions facilitates, to a certain point, communication between workers and managers, increasing efficiency and pro-ductivity (Freeman and Medoff, 1979). When unions have too much power, however, they impede the introduction of new technologies and lead to the deterioration of all performance indicators.
4.2 the union Effect over time
In a period of significant changes in the economic environment, it is important to test for the stability of the estimated coefficients over time. Brazil (like other Latin American countries) has been subject to many macroeconomic shocks in recent de-cades. In the early 1990s a drastic trade liberalization process took place, with trade tariffs declining from an average of 57.5% in 1988 to about 15.% in 1995. Moreover, inflation in Brazil was very high and volatile in the beginning of the 1990s, before being drastically reduced by the “Real plan” introduced in 1994.
In order to examine the stability of the union effect over time, we estimate O.L.S. regressions before and after the reforms, with the four performance indicators as de-pendent variables. The results are presented in Table 7.9 Column (1) shows that that the estimated union impact on profitability differs substantially between the two pe-riods. Before 1994, the coefficients of the union terms were statistically insignificant, while after stabilization a non-linear relationship between unionism and profitability emerges. One explanation consistent with this finding is that in periods of high and volatile inflation, relative prices fluctuate substantially, so that the bargaining pro-cess between unions and management can always be solved through price hikes (see Amadeo, 1994). The non-linear relationships between employment and unionization and between average wages and union density, on the other hand, are quite stable over
8 About 24% of plants have densities higher than that.
time. With respect to value added, no clear relationship with union density is notice-able before 1994, whereas after stabilization the non-linear pattern is also evident.
taBlE 7 – tHE unIon EFFEct ovER tIME
Proitability Employment Value Added Wages
1990-1994
Density -0.203 1.848*** -0.217 1.275***
(0.154) (0.616) (0.526) (0.311)
Density2 0.156 -1.655*** -0.148 -1.307***
(0.161) (0.651) (0.550) (0.327)
1995-2000
Density 0.213 2.990*** 0.919 1.266***
(0.120) (0.521) (0.604) (0.294)
Density2 -0.294 -3.019*** -1.474** -1.353***
(0.126) (0.547) (0.631) (0.308)
Note: source: PIa – IBgE; Standard Errors (robust to heteroscedasticity) are in brackets. All controls of Table 5 are included in the regression. * Denotes statistically significant at the .10 level; **at the .05 level; ***at the .01 level.
4.3 long-differences Equations
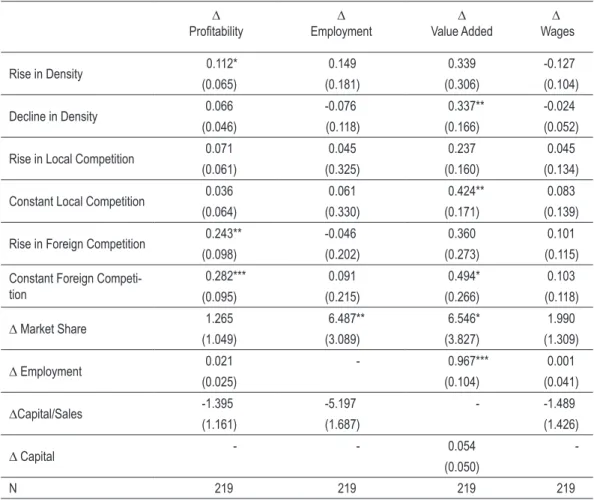
Tables 8 and 9 report the results of regressions that use the change in union density10 as the main explanatory variable for the changes in the performance measures over 1995-2000 and 1990-1995, respectively. The aim of these exercises is to examine the robustness of the previous results to the control of the plant-specific time-invariant fixed-effects. The results of Table 8 show that the estimates tend to have very large standard errors, so that most of the union effects were imprecisely estimated. An important exception is the positive impact of the reduction in union density between 1995-2000 on productivity growth, which is in line with the levels’ results. It is also important to point out the positive impact of the rise in competition, both from for-eign and local producers, on profitability and productivity, and the positive effect of market share on productivity.
The standard errors in Table 9 also tend to be large, but the negative impact of the rise in union density between 1990-1995 on profitability growth is precisely estimat-ed. The positive effect of the rise in foreign competition on employment growth and its negative effect on average wages are also worth highlighting. Changes in market share again positively affect employment, productivity and wages, which reinforces
the results obtained in the levels specifications. The large standard errors could be the result of measurement errors, which are magnified in differences specification (Freeman, 1984), and the effects of trade unions are notoriously difficult to be cap-tured in first-differences specifications (see Hirsch, 1991 and Bronars, Deere and Tracy, 1994).
taBlE 8 – long –dIFFEREncEs: 2000-1995
∆
Proitability Employment∆
∆
Value Added
∆
Wages
Rise in Density 0.112* 0.149 0.339 -0.127
(0.065) (0.181) (0.306) (0.104)
Decline in Density 0.066 -0.076 0.337** -0.024 (0.046) (0.118) (0.166) (0.052)
Rise in Local Competition 0.071 0.045 0.237 0.045 (0.061) (0.325) (0.160) (0.134)
Constant Local Competition 0.036 0.061 0.424** 0.083 (0.064) (0.330) (0.171) (0.139)
Rise in Foreign Competition 0.243** -0.046 0.360 0.101 (0.098) (0.202) (0.273) (0.115)
Constant Foreign Competi-tion
0.282*** 0.091 0.494* 0.103
(0.095) (0.215) (0.266) (0.118)
∆ Market Share 1.265 6.487** 6.546* 1.990
(1.049) (3.089) (3.827) (1.309)
∆ Employment 0.021 - 0.967*** 0.001
(0.025) (0.104) (0.041)
∆Capital/Sales -1.395 -5.197 - -1.489
(1.161) (1.687) (1.426)
∆ Capital - - 0.054
-(0.050)
N 219 219 219 219
taBlE 9 – long –dIFFEREncEs: 1995-1990
∆
Proitability Employment∆
∆
Value Added
∆
Wages
Rise in Density -0.155** 0.083 -0.094 0.065 (0.069) (0.091) (0.216) (0.081)
Decrease in Density -0.018 -0.059 -0.031 0.128** (0.056) (0.067) (0.151) (0.063)
Rise in Local Competition 0.009 0.209 -0.080 0.025 (0.077) (0.189) (0.234) (0.135)
Constant local Competition 0.082 0.161 0.054 -0.022 (0.079) (0.189) (0.228) (0.137)
Rise in Foreign Competition -0.103 0.293** -0.403 -0.297*** (0.128) (0.087) (0.324) (0.106)
Constant Foreign Competition
-0.081 0.347*** -0.399 -0.313** (0.128) (0.110) (0.308) (0.112)
∆ Market Share 1.331 2.132* 6.677** 3.578*** (1.542) (1.176) (2.767) (0.932)
∆Employment 0.005 0.342 -0.338***
(0.059) (0.142) (0.086)
∆Capital/Sales -1.397 1.656 - -1.235
(1.318) (1.156) (1.275)
∆Capital - - -0.029
-(0.052)
N 218 218 216 218
Note: source: PIa – IBgE; Standard Errors (robust to heteroscedasticity) are in brackets. * Denotes statisti-cally significant at the .10 level; **at the .05 level; ***at the .01 level.
taBlE 10 - PRoFIt sHaRIng: long dIFFEREncEs - 2000-1995
∆
Proitability Employment∆
∆
Value Added
∆
Wages
Introduction of
Proit Sharing
0.102** 0.169 0.283* 0.024
(0.040) (0.117) (0.158) (0.055)
4.4 the Introduction of Profit sharing
The managers of the establishments were also asked about the introduction of profit-sharing schemes, which was officially permitted by labor legislation in 1995. The results in Table 11 indicate that the introduction of profit sharing is associated with a rise in all performance indicators, with statistically significant effects on profitability and productivity. The results must be interpreted with caution, however, since we do not know the exact year when the policy was introduced, so that it is difficult to attribute a causal interpretation to these relationships, which should be seen as pre-liminary findings.
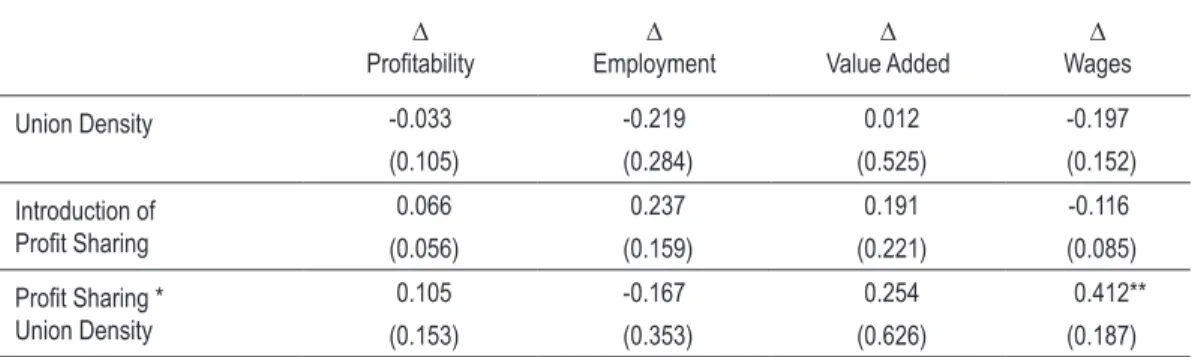
taBlE 11 - PRoFIt sHaRIng and unIonIZatIon - long dIFFEREncEs - 2000-1995
∆
Proitability Employment∆
∆
Value Added
∆
Wages
Union Density -0.033 -0.219 0.012 -0.197
(0.105) (0.284) (0.525) (0.152)
Introduction of
Proit Sharing
0.066 0.237 0.191 -0.116
(0.056) (0.159) (0.221) (0.085)
Proit Sharing *
Union Density
0.105 -0.167 0.254 0.412**
(0.153) (0.353) (0.626) (0.187)
Source: PIa – IBgE; Standard Errors (robust to heteroscedasticity) are in brackets. All controls of table 9 are also included. * Denotes statistically significant at the .10 level; **at the .05 level; ***at the .01 level.
It is possible that the effects of the introduction of profit sharing depend on the degree of unionization in the establishment (see Black and Lynch, 2001, for some evidence along this line for the U.S.). The results of Table 11 show that this occurred with average wages, so that more unionized firms had a trajectory of lower wages on average than less unionized ones, but this was counterweighted in the unionized firms that introduced profit sharing schemes.
5. conclusIons
first rise with union density up to a certain density level (usually about 50%) and then start to decline. These results indicate that some unionism may be good for the plants’ economic performance, although too much unionism may have negative effects.
It seems that the union effect on profitability and productivity changed after the economic reforms introduced in the early 1990s, but the union impacts on wages and employment were quite stable over time. The union effects on profitability and pro-ductivity growth were also observed in long-differences specifications, which control for establishment fixed-effects.
There is also evidence that the introduction of profit-sharing schemes was associated with an improvement in performance, both in terms of productivity and profitabil-ity. This impact was no different among unionized firms, but profit sharing only improved average wages in more unionized establishments.
REFEREncEs
Amadeo, E. Institutions, inflation and unemployment. London: Edward Elgar, 1994.
Arbache, J. Do unions always decrease wage dispersion? The case of Brazilian manu-facturing. Journal of labor Research, vol. 20, Summer 1999.
Black, S.; Lynch, L. How to compete: the impact of workplace practices and infor-mation technology on productivity. Review of Economics and statistics, August 2001.
Blanchflower, D.; Bryson, A. Changes over time in union relative wage effects in the UK and the USA revisited, In: Addison; Schnabel (eds). International Handbook of trade unions, Cheltenham: Edward Elgar, 2003.
Bronars, S.; Deere, D.; Tracy, J. The effects of unions on firm behavior: an empirical analysis using firm-level data”, Industrial Relations, v.33, n. 4, 1994.
Fallick, B.; Hassett, K. Investment and union certification. Journal of labor Econom-ics, v. 17, n. 3, 1999.
Ferreira. P.; Rossi, J. New evidence from Brazil on trade liberalization and productiv-ity growth. International Economic Review, v. 44, 2003.
Freeman, R. Longitudinal analysis of the effect of trade unions. Journal of labor Economics, v. 2, n. 1, 1984.
Freeman, R ; Medoff . What do unions do? New York: Basic Books, 1979.
Menezes-Filho, N.; Ulph, D.; Van Reenen, J. R&D and unionism: comparative evi-dence from British companies and establishments. Industrial and labor Relations Review, v. 52, n. 1, 1998.
Menezes-Filho, N.; Van Reenen, J. Unions and innovation: a survey of the theory and empirical evidence. In: Addison; Schnabel (eds) International Handbook of trade unions. Cheltenham: Edward Elgar, 2003.
Metcalf, D. Unions and productivity, financial performance and investment: inter-national evidence. In: Addison; Schnabel (eds). International Handbook of trade unions, Cheltenham: Edward Elgar, 2003.
Mishel, L. Voos, P. unions and Economic competitiveness. Armonk, NY and New York: ME Shape, 1992.
Muendler, M. trade, technology, and productivity: a study of Brazilian manufacturers, 1986-1998. UCSD, unpublished monograph, 2004.
Slade, M. Models of firm profitability. International Journal of Industrial organiza-tion, v. 22, n. 3, 2004.
aPPEndIx 1. QuEstIonnaIRE
Company Name: _______________________________________________
Address: ______________________________________________________
State: ID: ____________________________________________________
Phone: Fax: ___________________________________________________
Contact:_____________ Position: _______________ E -mail: __________
Sector of Activity _______________________________________________
QuEstIonnaIRE
1. When was this establishment set up? _Before 1990
_Between 1990 and 1995 _After 1995
2. How many employees did this establishment have in December 2000?
3. Between 1995 and 2000 (1990 and 1995) did the number of employees: _Decline
_Stay the same _Rise
4. In December 2000 what percentage of your employees were trade union members?
5. Between 1995 and 2000 (1990-1995) did the percentage of union membership: _Decline
_Stay the same _Rise
6. Does this establishment have a profit sharing scheme? _No
_Yes. Introduced between 1995 and 2000?
7. How many direct competitors does this establishment face in the product mar-ket?
_None
_Fewer than 5 _More than 5
8. Did the competition from local producers between 1995 and 2000 (1990-1995): _Decline
9. Did the competition from foreign producers between 1995 and 2000 (1990-1995):
_Decline _Stay the same _Rise
aPPEndIx 2. constRuctIon oF PERFoRMancE vaRIaBlEs
Profitability: Total sales revenue (appropriately deflated) minus the cost of raw ma-terials. capital depreciation and energy and other inputs.
Productivity: Total sales revenue (appropriately deflated) minus the cost of raw ma-terials. capital depreciation and energy and other inputs.
employment: Total number of employees in December of each year.