Escola Superior de Saúde Egas Moniz
Mestrado em Biologia Molecular em Saúde
Purification of antimicrobial peptides secreted by Saccharomyces
cerevisiae and proteomic analysis of cell membrane-associated
proteins
Lara Andreia Brito dos Santos
Supervisor
Maria Gabriela Machado de Almeida, PhD
Co-supervisor
Maria Helena Whytton da Terra Soares de Albergaria, PhD
Thesis submitted to Escola Superior de Saúde Egas Moniz to attain the Master Degree on Molecular Biology in Health
2
Agradecimentos
Em primeiro lugar, gostaria de agradecer à Professora Doutora Maria Gabriela Almeida pela oportunidade em participar neste projecto, pela sua orientação e pelos valiosos conhecimentos que me transmitiu para a realização deste trabalho.
Em segundo lugar, gostaria de expressar a minha gratidão à Doutora Helena Albergaria pela partilha dos seus preciosos ensinamentos e conhecimentos a nível científico, mas acima de tudo, pelo seu incansável apoio, pela disponibilidade e pela imensa compreensão que demonstrou ao longo deste tempo e que me motivaram a continuar e a não desistir. Agradeço-lhe, ainda, pelas valiosas correcções deste
trabalho e pelas suas carinhosas “chamadas de atenção”: “Oh moça, a cabecinha serve para pensar!”.
À Professora Doutora Alexandra Maia e Silva, coordenadora do mestrado de Biologia Molecular em Saúde, que sempre se mostrou disponível para me receber e que demonstrou uma enorme compreensão em relação a todos os dilemas profissionais e pessoais por que passei.
Ao Doutor Francisco Gírio, director da Unidade de Bioenergia do LNEG, pela disponibilidade deste espaço para a realização deste projecto.
Ao Doutor José Moura e à Doutora Isabel Moura, dos grupos BIOIN/BIOPROT da FCT, UNL, pela cedência do espaço no laboratório para a realização desta tese.
Gostaria de agradecer à mestre Patrícia Branco pelo apoio e pela transmissão de conhecimentos.
Em especial à Mestre Diana Francisco por ter-me ensinado tudo o que sei de microbiologia, pela sua orientação incansável ao nível de bancada, pela paciência que demonstrou em relação aos meus erros de principiante numa área para mim, até então, completamente desconhecida. Agradeço os bons e alegres momentos por que passámos dentro e fora do laboratório e não esquecerei a forma carinhosa como me tratava por “Larinha”.
3
Agradeço à Doutora Célia Silveira por todo o conhecimento a nível científico na área da proteómica transmitido e pelo esclarecimento das variadíssimas dúvidas que me surgiram durante o trabalho.
Gostaria de agradecer em especial à Mestre Joana Sousa por toda a orientação ao nível de bancada na área da proteómica, foi a pessoa a quem recorri várias vezes e que sempre se mostrou disponível para me ajudar em todas as questões. Agradeço o apoio, o companheirismo e a compreensão que sempre demonstrou. Tornou-se uma boa amiga.
Aos colegas de laboratório e de gabinete: Luís Fonseca, Raquel Amador, Francisco Oliveira e Tiago Monteiro pela sua disponibilidade em ajudar-me sempre que precisei e pelas questões debatidas sobre os projectos que alargaram o meu conhecimento e ajudaram-me a compreender melhor o meu próprio trabalho.
Aos restantes membros do grupo BIOIN/BIOPROT por todo o apoio técnico e científico oferecido.
Aos meus amigos pelo seu apoio, pelo seu afecto e pela sua verdadeira amizade. Estiveram sempre presentes nas alturas mais difíceis por que passei ao longo deste tempo. À Lucy Calisto da Silva, que me conhece melhor do que ninguém, pelo seu afectuoso “Loquitas” e por ser uma grande e carinhosa amiga, a minha cúmplice. À Ana Carina Julião pela preocupação, pela atenção e pelo carinho que sempre demonstrou e pelo alento que me deu a sua constante presença. Ao Miguel Marreiro, pelos raros mas sábios conselhos e por ser aquela figura serena e silenciosa que me reconfortava sempre que desabafava os meu problemas. Aos bons momentos que passámos juntos. Muitos estarão, ainda, por vir!
Ao M. por tudo o que passámos juntos.
Aos meus queridos pais. Ao seu amor, à sua amizade, ao seu carinho. Por serem o meu porto de abrigo, os meus pilares. Pela educação que me deram, pelos valores que me transmitiram e pela oportunidade de ter uma formação superior, apesar de todas as dificuldades por que passaram. Pelo seu apoio durante toda a minha vida. Acreditaram sempre em mim.
4
Resumo
Durante fermentações vínicas efectuadas com culturas mistas, a levedura Saccharomyces cerevisiae liberta péptidos antimicrobianos, que derivam da enzima gliceraldeído 3-fosfato desidrogenase (GAPDH) e provocam a morte prematura de leveduras não-Saccharomyces. Considerando o potencial destes péptidos antimicrobianos para serem usados como conservantes naturais do vinho, o primeiro objectivo deste trabalho consistiu na sua produção e purificação a uma escala preparativa, de forma a poderem ser aplicados em fermentações de adega. Primeiramente, produziram-se 3 L de sobrenadantes de fermentações efectuadas com S. cerevisiae que, em seguida, foram sujeitos a uma cromatografia de troca iónica utilizando um coluna preparativa DEAE-Sephadex. Foi obtida uma fracção bioactiva que exibia um perfil cromatográfico semelhante ao exibido pelos péptidos antimicrobianos previamente identificados. Embora tenha sido possível purificar os referidos péptidos com a coluna cromatográfica preparativa, os resultados deste trabalho mostraram que o sistema cromatográfico utilizado não foi suficientemente eficiente para isolar os péptidos de interesse num único passo. Assim propõe-se que de futuro se utilize um passo adicional de cromatografia de exclusão molecular que permita isolar a fração péptica (proteínas <10 kDa) antes da utilização da coluna de troca iónica.
5
exibindo pesos moleculares e pontos isoeléctricos muito semelhantes ao dos péptidos bioactivos previamente identificados. Para além disso, no proteoma das células crescidas durante 48 h os referidos spots mostraram estar sobre-expressos. Os referidos spots foram analisados por espectrometria de massa, o que confirmou a presença de péptidos derivados do GAPDH. Assim, este trabalho forneceu evidência experimental de que a morte de leveduras não-Saccharomyces por contacto célula-a-célula com S. cerevisiae pode resultar da presença dos péptidos antimicrobianos derivados do GAPDH. Porém, para confirmar definitivamente esta hipótese serão necessários ainda estudos futuros.
6
Abstract
Saccharomyces cerevisiae secretes antimicrobial peptides (AMPs) during mixed culture fermentations that are derived from the glyceraldehyde 3-phosphate dehydrogenase (GAPDH) enzyme and induce the early death of non-Saccharomyces yeasts. Considering the potential of AMPs to be used as natural preservatives in wine, the first aim of the present work was to produce and purify them in a preparative scale so that they could be applied in winery fermentations. Firstly, we produced 3 L of S. cerevisiae fermentation supernatants and subjected those to ion-exchange chromatography using a preparative DEAE-Sephadex column. One bioactive fraction, exhibiting a chromatographic profile similar to that exhibited by the previously found AMPs, was obtained. However, our work showed that the chromatographic system used was not fully efficient to purify the AMPs in a single step, requiring an additional size-exclusion chromatographic step.
Several studies have shown that early death of non-Saccharomyces yeasts during wine fermentations is induced by S. cerevisiae through cell-cell contact and secretion of AMPs. Moreover, unpublished work showed that S. cerevisiae cells pre-grown for 48 h are able to induce death of Hanseniaspora guilliermondii by cell-cell contact, while 12 h-grown cells are not. Considering these findings and knowing that GAPDH is a cell wall-associated protein in S. cerevisiae, we hypothesized that these AMPs could be present in the membranes of S. cerevisiae and in this way induce death of non-Saccharomyces by cell-cell contact. The second aim of our work was to analyze membrane proteins of S. cerevisiae cells grown for 12 h and 48 h, using two dimensional polyacrylamide gel electrophoresis. Proteomic analysis revealed the presence of two spots of molecular weight and isoelectric point similar to the previously found AMPs, which were differentially expressed in the two growth stages. The spots were analysed by mass spectrometry, confirming the presence of GAPDH-derived peptides. Thus, our work raised evidence that death of non-Saccharomyces yeasts by cell-cell contact might be due to the presence of GAPDH-derived AMPs in the membranes of S. cerevisiae cells. However, to definitively confirm this hypothesis further work is required.
7
Table of contents
Agradecimentos ... 2
Resumo ... 4
Abstract ... 6
Table of contents ... 7
Figure Index ... 9
Table Index ... 11
Abbreviations ... 12
1 Introduction ... 14
1.1 Winemaking process and alcoholic fermentation ... 14
1.1.1 Microorganisms associated with winemaking ... 15
1.1.2 Yeast population dynamics during wine fermentations ... 16
1.1.3 Lactic acid bacteria and the malolactic fermentation ... 18
1.1.4 Factors underlying dominance of Saccharomyces cerevisiae ... 19
1.2 Antimicrobial peptides: their nature, function and mode of action ... 22
1.2.1 Purification methods of AMPs ... 23
1.2.2 Characterization of AMPs ... 27
1.3 Proteomic analysis of Saccharomyces cerevisiae during wine fermentations 28 1.3.1 2D-PAGE ... 28
1.3.2 Saccharomyces cerevisiae proteome and surfome analysis ... 29
2 Materials and methods ... 36
2.1 Microorganisms... 36
2.2 Culture media and inocula ... 36
2.3 Purification of antimicrobial peptides (AMPs) secreted by S. cerevisiae during alcoholic fermentation ... 37
2.3.1 Production of alcoholic fermentations supernatants ... 37
2.3.2 Purification of the AMPs from the fermentation supernatants using a preparative anion-exchange column ... 38
2.3.3 Antimicrobial activity of the protein fractions obtained in the preparative anion-exchange DEAE-Sephadex column ... 39
8
2.4 Proteomic analysis of the cell wall-associated proteins (surfome) of S.
cerevisiae cells during alcoholic fermentation ... 40
2.4.1 Extraction of S. cerevisiae cell-wall associated proteins ... 40
2.4.2 Two dimensional polyacrylamide gel electrophoresis ... 42
3 Results and discussion ... 44
3.1 Purification of antimicrobial peptides from wine fermentation supernatants 44 3.1.1 Production of supernatants from alcoholic fermentations ... 44
3.1.2 Purification of the AMPs from the fermentation supernatants using a preparative anion-exchange column ... 46
3.1.3 Antimicrobial activity of the protein fractions obtained in the preparative anion-exchange DEAE-Sephadex column ... 49
3.1.4 Analysis of the bioactive fractions obtained in the preparative DEAE-Sephadex column by gel filtration and ion-exchange chromatography ... 52
3.2 Proteomic analysis of membrane-proteins of S. cerevisiae cells grown for 12 and 48 h ... 55
4 Final remarks and future work ... 63
5 Bibliography ... 66
Appendix 1 – Relative volumes of intensity of spots ... 75
Appendix 2 – Statistical analysis ... 82
Appendix 3 – Relative molecular masses of the spots ... 83
9
Figure Index
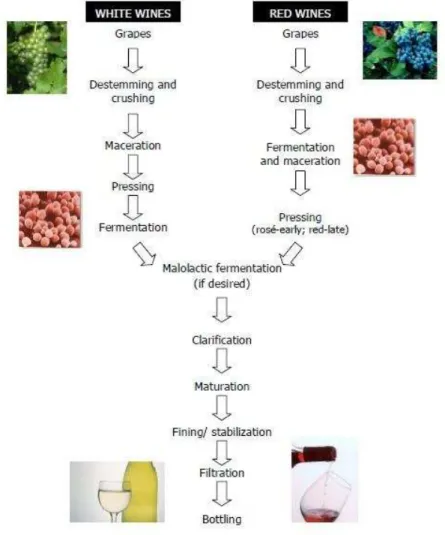
Figure 1.1 – The main steps of wine production (Pretorius, 2000)………...15
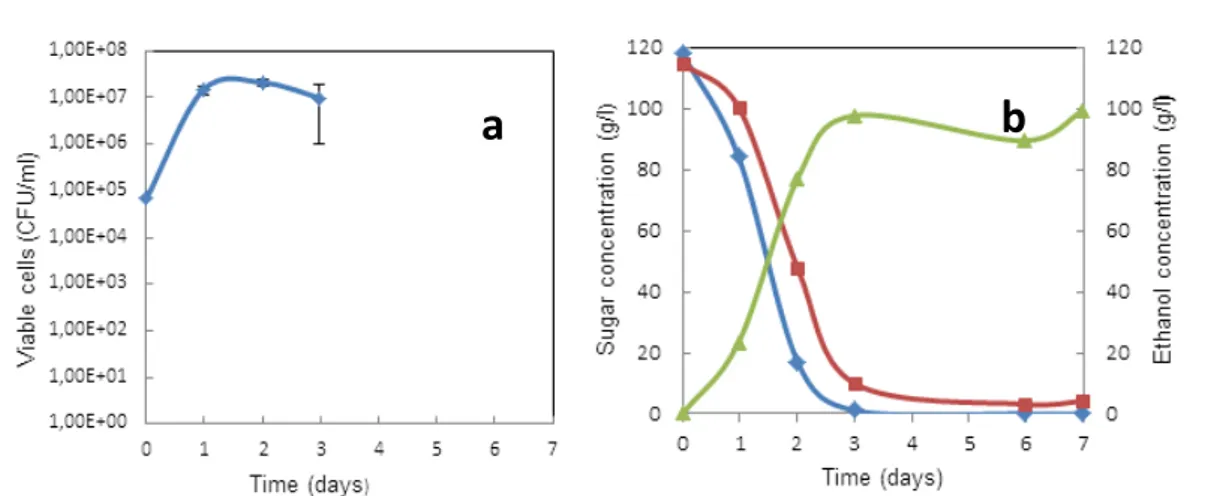
Figure 3.1 - Viable cells of S. cerevisiae (a) and sugars consumption (blue filled diamonds – glucose; red filled squares-fructose) and ethanol production (green filled triangles) (b) during alcoholic fermentation. Data presented are mean values of three
independent experiments………45
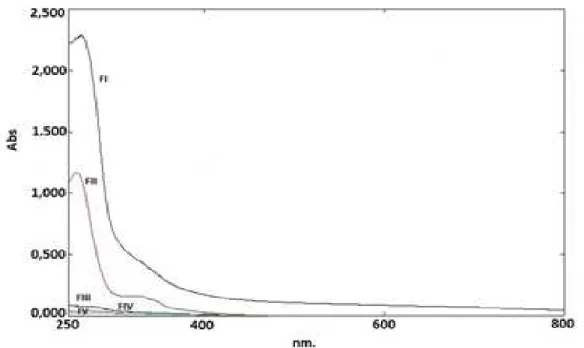
Figure 3.2 - Absorbance spectra (UV-visible) of the supernatant protein fractions FI, FII, FIII, FIV and FV collected from the DEAE-Sephadex ion-exchange
chromatographic column………47
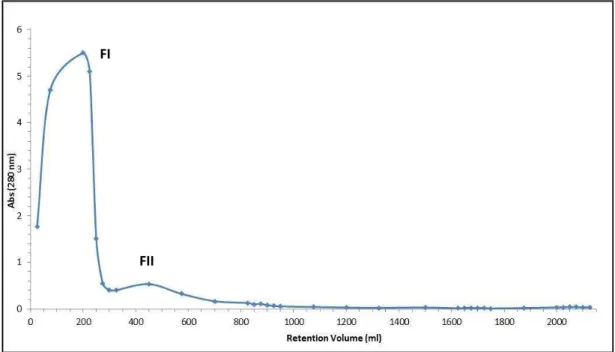
Figure 3.3 - Chromatogram of the protein fractions collected from the DEAE-Sephadex chromatographic column. Sample: 500 ml of alcoholic fermentation supernatant (diluted 1:2; pH=8.0).Gradient elution of 2 mM-2 M ammonium acetate.
Absorbance at 280 nm………48
Figure 3.4 - Optical density of H. guilliermondii cultures in the antimicrobial tests performed using fractions FS (red filled squares), FI (green filled triangles), FII (purple filled circles), F85 (yellow filled dots) and control (blue filled diamonds) in YEPD medium at pH 3.5. Absorbance measurements ate 590 nm. Data presented are mean values of three independent assays...51
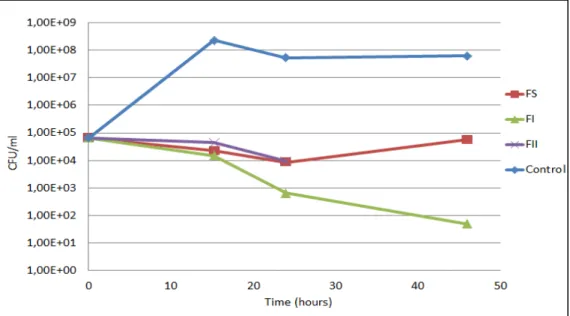
Figure 3.5 - Viable cell profiles of H. guilliermondii during the antimicrobial tests performed with fractions FS (red, filled squares), FI (green, filled triangles), FII (purple, crosses) and control (blue, filled diamonds) in YEPD medium at pH 3.5....51 Figure 3.6 - Chromatographic profiles of FS (red), FI (green) and 2-10 kDa fractions (blue) fractionated by HPLC gel filtration using a Superdex Peptide column. Elution of the fractions with 0.1 M ammonium acetate at a flow rate of 0.7 ml/min.
Absorbance measured at 280 nm...52
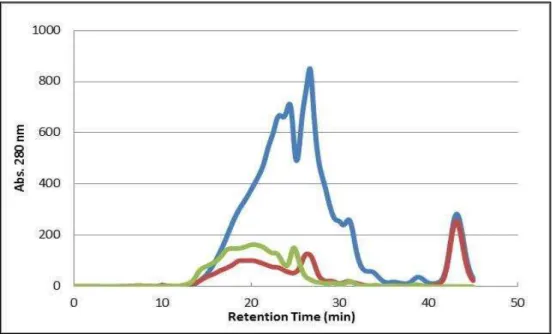
Figure 3.7 - Chromatographic ion-exchange (Q-Resource column) profiles of the 8.0 kDa fractions (F8) obtained from gel filtration of the three bioactive fractions: F8 [FS] (red); F8 [FI] (green) and F8 [2-10 kDa] (blue). Elution of the fractions using a gradient of ammonium acetate (ranging from 5–500 mM) at a flow rate of 1 ml/min. Absorbance measured at 280 nm...53
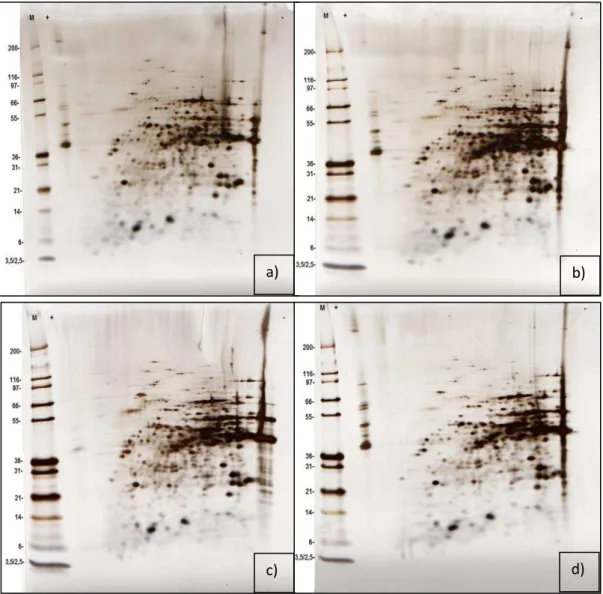
Figure 3.8 - 2D-PAGE map of S. cerevisiae membrane-associated proteins extracted from cells grown for 12 h (a, b are replicates). 35 µg of protein sample. IPG strip 4-7 pH gradient, 7 cm. 4-12% Bis-Tris gel. Gels were silver stained. 1x MES running buffer. M– molecular weight marker (kDa). + acidic end; - basic end...56 Figure 3.9 - 2D-PAGE map of S. cerevisiae membrane-associated proteins extracted from cells grown for 48 h (a, b are replicates; c is a replicate with addition of
10
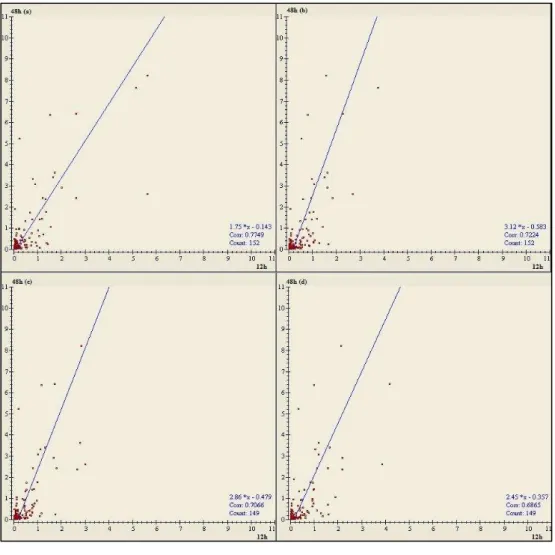
gels were silver stained. 1x MES running buffer. M– molecular weight marker (kDa). + acidic end; - basic end………..56 Figure 3.10 - Scatter plots of 2DEgels………...58
Figure 3.11 a, b – 2DE gels of S. cerevisiae membrane-associated proteins extracted from cells grown for 12 h and at 48 h, respectively.Spots 1- identified as GAPDH and spots 2, 3 identified by MALDI-TOF/TOF as GAPDH-derived AMPs………..59 Figure 3.12 - 2D-PAGE map of S. cerevisiae membrane-associated proteins
extracted from cells grown for 12 h. IPG strip 4-7 pH gradient, 7 cm. Silver stained 4-12% Bis-Tris gel a ) without addition of GAPDH; b) with GAPDH and c) with GAPDH and GAPDH as molecular marker. M– molecular weight marker………..60 Figure A.1 Spot 1 - GAPDH is not in the statistical analysis; spot 2 is not
overexpressed; spot 3 is overexpressed………..82
Figure A.2 Relative molecular masses of spots 1, 2, 3 in 2DE gel of membrane proteins extracted from cells at 12 h of growth. Replicate a)……….83
Figure A.3 Relative molecular masses of spots 1, 2, 3 in 2DE gel of membrane proteins extracted from cells at 12 h of growth. Replicate b)……….83
Figure A.4 Relative molecular masses of spots 1, 2, 3 in 2DE gel of membrane proteins extracted from cells at 48h of growth. Replicate a)………..84
11
Table Index
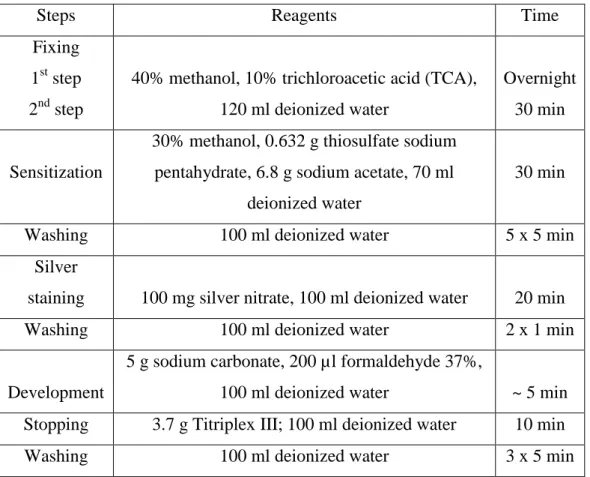
Table 1 Silver Staining Protocol 43
Table 2 Statistical analysis of the S. cerevisiae membrane-associated proteins extracted from cells grown for 12 h and 48 h, respectively (these are mean values of 2 replicates of cells grown for 12 h and 4 replicates of cells grown for 48 h). 58
Table 3 Results from mass spectrometry analysis. Method used MALDI-TOF/TOF. Protein score is -10*Log(P), where P is the probability that the observed match is a random event. Protein scores greater than 52 are significant (p<0.05). Protein scores are derived from ions scores as a non-probabilistic basis for ranking protein hits. 61
Table A.1 Relative volumes of the spots, means of relative volumes and 48/12h ratio 75
Table A.2 Fold and p-value 82
Table A.3 ANOVA values and spots overexpressed 82
12
Abbreviations
2D-PAGE - two dimensional polyacrylamide gel electrophoresis 2DE - two dimensional electrophoresis
AcAm - ammonium acetate AMPs - antimicrobial peptides
AAMPs - anionic antimicrobial peptides Cell/ml - cell per milliliter
CFU/ml - colony-forming unit per milliliter CFU/g - colony-forming unit per gram
CHAPS - 3-[(3-cholamidopropyl)dimethylammonio]-1-propanesulfonate DEAE - diethylaminoethyl
DTT - Dithiothreitol
EDTA - Ethylenediamine tetraacetic acid
ESI - electrospray ionization g/l - grams per liter
GAPDH - glyceraldehyde-3-phosphate dehydrogenase enzyme GF - gel filtration or size exclusion chromatography
IEC - ion-exchange chromatography IEF - isoelectric focusing
IPG - immobilized pH gradient kDa - kilo Daltons
LAB - lactic acid bacteria
MALDI - matrix assisted laser desorption/ionization MLF - malolactic fermentation
MS - mass spectrometry MW - molecular weight nm - nanometer
NMR - nuclear magnetic resonance rpm - revolutions per minute
Phe - phenylalanine pI - isoelectric point
RP-HPLC - reversed-phase high-performance liquid chromatography SDS - sodium dodecyl sulfate
13
TCA - trichloroacetic
tdh3p - glyceraldehyde-3-phosphate dehydrogenase protein Trp - tryptophan
TOF - time of flight Tyr - tyrosine
YPD - yeast protein database
14
1
Introduction
1.1 Winemaking process and alcoholic fermentation
Winemaking process relies in some basic principles, mainly in the transformation of grape sugars into ethanol and carbon dioxide -alcoholic fermentation- by the yeasts belonging to the natural microflora of grape musts. After alcoholic fermentation, an additional fermentation process –malolactic fermentation– may take place in both red and white wines, which occurs by the intervention of lactic acid bacteria.
Depending on the process used, there are three types of wines: red, rosé and white wine. Following harvesting, grapes are destemmed and crushed and then the process diverges for white and red wines: white wine undergoes fermentation in the absence of grape skins and lees; while in red wine fermentation follows maceration and occurs in the presence of grape skins and lees. Since the red pigments of the red grape berries, the anthocyanins are located in the skin of grape berries, that difference on the winemaking process introduces a major distinction in the composition and taste of white and red wines. After vinification, fermented grape juice undergoes through several final operations: clarification, maceration, fining or stabilization, filtration and finally bottling (Pretorius, 2000, Bisson, 2004). The main steps of the production of red and white wines are represented in Fig. 1.1.
Wine is the result of the action of a diversity of microbiological interactions and, consequently, of a number of biochemical reactions, being the alcoholic fermentation the major and the most important biotransformation taking place during the process (Lambrechts and Pretorius, 2000, Fleet, 2003, Romano, 2003).
Yeasts have the ability of conducting alcoholic fermentation by fermenting grape sugars to ethanol and carbon dioxide in order to obtain the energy and biosynthetical material required for growth. This biotransformation was first studied and described by the well-known chemist Antoine Lavoisier in 1789. Lavoisier discovered that 100 parts by weight of sugar were converted to 60.17 parts of alcohol, 36.81 parts of carbon dioxide and 2.61 parts of acetic acid, being the first
describing the chemical equation as “grape must = carbonic acid + alcohol”. In 1819,
15
converted in 51.34 parts of alcohol and 48.66 parts carbon dioxide. The general equation of alcoholic fermentation is:
C6H1206 → 2C2H5OH + 2CO2
Assuming this equation, 100 parts of sugar (glucose) are converted in 51.19 parts of alcohol (ethanol) and 48.90 parts of dioxide carbon, showing the great accuracy of the earlier studies of these researchers (Barnett, 1998, Barnett, 2003).
Figure 1.1 – The main steps of wine production (Pretorius, 2000)
1.1.1 Microorganisms associated with winemaking
16
reproductive stage Kloeckera); Kluyveromyces; Metschnikowia ; Pichia; Rhodotorula; Saccharomyces; Saccharomycides; Schizosaccharomyces; Torulaspora and Zygosaccharomyces (Heard and Fleet, 1985, Pretorius, 2000, Lambrechts and Pretorius, 2000, Esteves-Zarzoso et al., 1998). The predominant species in the grape berries are apiculated yeasts, such as Hanseniaspora uvarum and its anamorphic form Kloeckera apiculata, and oxidative ones, such as Candida, Pichia, Rhodotorula and Kluyveromyces (Fleet, 2003). Contrary to popular belief, fermentative species of Saccharomyces (e.g. S. cerevisiae) occur at extremely low numbers on healthy, undamaged grapes and are rarely isolated from intact berries and vineyard soils (Frezier and Dubourdieu, 1992; Martini et al., 1996). In fact, the origin of S. cerevisiae is quite controversial. While some researchers believe that damaged grapes are an important source of S. cerevisiae (Mortimer and Polsinelli, 1999), others point to a direct association with artificial, man-made environments such as wineries and fermentation plants (Vaughan-Martini and Martini, 1995; Martini et al., 1996; Deak, 1998; Sabate et al., 2002).
1.1.2 Yeast population dynamics during wine fermentations
Yeast population on the surface of immature grape berries is low (ca 10-103 CFU/g), increasing to about 104-106 CFU/g as grapes mature to harvest. Apiculate yeasts of the genus Hanseniaspora are predominant on the surface of grape berries and in lower numbers appear other yeast genera such as Candida, Brettanomyces, Cryptococcus, Kluyveromyces; Metschnikowia and Pichia are also present. Fermentative species of Saccharomyces (e.g. S. cerevisiae) are frequently not isolated from intact grape berries being generally found at densities of ca 10-102 CFU/g (Pretorius, 2000, Fleet, 2003).
17
yeasts such as Kluyveromyces and Pichia and wine spoilage yeasts Brettanomyces and Zygosaccharomyces can also grow and ferment sugars. At mid-fermentation stages (with 3-4% of ethanol produced), non-Saccharomyces species begin to die-off giving way to the strongly fermentative S. cerevisiae strains which become predominant (107-108 CFU/ml) and complete the fermentation process (Pretorius, 2000, Fleet, 2003, Bisson, 2004).
Saccharomyces cerevisiae
S. cerevisiae is the most important and well-known yeast species due to its worldwide application in the production of wine, beer and bread. This species, also
known as the “wine yeast”, is the first choice in the formulation of yeast starters for
winemaking due to its high fermentation capacity and high tolerance to the harsh environmental conditions of this process, i.e.: high levels of ethanol and other organic compounds, low pH values, low oxygen and scarce nutrient availability. Moreover, S. cerevisiae is the best physiologically and genetically characterized eukaryotic organism and a great biological model for multidisciplinary studies.
S. cerevisiae are dimorphic ascomycetous fungi that can occur in two forms: a unicellular oval-elliptic form and, under conditions of nitrogen deficiency, in a multicellular filamentous form, named pseudohyphae. S. cerevisiae can grow as diploid cells (where division is carried out through budding or fission) or as haploid cells forming ascopores (under starvation conditions) (Gimeno et al., 1992, Kurtzman and Piškur, 2005, Bergman, 2001, Bisson, 2004).
Fungal cell walls are rigid structures required for maintaining cellular shape and integrity by protecting cells against osmotic changes in the environment. They also act as selectively permeable membranes and play a role in processes such as flocculation, cell adhesion and pathogenicity. The cell wall exhibits a dynamic nature, undergoing profound changes during budding, apical extension of hypha, mating and dimorphic transition. (Klis, 2006; Pardo et al., 1999; Braconi et al., 2011).
S. cerevisiae has approximately 6000 functional genes, most of them encoding proteins of the plasmatic membrane (Goffeau et al., 1996). This membrane consists of a mixture of proteins and lipids which form an impermeable barrier to hydrophilic
18
responsible for cell wall strength) and mannoproteins that act as structural proteins or as enzymes involved in biogenesis. There are a variety of other specialized proteins that play a role in processes of solute transport, signal transduction, cytoskeleton anchoring and in glycolytic pathways such as the enzyme glyceraldehyde-3-phosphate (GAPDH; tdh3p) (Aliverdieva et al., 2004, Bisson, 2004; Delom et al., 2006).
1.1.3 Lactic acid bacteria and the malolactic fermentation
Lactic acid bacteria (LAB) are Gram-positive, non-sporing and non-respiring bacteria that are able to transform malic acid into lactic acid – malolactic fermentation. LAB isolated from wine include species of the genera Oenococcus, Lactobacillus and Pediococcus. Oenococcus oeni is the preferred species used to conduct malolactic fermentation due to its tolerance to the extreme harsh conditions of the wine environment and the flavour profile they produce (Lerm, 2010).
Malolactic fermentation (MLF) is a secondary wine fermentation carried out by LAB that consists in an enzymatic-mediated reaction in which L-malic acid is decarboxylated into L-lactic acid and carbon dioxide. It promotes a desirable reduction of wine acidity an improvement in the microbial stability and in the organoleptic quality of the wine. MLF might occur spontaneously, concomitant with, or at the end of the alcoholic fermentation and its duration depends on the amount of malic acid in the medium. After the completion of MLF, the remaining LAB (Lactobacillus and Pediococcus) are still able to metabolize residual sugar, which could result in wine spoilage.
19
1.1.4 Factors underlying dominance of Saccharomyces cerevisiae
As mentioned before, non-Saccharomyces yeasts grow during the early stages of wine fermentation but then begin to die-off, leaving way to S. cerevisiae strains to complete the fermentation process (Heard and Fleet, 1985). The ability of S. cerevisiae to displace other microbial species during wine fermentation has been always attributed to its higher fermentative power and capacity to withstand the increasingly adverse conditions established in the medium as the fermentation progresses, i.e.: high levels of ethanol and organic acids, low pH values, scarce oxygen availability and depletion of certain nutrients (Bisson 1999; Bauer and Pretorius 2000; Hansen et al., 2001).
The increasing levels of ethanol are known to inhibit cell growth. Ethanol modifies plasma membrane fluidity, stimulates the activity of plasma membrane H+-ATPase and inhibits glucose transport (Ansanay-Galeote et al., 2001). Ethanol also triggers a stress response in S. cerevisiae cells consisting in the formation of heat shock proteins (Piper et a l,. 1994).
The early death of non-Saccharomyces yeasts such as Candida, Hanseniaspora, Kluyveromyces, Metschnikowia, Pichia and Torulaspora has always been attributed to their incapacity to tolerate ethanol concentrations higher than 5-7% (v/v) (Fleet and Heard, 1993; Fleet, 2003). However, subsequent studies showed that some non-Saccharomyces species such as Candida zemplinina and Kluyveromyces thermotolerans exhibit similar ethanol tolerance to S. cerevisiae strains, especially under fermentations performed at temperatures lower than 20 ºC (Gao and Fleet, 1988). Other work on ethanol tolerance showed that the survival of H. guilliermondii at 25% (v/v) ethanol was strongly influenced by the conditions of cultivation prior to the ethanol challenge and a small increase in survival was observed for H. uvarum and T. delbrueckii in the cultures grown in aerobiosis (Pina et al., 2004).
20
physiological response to ethanol challenge is also greater than non-wine strains (Loureiro and van Uden, 1986; Lloyd et al., 1991; Ansanay-Galeote et al., 2001 Mishra and Kaur, 1991; Sajbidor, 1997).
During wine fermentations, oxygen and assimilable nitrogen can be rapidly depleted due to both semi-anaerobic growth conditions and poor initial nitrogen contents of grape musts. In the presence of oxygen, the increasing survival rate of yeasts is related to the enrichment of unsaturated long chain fatty acids and ergosterol in the phospholipid membrane (Alexandre and Charpentier, 1998; Chi and Arneborg, 1999).
Throughout the different stages of wine fermentation, several types of nutrients may become limited or exhausted which results in a decreasing in both the growth rate and the fermentation efficiency or even in a complete arrest of fermentation. Nutrient limitation and starvation are stress inducing conditions and result in a number of stress-associated responses (Bauer and Pretorius 2000). A study carried out with three strains of H. uvarum, H. guilliermondii and C. stellata (Albergaria et al., 2003) showed that the limited fermentation capacity exhibited by those yeast strains was, partially, due to nutritional limitations.
The killer phenomenon consists in the production of specific extracellular glycoproteins by certain killer yeast strains that are able to kill other sensitive yeast
strains. The killer strains themselves are immune to their own toxin but remain susceptible to the toxins secreted by other killer yeasts (Schmitt and Breinig, 2002). Since first discovered in S. cerevisiae, killer strains have been isolated from several yeast genera, including Candida, Cryptococcus, Hanseniaspora, Kluyveromyces, Pichia and Torulopsis (Chen et al., 2000). S. cerevisiae produces three types of killer toxins K1, K2 and K28, but only K2 and K28 are functional during wine fermentations due to the low pH of grape must and wine. However, the killer toxins produced by S. cerevisiae strains have shown to be active only against strains of the same species. Thus, they cannot explain the antagonistic effect exerted by S. cerevisiae against non-Saccharomyces yeasts during wine fermentations.
21
killer-like toxins (Chen et al., 2000; Comitini et al., 2005; Pérez-Nevado et al., 2006; Osborne and Edwards 2007; Albergaria et al., 2010).
Death mediated by cell–cell contact is another mechanism that has been reported to explain the early death of some non-Saccharomyces during wine fermentations. In a pioneer work, Nissen and Arneborg (2003) demonstrated that the early death of K. thermotolerans and T. delbrueckii in mixed culture fermentations performed with S. cerevisiae was not due to ethanol or any other toxic compound but rather to a cell-cell contact-mediated inhibition. More recent studies (Renauld et al., 2013, Kemsawasd et al., 2015) confirmed that S. cerevisiae cells at high cell density induce the early death of wine-related yeasts, although the exact death-inducing mechanism remains unclear.
Other studies (Comitini et al., 2005; Pérez-Nevado et al., 2006; Osborne and Edwards 2007; Albergaria et al., 2010) found evidences that certain S. cerevisiae strains produce killer-like toxins that are involved in the yeast–yeast and yeast– bacteria interactions established during wine fermentations. Pérez-Nevado et al. (2006) conducted a study with two non-Saccharomyces wine strains (H. guilliermondii and H. uvarum) performing enological fermentation both in single and in mixed culture with S. cerevisiae. Results showed that after the first 3 days of
fermentation the non-Saccharomyces yeasts begun to die off in the mixed cultures,
while in the single cultures the number of viable cells of non-Saccharomyces
remained high (ranging 107–108 CFU/ml), regardless the increasing levels of ethanol.
Furthermore, they also showed that death of the non-Saccharomyces strains was not
induced by cell-cell contact but rather by one or more toxic compounds produced by
S. cerevisiae. Subsequent studies (Albergaria et al., 2010) revealed the proteinaceous
nature of the toxic compounds secreted by S. cerevisiae CCMI 885 and protein analysis demonstrated that the toxic compounds corresponded to antimicrobial peptides (<10 kDa) active against several wine-related non-Saccharomyces yeasts ( i.e. K. marxianus, K. thermotolerans, T. delbrueckii and H. guilliermondii). Later,
Branco et al. (2014) showed that S. cerevisiae CCMI 885 secretes antimicrobial peptides (AMPs) during alcoholic fermentation that are active against a wide variety of wine-related yeasts and bacteria (e.g. Oenococcus oeni). Mass spectrometry analyses revealed that those AMPs correspond to fragments of the S. cerevisiae
22
residues VSWYDNEYGYSTR and ISWYDNEYGYSAR were identified. The theoretical isoelectric point (pI) of these peptides (4.37) defines these peptides as anionic.
The involvement of GAPDH-derived peptides in wine microbial interactions was further sustained by results obtained in mixed cultures performed with S. cerevisiae single mutants deleted in each of the GAPDH codifying genes (TDH1-3).
Yeast-bacteria interactions in wine fermentations were also investigated by some authors. Comitini et al. (2005) found that certain S. cerevisiae strains produce proteinaceous compounds active against the malolactic bacteria. Also Osborne and Edwards (2007) found that a S. cerevisiae strain (Ruby.Ferm) secretes a peptide active against Oenococcus oeni bacteria that affected the malolactic fermentation process. However, neither of those AMPs were fully characterized.
1.2 Antimicrobial peptides: their nature, function and mode of action
AMPs are small biologically active molecules typically composed of fewer than 50 amino acid residues. They are evolutionary conserved components of the innate immune response and constitute the first line of antimicrobial defense for organisms across the eukaryotic kingdom. AMPs show a wide range of secondary structures such as -helices and -strands with one or more disulphide bridges, loop and extended structures, which are highly essential for the broad spectrum of antimicrobial activity they exhibit. Besides these properties, other factors such as size, charge, hydrophobicity, amphipathic stereo geometry and peptide self-association to the biological membrane of microbial cells are also important for their diverse mechanisms of action. In the vast majority of cases, AMPs are cationic and kill microorganisms through mechanisms that predominantly involve interactions
between the peptide’s positively charged residues and the anionic components of target membrane cells. There are also a number of cationic AMPs that appear to target internal anionic cell constituents such as DNA and RNA (Harris et al, 2009; Cézard et al, 2011; Pushpanathan et al., 2013).
23
common to vertebrates and invertebrates, playing a role in their innate immune systems, which shows the ancient nature of these peptides and their important defense function. Structural characterization shows that AAMPs to generally range in net charge from -1 to -7 and in length from 5 residues to approx. 70 residues. Some AAMPs can be produced constitutively while others appear to be induced in response to microbial infection. A number of inducible AAMPs are encrypted within the primary structures of precursor proteins and require cleavage by proteolytic cleavage. The AAMPs have a broad spectrum of antimicrobial activity against bacteria, fungi, viruses, nematodes and insects. Their mechanism of action seems to rely mainly in membrane interactions. In general, AAMPs adopt amphiphilic conformations for membrane interaction; while some appear to interact via the use of receptors, others appear to use metal ions to form cationic salt bridges with negatively charged components of microbial membranes, thereby facilitating interaction with their target organisms (Harris et al., 2009).
1.2.1 Purification methods of AMPs
Adequate purification of AMPs is necessary for their subsequent characterization.
For purification of AMPs it is often difficult to use methods similar to those applied in the purification of other organic compounds, mainly due to their complexity. The methods most commonly used in peptide purification usually utilize various principles of chromatography such as ion-exchange chromatography, gel filtration chromatography and reverse-phase high-performance liquid chromatography (RP-HPLC) (Andersson and Persson, 2000). Chromatography is a technique in which solutes are resolved by their different elution rates as they pass through a chromatographic column. The separation is governed by their partitioning between the mobile phase and the stationary phase.
24
of bulk contaminants; (4) polishing - removal of trace contaminants in order to obtain high level of purity.
Gel filtration or size exclusion chromatography (GF)
Gel filtration (GF) chromatography separates proteins according to differences in molecular size. The technique is highly efficient for separation of polymeric forms of peptides and for desalting of sample solutions. GF is a non-binding method, is independent of sample concentration and since buffer composition does not directly affect resolution, buffer conditions can be varied to suit the sample type or the requirements for the next purification or analysis step. Polyacrylamide matrices that separate molecules with a molecular weight lower than 10 kDa have been most useful in antimicrobial peptide purification. Disadvantages with gel filtration chromatography are the low capacity and the relatively slow flow-rates that can be applied for optimal separation on such columns (Cole and Ganz, 2000).
Ion-exchange chromatography (IEC)
Ion-exchange chromatography (IEC) technique is dependent on the ionic interaction between the support surface and charged groups of the peptide: the separation is based on the reversible interaction between a charged protein and an oppositely charged chromatography matrix. Target proteins are concentrated during binding and collected in a concentrated form. The mobile phase is typically an aqueous buffer solution and the stationary phase into which the mixture to be resolved is introduced is usually an inert organic matrix chemically derivatized with ionizable functional groups that carry a displaceable oppositely charged counter-ion. These counter-ions are in a state of equilibrium between the mobile and stationary phases, giving rise to two possible IEC formats, namely anion- and cation-exchange. Both cation and anion exchangers have been used with success for peptide purifications.
25
mobile phase pH alters the net charge of the bound protein and its binding capacity to the matrix. Increasing salt concentration in the mobile phase alters affinity resulting in the displacement of the bound ionic species.
Exchangeable matrix counter-ions may include protons (H+), hydroxide groups (OH-), single charged monoatomic ions (Na+, K+, Cl-), double charged monoatomic ions (Ca2+, Mg2+), and polyatomic inorganic ions (SO42-, PO43-), as well as organic bases (NR2H+) and acids (COO-). A strong ion exchange medium has the same charge density on its surface over a broad pH range, whereas the charge density of a weak ion exchanger changes with pH. The selectivity and the capacity of a weak ion exchanger are different at different pH values (Cummins et al., 2011; Andersson and Persson).
Reversed-phase high-performance liquid chromatography (RP-HPLC)
The most powerful method for peptide purification is reversed-phase high performance liquid chromatography (RP-HPLC) that uses hydrophobic interactions as the main separation principle. Separation depends on the hydrophobic binding-capacity of the solute molecule towards the mobile phase or towards the immobilized hydrophobic ligands attached to the stationary phase. It is characterized by the use of a stationary phase (sorbent) and an aqueous mobile phase containing an organic solvent. The solute mixture is initially applied to the sorbent in the presence of aqueous buffers, and the solutes are eluted by the addition of organic solvent to the mobile phase. Elution is usually performed by an increasing organic solvent concentration, in order to increase molecular hydrophobicity. Acetonitrile, methanol, ethanol and propanol are common used organic solvents. RP-HPLC exhibits an excellent resolution that can be achieved under a wide range of chromatographic conditions for very closely related molecules as well as structurally quite distinct molecules; its chromatographic selectivity can be manipulated through changes in mobile phase characteristics; gives the generally high recoveries, shows high productivity and reproducibility. However, RP-HPLC can cause the irreversible denaturation of protein samples resulting in the loss of protein activity (Marie-Isabel Aguilar, 2004).
26
characterization. In order to isolate and characterize a class of AMPs, magainins from Xenopus skin, Zasloff (1987) performed a series of purification steps that included: a sample clarification process by centrifugation to prepare sample for an initial ion-exchange chromatography in a carboxymethyl-cellulose matrix (CM52column); the fraction recovered was further concentrated and fractionated by gel filtration (Gel P-30); finally, active fractions were purified in a Vydac C4 HPLC column, eluted with a gradient of organic solvent acetonitrile. The two active forms purified showed growth inhibition activity against bacteria and fungi. In a 2006 study performed on oriental fruit fly, Bactrocera dorsalis (Hendel), one antibacterial fraction was isolated and purified by a pre-purification step, followed by cation-exchange chromatography, gel filtration chromatography and RP-HPLC. Results of physical and biological analysis revealed that this AMP is heat stable and showed strong activities against Gram-positive bacterial growth. Pingitore and colleagues (2007) described different techniques applied to purify some bacteriocins from LAB. Bacteriocins are natural peptides secreted by several bacteria that exert bactericidal activity against other bacterial species. The applied techniques involved salt precipitation followed by various combinations of ion-exchange and reverse phase C18 solid phase extraction, absorption-desorption (AD) and RP-HPLC. The authors emphasized the importance of knowing the characteristics of the different bacteriocins to apply the best purification strategy possible.
The identification of a novel GAPDH-derived AMPs secreted by S. cerevisiae
27
ionization-tandem mass spectrometry (LC-ESI-MS/MS). Sequence analysis revealed that all peptides present in each anionic fraction correspond to fragments of the S. cerevisiae GAPDH isoenzymes, GAPDH2/3 and GAPDH1which are encoded by the
TDH2, TDH3 and TDH1 genes, respectively. This work demonstrated that these AMPs identified are anionic (at neutral pH) and are active against several wine-related yeasts (e.g. D. bruxellensis) and bacteria (e.g. O. oeni) (Branco et al., 2014).
1.2.2 Characterization of AMPs
Peptide characterization is the following step in the process of analyzing AMPs. Peptide mass fingerprinting is the identification of a protein (or a peptide) sequence after its cleavage into small fragments by tryptic digestion followed by mass spectrometry (MS). Mass spectrometry relies on the formation of gas-phase ions (positively or negatively charged) that can be isolated electrically (or magnetically) based on their mass-to-charge ratio (m/z). Two main ionization techniques, electrospray ionization (ESI) and matrix assisted laser desorption/ionization (MALDI), are commonly used in MS (Henzel and Watanabe, 2003; Thiede et al., 2005; El-Aneed et al., 2012). Regardless of the ionization source, the sensitivity of a mass spectrometer is related to the mass analyzer where ion separation occurs. Both quadrupole and time of flight (TOF) mass analyzers are commonly used and they can be configured together as QToF tandem mass spectrometric instruments. Tandem mass spectrometry (MS/MS), as the name indicates, is the result of performing two or more sequential separations of ions usually coupling two or more mass analyzers (El-Aneed et al., 2012).
28
1.3 Proteomic analysis of Saccharomyces cerevisiae during wine fermentations
Proteomic analysis aims the characterization of all proteins present within a given biological sample. The standard methodology that has been used is the combination of 2 procedures: protein separation by two–dimensional polyacrylamide gel electrophoresis (2D-PAGE/ 2DE) and mass spectrometry (MS) based methods for identification of the resolved proteins. Due to its high resolution and sensitivity, 2D-PAGE is a powerful tool for the analysis and detection of proteins from complex biological sources with the ability to separate thousands of proteins at once. Applications include: whole proteome analysis, post- and co-translational modifications, which cannot be predicted from the genomic sequence; cell differentiation, detection of biomarkers and disease markers; bacterial pathogenesis, purity checks, microscale protein purification and product characterization (O'Farrell, 1975, Bond and Blomberg, 2006, Rabilloud et al., 2009, Sameh Magdeldin et al., 2014).
1.3.1 2D-PAGE
In 1975, O’Farrell and Klose (1975) established a technology for the global study of protein expression: by the two–dimensional polyacrylamide gel electrophoresis (2DE). They applied this method to the analysis of proteins of Escherichia coli and to complex protein mixtures of animal extracts. The method consists of two steps of protein separation according with two independent properties: in the first dimension (isoelectric focusing) protein molecules are resolved according to the charge of proteins (i.e. their isoelectric point), while in the second dimension the focused proteins are fractionated according to their molecular weight (O'Farrell, 1975, Klose, 1975).
29
The 2D-PAGE principle has remained basically the same throughout time, although new improves have been introduced to overcome reproducibility problems with this methodology. Initially, the first dimension was performed in glass tubes and the process of taking out the gels and transferring them onto the slab gel for the second dimension was very difficult, sometimes damaging the gels. Moreover, IEF with carrier ampholytes had reproducibility problems because ampholytes are mobile synthetic molecules with tendency to drift towards the cathode (causing the progressive loss of the basic portions) and distorting the gels. Later on, two main events improved the 2D-PAGE technology such as the replacement of glass tube gels by strip gels (i.e. easier to handle) and the introduction of immobilized pH gradient gels (IPG) in which buffering groups are attached to the gel matrix. There was also developments in sample preparation that helped achieving reproducibility and decreasing variability such the different extraction buffers for specific samples and protein precipitation to clean interfering substances and concentrate samples (Primrose and Twyman, 2008; Rabilloud et al., 2009; Sameh Magdeldin et al., 2014).
For protein visualization, there is a variety of staining methods such as the Coomassie brilliant blue, silver nitrate and fluorescent stains and specific methods as immunodetection and glycoprotein detection (Primrose and Twyman, 2008; Rabilloud et al., 2009).
Gel image analysis is performed with 2D gel image softwares, like
ImageMaster™ 2D Platinum, which allows us to know the total number of spots in a
given gel; the corresponding pI and molecular weight (MW) and analyze different protein expression levels between two or more gels.
1.3.2 Saccharomyces cerevisiae proteome and surfome analysis
30
of the physiological responses towards changes in environmental conditions (Pham and Wright, 2007).
Proteome
31
et al., 1996). Proteome studies in S. cerevisiae conducted by Garrels and colleagues (1997) aimed theidentification and characterization of abundant proteins in order to complete the yeast 2DE map of abundant proteins. The results obtained extended the yeast 2DE protein map to 169 identified spots based on the yeast genome sequence and showed that methods of spot identification based on predicted pI, predicted MW and determination of partial amino acid composition from radiolabeled gels were powerful enough for the identification of at least 80% of the spots representing abundant proteins. Comparison of proteins predicted by the Yeast Protein Database (YPD) to be detectable on 2DE gels based on calculated MW, pI and codon bias (a predictor of abundance) with proteins identified in this study, suggested that many glycoproteins and integral membrane proteins were missing from the 2DE gel patterns. The authors also performed 2DE gel experiments to analyse and characterize the yeast proteins associated with:(i) an environmental change (heat shock), (ii) a temperature-sensitive mutation, (iii) a mutation affecting post-translational modification (N-terminal acetylation) and (iv) a purified subcellular fraction (the ribosomal proteins), using the 2DE gel map and the information available in the YPD. Another work extended the yeast 2DE protein map with 92 novel protein spots, which were identified by three methods: gene overexpression, amino acid composition and mass spectrometry. The results were recorded in the Yeast Protein Map server (Perrot et al., 1999). In 2002, a 2DE reference map of very alkaline yeast cell proteins was established by using IPGs up to pH 12 (IPG 6–12, IPG 9–12 and IPG 10–12) for 2DE and by using MALDI-TOF peptide mass fingerprinting for spot identification. 106 proteins with theoretical pI up to pH 11.15 and MW between 7.5 and 115 kDa were localized and identified. Most of the proteins (66 spots) were identified from the IPG 6–12 gel due to the improved resolution of narrow IPGs. In addition 37 spots were analysed using IPG 9–12 and 29 spots using the IPG 10–12. 49 of the 106 spots identified were ribosomal proteins. The remaining 57 were eight of unknown function, 17 oxidoreductases, 7 lyases, 6 transferases, 4 hydrolases, 3 isomerases (including 2 chaperones), 3 ligases, 2 heat shock proteins/chaperones, 3 DNA binding proteins including histones H2B and H2A-1, 2 transcription factors, 1 protein conjugation factor and 1 transporter channel protein (Wildgruber et al., 2002).
32
induced fermentation stress conditions in a wild-type wine strain of S. cerevisiae (Trabalzini et al., 2003); studies in yeast growth in chemostat cultures limited by glucose and ethanol (Kolkman et al., 2005); comparative proteomic analysis of transition of S. cerevisiae from glucose-deficient medium to glucose-rich medium (Giardina et al., 2012); proteome analysis of recombinant xylose-fermenting yeast strain, comparing conditions in which glucose or xylose was the carbon source (Salusjarvi et al., 2003); proteomic response to amino acid starvation in S. cerevisiae (Yin et al., 2004) and several other studies on changes in the yeast proteome as a function of the stimuli in the environment, such as cadmium, lithium, hydrogen peroxide, sorbic acid, amongst others.
Surfome
Yeast’s cells are delimited by a membrane structure that is composed by a cytoplasmatic membrane and a cell wall that are separated by the periplasmic space. The rigid cell wall is an essential structure required for maintaining cellular shape and integrity by protecting cells against osmotic changes in the environment. Cell membranes act as filters, permitting the passage of some molecules while excluding others. The cell membrane is not an inert structure and undergoes profound changes as a consequence of cellular processes such as budding, apical extension of hypha, dimorphic transitions and mating. Membranes also play an important role in cellular processes such as flocculation, adhesion and pathogenicity (Pardo et al., 1999; Pardo et al., 2000; Braconi et al., 2011). The cell wall of S. cerevisiae is composed by an
internal layer consisting of a flexible network of β-1,3-glucan molecules with
covalently attached β-1,6-glucan and chitin, and an external fibrillar layer of mannoproteins, which are mannose-containing glycoproteins (Braconi et al., 2011). Synthesis of S. cerevisiae cell wall components could take place in two steps. First,
chitin and β-1,3-glucan are synthesized by the cytoplasmatic membrane bound enzyme complexes through a vectorial process in which the formed chains are extruded through the cytoplasma membrane. Mannoproteins are synthesized and
33
biogenesis. The complex nature of the cell wall is emphasized by the fact that approximately 20% of the S. cerevisiae genome is required for the biogenesis of this structure (Braconi et al., 2011).
Cytoplasmatic membrane is composed mainly by an amphoteric bilayer of phospholipids that form an impermeable barrier to hydrophilic molecules and within which are enclosed proteins. Membrane proteins are highly specialized and mediate a variety of crucial cellular functions such as sensing/signaling external environmental conditions, transport of nutrients, endocytosis/exocytosis, cytoskeleton anchoring, generation of membrane potential and cell wall synthesis and maintenance. Membrane phospholipids are, in their majority, composed by phosphatidylethanolamine, phosphatidylcholine and phosphatidylinositol (Aliverdieva et al., 2004, Bisson, 2004; Delom et al., 2006).
Several studies have been performed in order to analyze the protein composition of the cytoplasmatic membrane and of the cell wall using different protein separation and identification strategies such as 2DE and mass spectrometry. Two main works conducted by Pardo et al. (1999; 2000) analysed the proteins secreted by regenerating protoplasts as a way to understand the cell wall biogenesis and identify cell wall proteins. They reported the identification of several proteins
with different functions: proteins involved in cell wall construction (β-1,3-glucanosyl transferase; GPI cell wall protein; exoglucanase); enzymes involved in glycolysis or fermentation (alcohol dehydrogenase, enolases, fructose biphosphate aldolase, pyruvate decarboxylase, pyruvate kinase, and glyceraldehyde-3-phosphate dehydrogenase (TDH 1,2,3)); heat shock proteins (PIR proteins and Hsp70 family); amongst others. Aliverdieva et al., (2004) designed a simplified method for the isolation of cell membranes fractions for the evaluation of their protein composition and they were able to identify several spots in 2DE gels that in their majority corresponded to protein transporters (high-affinity hexose transporter, cation transporter, phosphate transporter, lactate and pyruvate transporter, sodium/phosphate symporter, low-affinity iron transporter, ammonium ion transporter, general amino acid transporter and others).
surface-34
exposed proteins were extracted by trypsin “shaving” of intact cells and the 2DE resolved proteins were identified by nLC-ESI-LIT-MS/MS. Those authors reported a total of 42 identified proteins, out of which 16 were specifically expressed at the beginning of the fermentation and 14 at the end of the process. Carbon metabolism-related proteins (particularly involved in glycolysis and fermentation) accounted for 21% of the 42 identified and the following information can be summarized:
GAPDH was detected both at the beginning and at the end of fermentation. GAPDH (an enzyme involved in the glycolysis pathway) incorporation into the cell wall is considered responsive to environmental factors and not requiring de novo protein synthesis, i.e. stress conditions cause the incorporation of pre-existing GAPDH into the yeast cell wall.
Hexokinase 2 (Hxk2p, catalyzing glucose phosphorylation in the cytosol) was detected as surface-expressed proteins at the beginning of fermentation.
Phosphogluconate dehydrogenase catalyzes the second oxidative reduction of NADP+ to NADPH. It is also important for protecting yeast from oxidative stress, since NADPH is an essential cofactor for several enzymes involved in the cell protection against oxidative damages
Enolase is among the most abundant enzymes in S. cerevisiae cytosol. It catalyzes the conversion of 2-phosphoglycerate to phosphoenolpyruvate in the fourth glycolytic step.
Pyruvate decarboxylase isozyme, Pdc1p is a key enzyme in alcoholic fermentation, decarboxylates pyruvate to acetaldehyde; subjected to glucose-, ethanol-, and autoregulation, it is involved in amino acid catabolism.
35
36
2
Materials and methods
2.1 Microorganisms
In this study two yeast species were used: Saccharomyces cerevisiae strain CCMI 885 (Culture Collection of Industrial Microorganisms, ex-INETI, Lisbon Portugal) originally isolated form the indigenous microflora of grape musts of Alentejo region and Hanseniaspora guilliermondii strain NCYC 2380 (National Collection of Yeasts Cultures, Norwich, United Kingdom) originally isolated from grapes of Douro region. All strains were maintained in YEPD-agar slants, stored at 4°C and reactivated periodically.
2.2 Culture media and inocula
Alcoholic fermentations were performed in a Synthetic Grape Juice (SGJ), which has a chemical composition similar to the natural grape musts. The SGJ was prepared by mixing three solutions (A, B and C), as described in Pérez-Nevado et al. (2006). The final composition of the SGJ was (per litre): (from solution A) D-glucose, 110 g; D-fructose, 110 g; (from solution B) L-(1)-tartaric acid, 6.0 g; L-(2)-malic acid, 3.0 g; citric acid, 0.5 g; (from solution C) YNB (yeast nitrogen base), 1.7 g; CAA (vitamin-free Casamino Acids), 2.0 g; CaCl2, 0.2 g; arginine-HCl, 0.8 g; L-(2)-proline, 1.0 g; L-(2)-tryptophan, 0.1 g. Solutions B and C were buffered at pH 3.5 with NH4OH and H3PO4, respectively.
37
2.3 Purification of antimicrobial peptides (AMPs) secreted by S. cerevisiae
during alcoholic fermentation
2.3.1 Production of alcoholic fermentations supernatants
To obtain large amounts of AMPs secreted by S. cerevisiae during alcoholic fermentation, we performed three microvinifications in 2-L Erlenmeyer flasks containing each 1000 ml of SGJ. Each flask was inoculated with 105 cells/ml of S. cerevisiae (inoculum prepared as described in section 2.2.) and incubated in an orbital shaker (G25 Incubator Shaker, New Jersey, USA) at 30ºC and 150 rpm of agitation, for 7 days. Microvinifications were controlled by measuring cell growth, as well as sugars consumption and ethanol production.
Daily samples were taken from each microvinification and cell growth was evaluated by the number of colony forming units (CFU), determined by the classical plating method. Briefly, 100 µl of culture sample were diluted in deionized water and after appropriated dilutions (decimal serial dilution method) inoculated in YEPD-agar plates. The plates were incubated at 30 ºC in a vertical incubator (Infors, Canada) and the number of CFU enumerated after 2-3 days.
Sugars (glucose and fructose) and ethanol concentrations were determined by High Performance Liquid Chromatography (HPLC) in cell-free samples obtained by filtration with 0.45 um Millipore membranes (Merck Millipore, Algés, Portugal). The HPLC system (Merck Hitachi, Darmstadt, Germany) was coupled with a refractive index detector (HPLC, Merck Hitachi, Darmstadt, Germany). Samples were injected (20 µl) into a Sugar-PakTM column (Waters, Milford, USA) and eluted with a degassed mobile phase (50 mg/ml of CaEDTA) at 90ºC with a flow rate of 0.5 ml/min. Glucose, fructose and ethanol standards at concentrations of 15, 7.5 and 3.75 g/l were used for calibration curves.
38
supernatants (3000 ml in total) were stored at 4 ºC until utilization in the preparative anion-exchange chromatographic column (DEAE-Sephadex).
In order to confirm the presence of the bioactive peptides (2-10 kDa) previously found in alcoholic fermentation supernatants (Branco et al, 2014). 45 ml of the cell-free supernatants were ultrafiltered through centrifugal filter units (Vivaspin 15R, Sartorius, Göttingen, Germany) equipped with 10 kDa membranes and 2 kDa membranes. First, the supernatant was ultrafiltered through the 10 kDa membranes and then the permeate (<10 kDa) was concentrated (10-fold) by passing through the 2 kDa membranes. Ultrafiltration was performed at 20 ºC and 6000 x g
in a bench centrifuge (Sigma 2-16 K, Sartorius, Germany) and the concentrated fraction (2-10 kDa) was frozen and kept at -80ºC.
2.3.2 Purification of the AMPs from the fermentation supernatants using a preparative anion-exchange column
Proteins of the alcoholic fermentation supernatants (approx. 3000 ml) were fractionated in a preparative chromatographic system using an anion-exchange resin diethylaminoethyl (DEAE) Sephadex A-25 (GE Healthcare, Uppsala, Sweden). This gravity-flow chromatographic system was composed of a preparative glass column (34 cm long x1.5 cm inner diameter) filled with the 588 ml of DEAE-Sephadex resin. A gradient elution system composed of two 2-L Erlenmeyer flasks (of 2-L each), one containing 2000 ml of 2 M ammonium acetate and the other 2000 ml of 2 mM ammonium acetate, was coupled to the column. Both Erlenmeyer flasks were connected by a plastic tube, with the low salt concentration flask being agitated to ensure that the gradient was reached. Elution was carried out by gravimetric force.
39
These major DEAE-Sephadex-protein fractions were frozen and kept at -80ºC for further analysis.
2.3.3 Antimicrobial activity of the protein fractions obtained in the preparative anion-exchange DEAE-Sephadex column
In order to search for the previously found AMPs (Albergaria et al., 2010; Branco et al., 2014), the antimicrobial effect of each DEAE-Sephadex-protein fraction was evaluated in growth assays performed with a sensitive yeast strain. Antimicrobial active fractions have 2-10 kDa AMPs (Albergaria et al., 2010; Branco
et al., 2014) and yellow color (data not published), therefore 100 ml of only yellow-colored fractions (obtained from DEAE-Sephadex column) were ultrafiltered using centrifugal filter units (Vivaspin 15R, Sartorius, Göttingen, Germany) equipped with 10 kDa membranes. The <10 kDa fractions were then concentrated 10-fold by passing through the 2 kDa membranes. Ultrafiltration was performed at 20 ºC and 6000 x g in a bench centrifuge (Sigma 2-16 K, Sartorius, Germany). The protein concentration of the 2-10 kDa fractions was determined by spectrometry using a NanoDropTM 2000 spectrophotometer (Thermo Scientific, Delaware, USA) and measuring absorbance at 280 nm and concentrated fractions were then vacuum–dried until further use.
40
2.3.4 Analysis of the bioactive fractions obtained in the preparative DEAE-Sephadex column by gel filtration and ion-exchange chromatography
In order to compare analytic profiles of bioactive fractions against the sensitive strain H. guilliermondii (Branco et al., 2014), the protein fractions were purified and analysed by filtration followed by ion-exchange chromatography using the same procedure as Branco et al. (2013). First, protein fractions were subjected to gel filtration chromatography, using an HPLC system (Merck Hitachi, Darmstadt, Germany) equipped with an UV detector (Merck Hitachi, Darmstadt, Germany). 200 µm of each fraction were loaded into a Superdex Peptide column (10/300 GL, GE Healthcare, London, UK) and eluted with 0.1 M ammonium acetate at a flow rate of 0.7 ml/min. The fraction of interest, which exhibits an apparent molecular weight (MW) of 8 kDa, was collected after approx. 25 min of sample running. This 8 kDa gel filtration fraction was first lyophilized and then further analysed in a strong anion-exchange column (QResource 6 ml, GE Healthcare, London, UK). Samples were eluted at neutral pH using a gradient of ammonium acetate (ranging from 5–500 mM) between 10 and 40 min at a flow rate of 1 ml/min.
2.4 Proteomic analysis of the cell wall-associated proteins (surfome) of S. cerevisiae cells during alcoholic fermentation
2.4.1 Extraction of S. cerevisiae cell-wall associated proteins
41
Isolation of plasma membranes from 12 h and 48 h grown cells for extraction of proteins was performed as described by Van Leeuwen et al. (1991) with slight modifications. Grown S. cerevisiae cells were centrifuge to separate supernatants from the cell pellet. The cell pellet was washed twice with ice-cold distilled water and once with buffer A (0.1 M glycine, 0.3 mM KC1 at pH 7.0) in a Sigma centrifuge (Sigma 2-16K, Sartorius, Germany) for 20 min at 4˚C and 9000 rpm of agitation. S. cerevisiae cells were resuspended in a proportion of 15 g cells per 15 ml of buffer A containing a protease inhibitor cocktail (Complete Protease Inhibitor Cocktail Tablets, Roche, USA). The cell lysis was carried out in a French press (Thermo Scientific, Delaware, USA) at 20000 psi.
Then, 50 ml of buffer A was added to the lysate and centrifuged for 10 min at 2100 x g, 4˚C, in a Sigma centrifuge (Sigma 2-16K, Sartorius, Germany). The supernatant was filtered with a 0.22 µm membrane (Merck Millipore, Algés, Portugal) and centrifuged with the conditions mentioned above. By slowly addition of 1 M HCl and at constant stirring, the supernatant (kept on ice) was adjusted to pH 4.9 to aggregate mitochondrial membranes and centrifuged straightaway. The supernatant was adjusted to pH 7.0 with 1 M KOH, immediately after, and the pellet was resuspended in 10 ml of buffer A, repeating the last procedure (pH adjustment to 4.9 followed by centrifugation). The supernatants with the plasma membranes combined supernatants with the plasma membranes were adjusted to pH 5.0 and centrifuged for 3 min at 7700 x gand 4˚C. The final supernatant was again adjusted to pH 7 and kept at -80˚C.
42
2.4.2 Two dimensional polyacrylamide gel electrophoresis
Prior to 2D electrophoresis, the samples were cleaned from contaminants by a precipitation method using a 2D Clean-Up Kit (GE, Healthcare, London, UK). The obtained pellet was air-dried for 5 minutes and the proteins were resuspended in the rehydration solution (7 M urea, 2 M thiourea, 2% (m/V) CHAPS, 0.5% (V/V) IPG buffer (pH 3-10), 0.002% (m/V) bromophenol blue and 0.28% (m/V) dithiothreitol (DTT)). The protein concentration was determined by the Bradford method (BIO-RAD Protein assay, California, USA).
Rehydration of Immobiline DryStrip gel strips with linear 4-7 pH gradient, 7 cm in length, (GE Healthcare, London, UK) was performed with 125 µl of rehydration solution (containing 35 µg of sample proteins), for 16 h.
The first dimension was run in the Ettan IPGphor III system (GE Healthcare, London, UK) with in the following conditions: 200 V for 1 h; 500 V for 30 min; voltage gradient up until 1000 V for 30 min; voltage gradient up until 5000 V for
1h30; 5000 V for 1h30; for a total of 12825 Vh at 20 ˚C.
After isoelectric focusing, equilibration of the strips was performed in two steps. In the first one, strips were equilibrated in equilibration buffer (6 M urea, 50 mM tris-HCl pH 8.8, 30% (V/V) glycerol, 2% (m/V) SDS and bromophenol blue) with 10 mg/ml of DTT for 20 min. In the second step, the procedure was repeated with 25 mg/ml of iodoacetamide instead of DTT. Both equilibration steps were performed in a rocking platform shaker (VWR International, USA).
![Figure 3.7 - Chromatographic ion-exchange (Q-Resource column) profiles of the 8.0 kDa fractions (F8) obtained from gel filtration of the three bioactive fractions: F8 [FS] (red); F8 [FI]](https://thumb-eu.123doks.com/thumbv2/123dok_br/18762144.404958/53.892.173.749.505.873/chromatographic-exchange-resource-profiles-fractions-filtration-bioactive-fractions.webp)