E
QUITY
R
ESEARCH
M
ASTERS IN
F
INANCE
TGV? No TGV. Alcântara terminal extension? No Alcântara terminal extension. New motorways concessions? Not now…In the midst of an unprecedentedly bearish domestic macroeconomic outlook, budget cuts, stability and growth program reviews and austerity plans, Mota-Engil’s stock trades at close to all-time lows. However, not everything is bad news:
• The engineering & construction division’s order backlog is
strong at EUR 3.14 billion, conferring the maintenance of growth prospects. Moreover, the cooperation of the Portuguese government with Angola is likely to speed up payments to construction companies.
• The environment & services unit presented pleasant figures in
Q1 2010, fuelled by the logistics segment. The recent acquisition in Brazil highlights the company’s continued internationalization efforts outside its core business.
• The transport concessions division is not subject to segment
reporting anymore, as the company altered its consolidation method. This limits the segment’s visibility, but improves apparent financial solvency.
• With the Portuguese sovereign debt on markets’ radar,
Mota-Engil might encounter worsened debt refinancing conditions, especially when 43.1% of recourse debt is due this year.
• Price Target of 4.00 : A sum of the parts valuation leads to an
upside potential of 89.6%. At a 46.7% discount since the beginning of 2010, Mota-Engil is the construction stock with the worst performance in the PSI 20 Index. We reiterate our BUY recommendation.
07JUNE 2010
MOTA-ENGIL
COMPANY REPORT
C
ONSTRUCTIONA
NALYST:
A
NAF
ELICÍSSIMO[email protected]
Mota’s stock on sale...
...as domestic uncertainty gives place to nothing
Recommendation: BUY
Vs Previous Recommendation BUY
Price Target FY10: 4.00
Vs Previous Price Target 4.06
Price (as of 7-Jun-10) 2.11
Reuters: MOTA.LS, Bloomberg: EGL:PL
52-week range ( ) 2.01-4.53
Market Cap ( m) 431.986
Outstanding Shares (m) 193.628
Source: Bloomberg.
Mota-Engil vs. PSI 20
Source: Bloomberg.
(Values in millions) 2009 2010E 2011E
Revenues 1,943 2,049 2,150
EBITDA 200 210 223
EBITDA margin 10.3% 10.2% 10.4%
Net Profit 89 33 31
Adj. Net Profit (1) 49 33 31
EPS 0.460 0.172 0.161
Net Debt/EBITDA 3.75x 4.02x 3.84x
Source: Mota-Engil and Nova Research Team.
(1) Excluding non-recurring capital gains.
Company Overview:
Mota-Engil SGPS SA is a Portuguese holding company operating in three business areas: engineering and construction; environment and services and transport concessions.
MOTA-ENGIL COMPANY REPORT
EQUITY RESEARCH 07JUNE 2010
PAGE 2/31
Table of Contents
Company overview ...3
Engineering & Construction ... 4
Environment & Services ... 11
Transport Concessions ... 15
Martifer ... 18
Shareholder Structure ... 19
Valuation ...19
Engineering & Construction DCF... 20
Environment & Services DCF ... 22
Transport Concessions DCF ... 23
The Sector ...26
Financial Statements ...27
Appendix: Portuguese Sovereign Debt ...28
MOTA-ENGIL COMPANY REPORT
EQUITY RESEARCH 07JUNE 2010
Company Overview
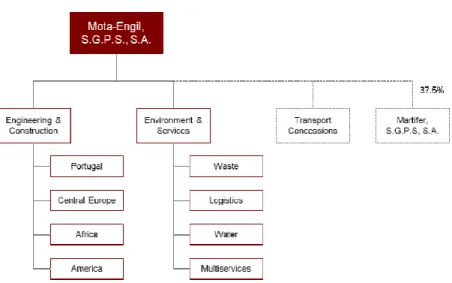
Mota-Engil has been the largest Portuguese civil and public construction contractor since the merger of Mota and Engil in 2000. During the past few years, diversification into other businesses and geographies has been at the core of the group’s strategy as a mean to achieve sustainable growth and a higher consolidated EBITDA margin. Consequently, Mota-Engil is nowadays present in 19 different countries, having been historically present in Angola. In addition to the heavy construction core business, Mota-Engil has diversified into the industries of environmental services, logistics and motorway concessions. Through a 37.5% stake in the Portuguese company Martifer, the company is also present in the metallic construction and alternative energy industries.
Taking a step back from the abovementioned diversification strategy, Mota-Engil has altered its consolidation perimeter in the first quarter of 2010 by no longer including the Transport Concessions (“TC”) division, which is now consolidated through the equity method. Consequently, the company is currently organized in two business units: Engineering and Construction (“E&C”) and Environment and Services (“E&S”).
Figure 1 - Mota-Engil’s Corporate Structure:
Source: Mota-Engil and Nova Research Team.
We have already incorporated the new corporate structure in our equity research report and model, as it is more meaningful for our research to be in line with the company’s segment reporting method. As a result, there is a lack of comparison between pre- and post-2010 officially reported financial figures. Therefore, for the period prior to 2010, pro-forma consolidated financial statements are presented in our report, which do not include the TC business unit.
Mota-Engil is the largest Portuguese contractor, present in 19 countries and diversified into other businesses
MOTA-ENGIL COMPANY REPORT
EQUITY RESEARCH 07JUNE 2010
Engineering & Construction
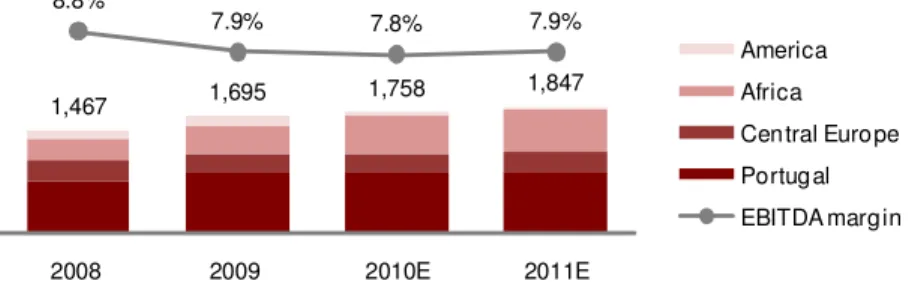
Mota-Engil’s construction operations encompass all kinds of construction works, from heavy construction infra-structures (motorways, railways, hydraulics, tunnels, etc.), to civil engineering (hospitals, schools, industrial facilities, etc.) and real-estate (residential or commercial). In 2009, the E&C unit represented 80.2% of the group’s total revenues, which is equivalent to a turnover volume of EUR 1,695 million. The company conducts construction activities in several countries, which are divided into four main groups1: Portugal; Central Europe (Poland, Slovakia and, to a lesser extent, Czech Republic, Hungary and Romania); Africa (Angola, Malawi, Mozambique and, to a lesser extent, São Tomé and Príncipe and Cape Verde); America (Mexico, Peru and, to a lesser extent, USA and Venezuela). Based on 2009 main projects’ value, we estimate that Poland is the main country within the Central Europe region, followed by Slovakia. Angola is the main country within the Africa region (79.9% of total Africa turnover on Q1 2010), followed by Malawi and Mozambique. There is less information regarding the America segment, but based on recently announced projects we estimate that Mexico and Peru are now the most relevant countries for Mota-Engil in America. Despite a considerable exposure to the domestic market, the E&C division is significantly diversified in terms of other regions, which represented 49.3% of total revenues, in 2009. In Q1 2010, this figure increased to 46.5%, followed by Africa (40.5%), Central Europe (11.5%) and America (1.5%).
Figure 2 - E&C Revenues Breakdown by Segment and EBITDA margin:
1,467 1,695 1,758 1,847
8.8%
7.9% 7.8% 7.9%
2008 2009 2010E 2011E
America Africa Central Europe Portugal EBITDA margin
Source: Mota-Engil and Nova Research Team.
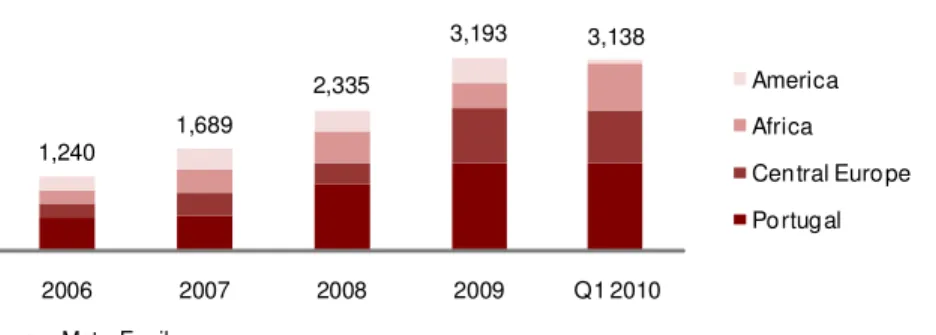
The negative impact of the global macroeconomic conjuncture in the unit’s EBITDA margin is visible in the above graph, which fell 0.9 percentage points (“p.p.”) from 2008 to 2009. This trend is expected to accentuate in 2010, recovering in 2011. The division’s order backlog stood at EUR 3,138 million on Q1 2010, after hitting a record high of EUR 3,200 million on 2009. On Q1 2010,
1
Prior to 2010, Mota-Engil used a different segmentation: Portugal; Central & Eastern Europe; Angola; Other Africa & America. Following a coherent approach of replicating Mota-Engil’s segment reporting method we chose to incorporate the new segmentation in our research model and report. However, as no information was disclosed regarding a more detailed country breakdown of revenues, pro-forma figures cannot be presented for past years. In this sense, “Africa” represents only Angola before 2010, while “America” encompasses not only the America region, but also all other African countries except Angola.
E&C unit represents approximately 80.2% of revenues
MOTA-ENGIL COMPANY REPORT
EQUITY RESEARCH 07JUNE 2010
Portugal represented 46.2% of the order backlog, followed by Central Europe (27.5%), Africa (24.2%) and America (0.2%).
Figure 3 - Order Book Evolution:
1,240
1,689
2,335
3,193 3,138
2006 2007 2008 2009 Q1 2010
America Africa Central Europe Portugal
Source: Mota-Engil.
The order backlog is the most reliable revenues’ source as it encompasses all construction contracts signed with the company, which have yet to be completed. In 2009, the Pinhal Interior concession (construction contract of EUR 958 million, of which EUR 507 million attributable to Mota-Engil), the Douro Interior concession (total investment of EUR 940 million, of which EUR 396 million attributable to Mota-Engil) and the D1 concession in Slovakia (construction investment of EUR 2.5 billion, of which EUR 500 million attributable to Mota-Engil) were the most relevant works in the order backlog. However, the order backlog is not a synonym of revenues, with each construction project having its own completion and payment periods. A detailed analysis of the historical order backlog “duration” (measured in months by order book volume over forward 12 months revenues) allows for a deeper understanding of each region’s dynamics.
Figure 4 - Order Book Duration2:
Orde r Book /12m Forw ard Re ve nue s
in months Q1 2008 Q2 2008 Q3 2008 Q4 2008 Q1 2009 Average
Portugal 10.7 9.9 8.5 14.6 15.7 11.9 2.4 ye ar s
Central Europe 19.2 17.5 24.5 15.2 14.5 18.2 5.7 ye ar s
Africa 16.4 15.1 11.5 14.3 n.s. 14.3 1.4 ye ar s
America 15.5 11.8 23.6 29.4 n.s. 20.1 3.4 ye ar s
Q1 2010 Order Book/Revenues
Source: Mota-Engil and Nova Research Team.
Historically, Portugal and Angola were the regions where the order backlog was faster transformed into revenues, while Central Europe and America construction contracts took longer to be paid. However, Central Europe shows an improving trend in average contract payment time, while all three other regions show the opposite. On another perspective, dividing the Q1 2010 order backlog volume by
2 Africa and America’s duration are actually Angola and Other Africa and America’s duration, as values used for this calculation are prior to 2010. Duration for Q1 2009 is not significant for these regions, as Q1 2010 revenues are overestimated for Africa and underestimated for America, comparing to Q1 2009 order book volume.
Strong order backlog at EUR 3.14 billion
Pinhal Interior, Douro Interior and D1
concessions won in 2009
MOTA-ENGIL COMPANY REPORT
EQUITY RESEARCH 07JUNE 2010
the revenues reported on the same period provides an approximate idea of how many years of revenues can be expected in each region.
Portugal
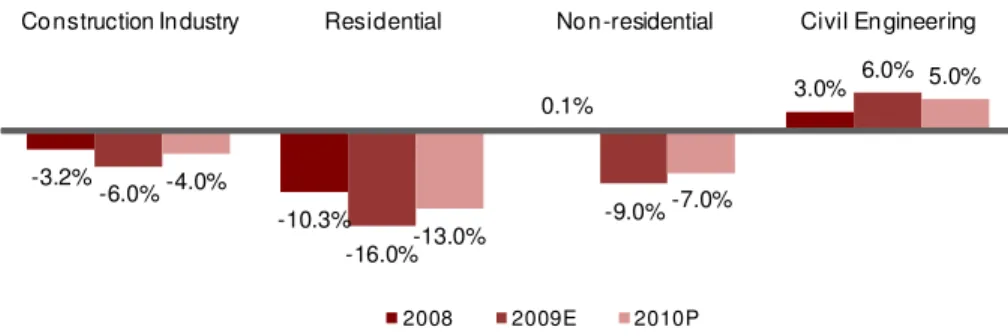
We have identified two main current trends in the Portuguese construction industry. The first is a general decrease in the construction output, driven by the buildings (residential and non-residential) segment. The civil engineering segment (composed mainly by public construction works) on the other hand, has proven resilience within the industry as governments responded to the recent global financial crisis with increased public investment. This was aggravated in Portugal, with two important election moments in 2009. Mota-Engil, the largest public contractor in Portugal, showed resilience to this retraction in output, having grown at double digit rates in domestic operations, for the last couple of years.
Figure 5 - Portuguese Construction Output Growth by Segment:
-3.2%
-10.3%
0.1% 3.0%
-6.0%
-16.0%
-9.0%
6.0%
-4.0%
-13.0%
-7.0%
5.0% Construction Industry Residential Non-residential Civil Engineering
2008 2009E 2010P
Source: Associação Nacional de Empreiteiros de Obras Públicas (“ANEOP”).
The second identified trend is a decrease in public works’ margins, as showed by the graph below, which plots the percentage average deviation between the bidding basis and the actual adjudication value of public contracts.
Figure 6 - Adjudication Value Monthly Deviation over Bidding Basis:
-30% -20% -10% 0% 10%
Jan/07 Jan/08 Jan/09
Adjudication Value / Bidding Basis Monthly Deviation
Source: ANEOP.
The effect of the government’s response to the financial crisis in early 2009 can be seen in the sharp improvement of this indicator. However, towards the end of 2009, levels were at their lowest since 2007. This was very clear in Mota-Engil’s
Trend #1: Decrease in construction output, fueled by buildings segment
MOTA-ENGIL COMPANY REPORT
EQUITY RESEARCH 07JUNE 2010
domestic EBITDA margin, which decreased 2.1 p.p. from 2008 to 2009, having decreased 0.9 p.p. year-on-year (“yoy”) in Q1 2010 to 5.2%.
Nothing indicates that the situation will improve in the near term, especially as the current 9.3% public deficit puts high pressure on national accounts3. Major delays
and drawbacks from expected public investment projects have already taken place: the TGV project has been partially delayed (Lisbon-Oporto, Oporto-Vigo and very possibly Lisbon-Poceirão, which includes the third Tagus bridge project, have been delayed for two years), all motorways concessions to be awarded have been abandoned, with the exception for the Coimbra-Viseu trench of Auto-estrada do Centro, and general public investment will be cut from 4.2% GDP in 2009 to 2.9% in 2013. As for the ANA privatization, which includes the construction of a new Lisbon airport, we are of the opinion that there is a very low probability that it will be adjudicated anytime before 2014, especially since the project is not present in ANA’s 2010-2014 strategic program. To sum up, the current political and financial environment in the country leads to high levels of uncertainty towards public investment projects and Mota-Engil’s stock has been especially penalized by the domestic uncertain environment, having depreciated 46.9% since January 2010 (PSI 20 Index: -18.9%).
The IMF predictions for the Portuguese economy are also not very pleasant. While Mota-Engil’s turnover resilience verified in the past year was surprising, it is now reasonable to expect a lagged reaction to the poor macroeconomic conditions that a company so much exposed to the domestic market will face in the medium-term. Specifically in 2010, which has been until now a tough year for construction activities in terms of weather conditions, we expect the second semester to offset the first, anticipating a yoy stagnation. Our growth and EBITDA margin estimates for this region remain cautious and we believe it is of extreme importance that the company is able to guarantee its presence in other, faster-growing markets.
Central Europe
The presence in the Central Europe market has been a strategic bet for Mota-Engil for a few years now, but results have yet to be proven. The promise of EU funds and shortage of infrastructures is very appealing, as Euroconstruct’s estimates for these markets’ future growth show, but the fact is that EBITDA margins have been only slightly positive since mid-2008, having been negative before that and again in Q1 2010 (-1.7%).
3 See Appendix for more details on the Portuguese Sovereign Debt theme.
Portuguese budget under pressure and major public works were delayed
MOTA-ENGIL COMPANY REPORT
EQUITY RESEARCH 07JUNE 2010
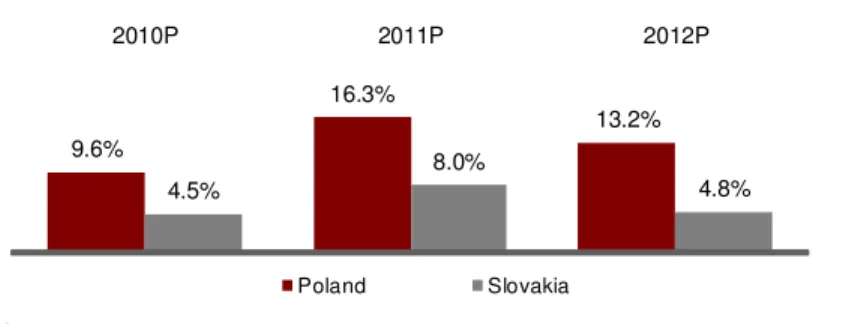
Figure 7 - Poland and Slovakia Construction Output Growth Estimates:
9.6%
16.3%
13.2%
4.5%
8.0%
4.8%
2010P 2011P 2012P
Poland Slovakia
Source: Euroconstruct.
After facing losses due to financial irregularities in the Hungarian subsidiary, the announced intention of focusing efforts in Poland has resulted in more than EUR 100 million of adjudicated civil construction works in this region, since January 2010. Together with the award of the motorway concession D1 in Slovakia, these are positive signals in the midst of less favorable economic conditions. Again, bad weather conditions in Q1 2010 contributed to a 10.0% yoy decrease in revenues and stagnation is estimated for full-year 2010 in this region. 2011 is expected to be a better year in terms of top line growth and EBITDA margins are expected to be slightly positive. We remain cautious in our estimates, but believe that if large projects like the D1 motorway do not provide high overrun costs or delays, Mota-Engil may be in a good position to finally start having profitable operations in the Central Europe region.
Exchange rate risk cannot be ignored in foreign operations: due to a sharp decrease in the average exchange rate (using the Polish currency as benchmark for this region: average PLN/EUR of 3.51 and 4.32 in 2008 and 2009, respectively), turnover decreased 11.5% in 2009. Actually, if the exchange rate had remained the same, turnover would have grown around 9.1%. This situation seemed to be correcting in 2010, towards 2008 levels, with an average exchange rate, since the beginning of 2010 of 3.98. Revenues for the Central Europe region are estimated using PLN/EUR forward rates.
Africa
Mota-Engil conducts operations in several African countries, but Angola is the jewel in the crown of this segment. The historical presence of the group in Angola leaded to the establishment of a partnership with local economic groups, announced in mid-2009. The creation of Mota-Engil Angola during 2010, which will be owned in 51% by Mota-Engil and in 49% by an Angolan consortium (Sonangol and BPA, among others) was announced on June 16th 2009. On
February 24th, markets were informed that the sale value of the 49% stake is
expected to amount to USD 325 million. On that day, Mota-Engil’s stock depreciated 0.64%, which is a subtle signal that investors expected a higher sale value. Nonetheless, we believe that this partnership puts the company in a good
Constitution of Mota-Engil Angola leads to the sale of a 49% stake to an
MOTA-ENGIL COMPANY REPORT
EQUITY RESEARCH 07JUNE 2010
position to profit from the Angolan expected growth and strong public investment plan for the next years. The macroeconomic situation in Angola differs from the one described in the case of Portugal. Severely affected by the economic crisis (as a major oil exporter, it was affected by the decrease in oil prices), Angola is expected to resume growth in 2010 (IMF predicts a 7.1% real GDP growth in 2010, comparing with -0.4% in 2009), accompanying the positive trend in oil prices. The same positive trend is shown in construction output estimates.
Figure 8 - Angolan Construction Output Growth Estimates:
37.1%
25.6%
12.3% 10.0%
2007 2008 2009E 2010E
Source: Angolan Government.
There is great potential in this country as a large USD 12.7 billion public investment plan is taking place. To be highlighted are the reconstruction of three main railway lines (Luanda-Malange, Lobito-Dem.Rep.Congo and Namibe-Menongue), as well as the north-south highway and the new international airport of Bom Jesus in the north of Luanda with an expected capacity of 15 million passengers. A second phase of the program (2011-2015) includes the construction of a north-south highway through the coast line plus a bridge over the Congo River, plus the construction of several satellite cities. The country’s current highway infrastructure comprises around 75 thousand kilometers, with an additional 12 thousand expected to be added until 2013. Furthermore, the Transports Ministry has announced the construction of two new ports, in Luanda and Cabinda, until 2013. While local companies are gaining relevance in the sector, mostly through subcontracting, it is still dominated by major players from Brazil, China, South Africa and Portugal.
In terms of operational performance, the region has consistently been above the unit’s average, with an EBITDA margin of 17.7% in Q1 2010. However, the high risk associated with such margins must not be forgotten, as Angola has a sovereign credit rating of a junk bond (S&P’s and Moody’s rating is B+). Recently, construction companies have experienced delays in payments from the Angolan government which have a great impact on companies’ working capital needs. Despite the high potential of this region, we remain cautious towards payment periods, especially while oil prices remain below the USD 80 level, which seems to be the case until at least 2011. Consequently, we have estimated
A USD 12.7 billion public investment plan drives double-digit growth estimates
MOTA-ENGIL COMPANY REPORT
EQUITY RESEARCH 07JUNE 2010
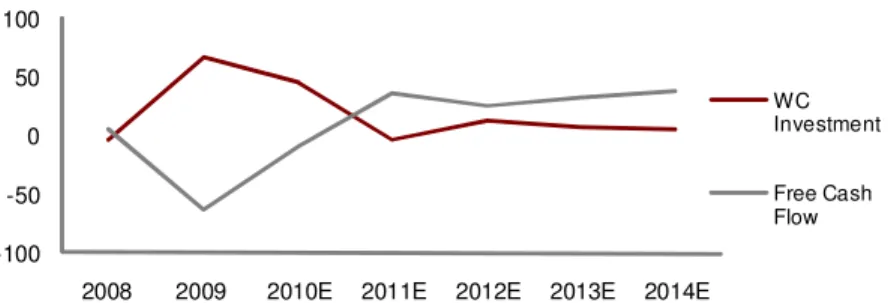
working capital needs of approximately EUR 45 million for 2010, which severely impact the generated free cash flow, as can be seen in the graph below.
Figure 9 – E&C WC Investment and Free Cash Flow:
-100 -50 0 50 100
2008 2009 2010E 2011E 2012E 2013E 2014E
WC Investment
Free Cash Flow
Source: Mota-Engil and Nova Research Team.
Also worth mentioning in this region are the recently awarded construction works in Mozambique: the concession for the construction and operation of the New Tete Bridge, with an estimated investment amount of EUR 106 million (won by a consortium in which Mota-Engil has a 40% stake) and the construction of the Pan-African games city, worth EUR 114 million (won by a consortium with the Portuguese company Soares da Costa, participated in 50% by each company).
America
This region’s visibility within the E&C unit is relatively small. However, efforts to further penetrate the region are taking place, with an acquisition of a 50% stake in a Mexican construction company (yearly revenues of EUR 60 million) having been announced last May. Also, works adjudicated in Peru since January 2010 amount to EUR 110 million. The company has yet to complete an acquisition in Brazil, a country full of potential in the actual macroeconomic environment, which is going to receive the 2014 World Cup (estimated EUR 9 billion of investment in infrastructures) and the 2016 Olympic Games (estimated total investment of EUR 10 billion) and those represent very interesting opportunities for Mota-Engil to enter the market and attention should be paid to future developments. However, we remain cautious towards our forecasts as uncertainty is very high regarding these markets.
Roughly EUR 100 million in works won in
Mozambique
MOTA-ENGIL COMPANY REPORT
EQUITY RESEARCH 07JUNE 2010
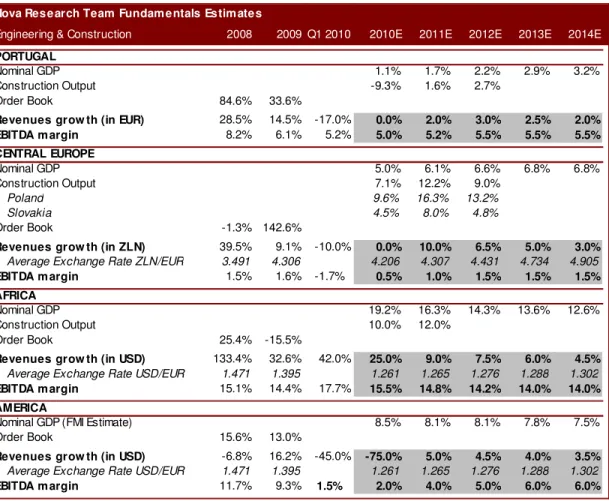
Figure 10 - E&C Revenues Growth and EBITDA Margin Estimates:
Nova Research Team Fundam entals Estim ates
Engineering & Construction 2008 2009 Q1 2010 2010E 2011E 2012E 2013E 2014E
PORTUGAL
Nominal GDP 1.1% 1.7% 2.2% 2.9% 3.2%
Construction Output -9.3% 1.6% 2.7%
Order Book 84.6% 33.6%
Revenues grow th (in EUR) 28.5% 14.5% -17.0% 0.0% 2.0% 3.0% 2.5% 2.0%
EBITDA m argin 8.2% 6.1% 5.2% 5.0% 5.2% 5.5% 5.5% 5.5%
CENTRAL EUROPE
Nominal GDP 5.0% 6.1% 6.6% 6.8% 6.8%
Construction Output 7.1% 12.2% 9.0%
Poland 9.6% 16.3% 13.2%
Slovakia 4.5% 8.0% 4.8%
Order Book -1.3% 142.6%
Revenues grow th (in ZLN) 39.5% 9.1% -10.0% 0.0% 10.0% 6.5% 5.0% 3.0%
Average Exchange Rate ZLN/EUR 3.491 4.306 4.206 4.307 4.431 4.734 4.905
EBITDA m argin 1.5% 1.6% -1.7% 0.5% 1.0% 1.5% 1.5% 1.5%
AFRICA
Nominal GDP 19.2% 16.3% 14.3% 13.6% 12.6%
Construction Output 10.0% 12.0%
Order Book 25.4% -15.5%
Revenues grow th (in USD) 133.4% 32.6% 42.0% 25.0% 9.0% 7.5% 6.0% 4.5%
Average Exchange Rate USD/EUR 1.471 1.395 1.261 1.265 1.276 1.288 1.302
EBITDA m argin 15.1% 14.4% 17.7% 15.5% 14.8% 14.2% 14.0% 14.0% AMERICA
Nominal GDP (FMI Estimate) 8.5% 8.1% 8.1% 7.8% 7.5%
Order Book 15.6% 13.0%
Revenues grow th (in USD) -6.8% 16.2% -45.0% -75.0% 5.0% 4.5% 4.0% 3.5%
Average Exchange Rate USD/EUR 1.471 1.395 1.261 1.265 1.276 1.288 1.302
EBITDA m argin 11.7% 9.3% 1.5% 2.0% 4.0% 5.0% 6.0% 6.0%
Source: Mota-Engil, IMF, Euroconstruct, Angolan Government, Bloomberg and Nova Research Team.
Environment & Services
The E&S unit is composed by four main areas: Waste management, mainly through a 61.5% participation in Suma, the Portuguese market leader; Water distribution, Indaqua is the most visible operator in the sector with a 20% market share in Portugal; Logistics, through TERTIR, port operator of five main Portuguese ports, among others; Multi-services, composed by buildings and industrial management, management of golf clubs and green spaces, and others.
Figure 11 - E&S Revenues Breakdown by Segment and EBITDA margin:
117
249 285
333 365 380
20.8% 23.6% 23.3% 19.9% 19.9% 20.1%
2006 2007 2008 2009 2010E 2011E
Multiservices Logistics Water Waste EBITDA margin
Source: Mota-Engil and Nova Research Team.
MOTA-ENGIL COMPANY REPORT
EQUITY RESEARCH 07JUNE 2010
In 2009, logistics was the most relevant unit in terms of revenues, representing approximately 40.7% of total turnover, followed by the waste management segment (31.2%), by the multi-services segment (14.8%) and by the water distribution segment (13.4%). The effects of the economic slowdown in this business unit were visible mostly at the operational level, with the overall EBITDA margin suffering a 3.4 p.p. decrease from 23.3% in 2008 to 19.9% in 2009 (18.8% in Q1 2010, which represents a 0.2 p.p. yoy increase). In terms of turnover, however, the recession was somewhat overshadowed by the full consolidation of Indaqua in 2009. In Q1 2010, the logistics segment presented a 12.9% yoy increase in turnover, while the water and multi-services segments both registered turnover decreases of 9.1%. There are fundamental differences among these business units in terms of revenues and operational performance dynamics. The waste management and water distribution units consist mostly of concession contracts with municipalities and revenues are quite stable, almost replicating bond-like cash-flows. EBITDA margins are to a large extent determined by the terms of the contracts, consequently depending on the level of competition at the moment of the signing/renewal of the concession contracts. These are interesting businesses that hedge the cyclical nature of the logistics segment. Driven by international trade activity levels, the logistics segment is very sensitive to macroeconomic indicators, such as GDP growth, exports and imports volumes and foreign exchange rates. In addition, the cost structure of the logistics industry is characterized by a large fixed costs component and EBITDA margins are positively correlated with activity levels.
Waste Management
The waste management operations are the second largest in the segment (revenues of EUR 112 million, in 2009), with 2009 yoy turnover growth (10.9%) benefiting from the first consolidation of the Angolan subsidiary Vista Waste. Last May, Mota-Engil announced the acquisition, through its subsidiary Suma, of a 50% stake in the Brazilian waste management company Geo Vision, for approximately EUR 21 million. This company had an annual turnover of approximately EUR 42 million and this acquisition is expected to increase this division’s turnover in EUR 12.5 million already in 2010. Besides announced acquisitions, organic growth is assumed to incorporate only inflation levels and EBITDA margins are expected to remain stable, at the 23.5% level.
As the level of privatization of the sector in Portugal (40%) is still low compared to that of Spain (80%), for instance, the industry is expected to provide interesting acquisition opportunities. International acquisitions are also under the radar of the company, with the announced intention of focusing on the African markets of Cape Verde and Angola as well.
EUR 21 million acquisition in Brazil expected to fuel an otherwise marginal growth
Logistics is the most relevant sector,
responsible for 40.7% of revenues
MOTA-ENGIL COMPANY REPORT
EQUITY RESEARCH 07JUNE 2010
Water Distribution
The water distribution unit was the driver for the E&S segment’s growth in 2009 due to the full consolidation of Indaqua (after the acquisition of 7.2% of Indaqua for EUR 3.6 million) as previously mentioned, but also due to the beginning of the Matosinhos concession. Further privatization of the sector is expected as there are urgent needs to invest in network’s expansion and upgrading, but recent new legislation promoting partnerships between the state and local power are raising doubts towards future growth levels in the industry. As Indaqua faces tough competition from the market players AGS (market leader with 33% of market share) and Aquapor, we applied modest levels of organic growth with stable margins slightly at the 32.5% level. On the other hand, the group informed last March that it won two concessions to construct and operate water treatment stations in Ireland for a period of 20 years, through its subsidiary Glan Aqua. The total value of the contracts is EUR 55.2 million, of which EUR 34.2 million are relative to the operation of the stations. These were the two largest contracts awarded in Ireland in 2009 and they should bring extra 1.7 EUR M per year for the segment, expected to begin in 2011.
Logistics
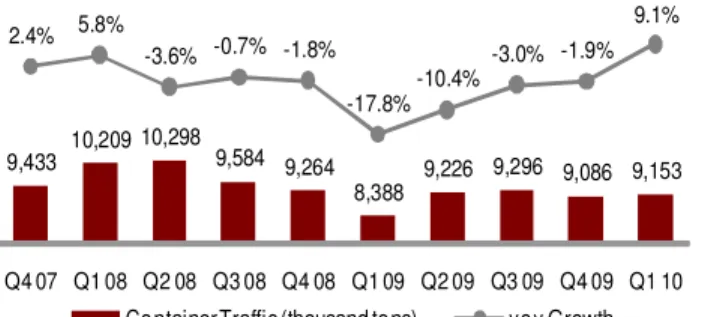
The logistics unit is the most visible in the sector even though it represented 48.3% of the division’s turnover in 2008 and in 2009 this value has decreased to 40.6%. The most important assets of Mota-Engil in this segment are its port concessions, namely through TERTIR, market leader in port container handling in Portugal, which operates the terminals of Leixões (TCL), Lisbon (Liscont and Sotagus), Aveiro (Socarpor), Setúbal (Sadopor) and Figueira da Foz (Liscont). Mota-Engil’s ports’ container traffic has been under pressure since the beginning of 2008, and this negative trend was accentuated during 2009, as a consequence of the global economic slowdown. There was an inversion of this trend in the Q1 2010, but it remains to be seen if this recovery is sustainable in the short-term.
Figure 12 - Total Container Traffic and yoy Growth of Mota-Engil’s ports:
9,433 10,209 10,298 9,584 9,264
8,388 9,226 9,296 9,086 9,153 2.4% 5.8%
-3.6% -0.7% -1.8%
-17.8%-10.4%
-3.0% -1.9% 9.1%
Q4 07 Q1 08 Q2 08 Q3 08 Q4 08 Q1 09 Q2 09 Q3 09 Q4 09 Q1 10 Container Traffic (thousand tons) yoy Growth Source: Instituto Portuário e dos Transportes Marítimos.
MOTA-ENGIL COMPANY REPORT
EQUITY RESEARCH 07JUNE 2010
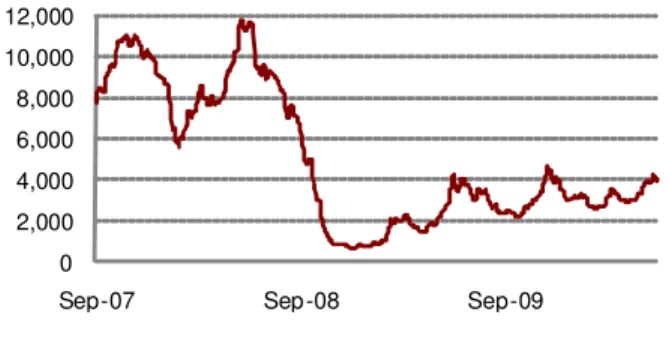
The graph below plots the performance since Q4 2007 of the Baltic Dry Index, which is considered a good measure for global container traffic. It can be observed that the economic downturn has been especially tough on this sector. Regarding the recovery registered in Portugal since the beginning of 2010, the Baltic Dry Index recent performance indicates the same trend, though past positive trends did not last long.
Figure 13 - Baltic Dry Index Price (USD) Performance:
0 2,000 4,000 6,000 8,000 10,000 12,000
Sep-07 Sep-08 Sep-09
Source: Bloomberg.
On the other hand, the award of the Paita port concession in Peru, in April 2009, is a sign that the group is aware of international opportunities, which are a good source of growth as an alternative to the stagnated domestic environment. Our growth expectations are nonetheless modest, in line with the domestic macro environment (a multiple of the nominal GDP).
The port concessions industry is characterized by fairly high fixed costs and EBITDA margins are very dependent on activity levels, as the 7.5 p.p. decrease in the segment’s EBITDA margin from 2008 (23.9%) to 2009 (16.4%) demonstrates. In this sense, we forecast an efficiency improvement as revenues resume growth levels, assuming a modest recovery throughout the years.
In regards to the Alcântara Terminal situation, on April 20th of the current year, Engil informed that the State is contesting the deal made between Mota-Engil and APL (Lisbon Port Administration), in which the concession is prolonged for an additional 27 years as a payment method for the EUR 226.7 million investment that Mota-Engil would undergo in order to expand the terminal’s capacity, for considering it was unconstitutional due to the lack of a public contest, among others. On June 3rd, the parliament approved the annulment of
the contract between Mota-Engil and APL, and Mota-Engil (through Liscont’s CEO) promptly informed that it will ask for financial compensations regarding the annulment of an already signed contract. However, this can take a long time to be solved on court but as the concession finishes in 2015 we expect an outcome to this situation by then.
EBITDA margins show a high sensitivity to activity levels and dropped 7.5% in 2009
Highly dependent on external trade, logistics underperformed during the economic crisis
MOTA-ENGIL COMPANY REPORT
EQUITY RESEARCH 07JUNE 2010
Multi-services
The Multi-services sub-division started 2010 with a disappointing performance both in terms of top line growth (-9.0% yoy) and EBITDA margins (-1.2 p.p. from year-end 2009). In our estimates, we assumed a constant EBITDA margin of 6.5% and a revenues growth which replicates domestic GDP growth estimates.
Figure 14 - E&S Revenues Growth and EBITDA Margin Estimates:
Nova Research Team Revenues Fundam entals Estim ates
Environment & Services 2008 2009 Q1 2010 2010E 2011E 2012E 2013E 2014E … 2020E
Portugal Real GDP 0.04% -2.68% 0.29% 0.65% 0.80% 1.33% 1.43%
Portugal Inflation 2.65% -0.90% 0.84% 1.09% 1.44% 1.59% 1.72% Portugal Nominal GDP 2.69% -3.58% 1.13% 1.74% 2.24% 2.91% 3.15% WASTE
Revenues 17.7% 10.9% 2.0% 15.0% 5.0% 2.0% 2.0% 1.7% 1.7% 1.7% EBITDA M argin 27.3% 23.2% 24.0% 23.5% 23.5% 23.5% 23.5% 23.5% 23.5% 23.5% WATER
Revenues 86.7% 242.9% -9.0% 0.8% 4.5% 1.4% 1.6% 1.7% 1.7% 1.7% EBITDA M argin 32.1% 33.5% 33.0% 32.5% 32.5% 32.5% 32.5% 32.5% 32.5% 32.5% LOGISTIC
Revenues 9.2% 2.1% 13.0% 5.0% 4.4% 4.0% 3.8% 3.8% 3.5% 3.0%
EBITDA M argin 23.9% 16.4% 17.0% 17.5% 18.0% 18.5% 19.0% 20.0% 21.0% 21.0% MULTISERVICES
Revenues 54.5% 39.5% -9.0% 1.1% 1.7% 2.2% 2.9% 3.2% 3.0% 3.0% EBITDA M argin 8.4% 7.2% 6.0% 6.5% 6.5% 6.5% 6.5% 6.5% 6.5% 6.5%
Source: Mota-Engil, IMF and Nova Research Team.
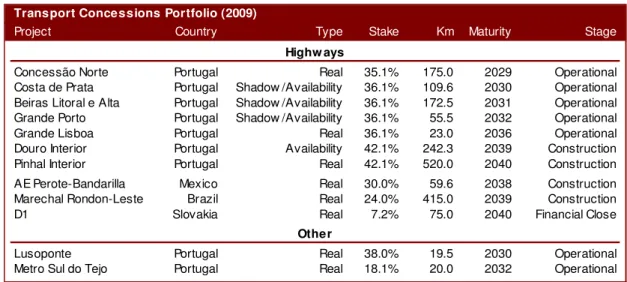
Transport Concessions
In the past two years, Mota-Engil has been awarded five new concessions, doubling the number of concessions in its total portfolio.
Figure 15 - Mota-Engil’s Transport Concessions Portfolio (2009):
Transport Concessions Portfolio (2009)
Project Country Type Stake Km Maturity Stage
Concessão Norte Portugal Real 35.1% 175.0 2029 Operational
Costa de Prata Portugal Shadow /Availability 36.1% 109.6 2030 Operational Beiras Litoral e Alta Portugal Shadow /Availability 36.1% 172.5 2031 Operational Grande Porto Portugal Shadow /Availability 36.1% 55.5 2032 Operational
Grande Lisboa Portugal Real 36.1% 23.0 2036 Operational
Douro Interior Portugal Availability 42.1% 242.3 2039 Construction
Pinhal Interior Portugal Real 42.1% 520.0 2040 Construction
AE Perote-Bandarilla Mexico Real 30.0% 59.6 2038 Construction
Marechal Rondon-Leste Brazil Real 24.0% 415.0 2039 Construction
D1 Slovakia Real 7.2% 75.0 2040 Financial Close
Lusoponte Portugal Real 38.0% 19.5 2030 Operational
Metro Sul do Tejo Portugal Real 18.1% 20.0 2032 Operational
Highw ays
Other
Source: Mota-Engil.
The current operational portfolio is composed by two real toll concessions (Concessão Norte, Grande Lisboa) and by three shadow tolls (Costa da Prata,
MOTA-ENGIL COMPANY REPORT
EQUITY RESEARCH 07JUNE 2010
Beiras Litoral e Alta and Grande Porto). Additionally, Mota-Engil was awarded the concessions of Douro Interior and Pinhal Interior in Portugal, Marechal Rondon-Leste in Brazil, Perote-Bandarilla in Mexico and the D1 concession in Slovakia (which will be signed as soon as the financing is closed). The company also holds a 38.0% stake in Lusoponte and an 18.1% participation in Metro Sul do Tejo. The main reason why Mota-Engil altered the consolidation method of the concessions unit from the proportionate method to the equity method was the contribution of this unit to increasing consolidated debt levels, which allegedly gave investors a wrong idea of the company’s ability to repay its debt.
Figure 16 – Net Debt/EBITDA ratio per business unit:
2x 2.7x
4.8x 6x
9.3x
12.4x
2008 2009
Engineering & Construction Environment & Services Transport Concessions
Source: Mota-Engil.
Consolidated Net Debt/EBITDA went from 7.5x in 2009 (including transport concessions) to 5.2x in Q1 2010 (excluding transport concessions). The high Net Debt/EBITDA ratio in this unit (12.4x in 2009) is explained by the fact that only six concessions are returning cash flow (two of them just since mid-2009), and further investments in the recently awarded concessions are expected to further increase the unit’s debt proportion. However, the majority of the debt in the transport concessions unit is non-recourse debt (non-recourse debt represented 78.8% of total transport concessions debt, in 2009), as concessions use a project financing structure, where the financing of the project is based upon the cash flows generated by the project rather than upon the balance sheet of the project’s sponsors. On one hand, the consolidated Net Debt/EBITDA ratio including non-recourse debt underestimates the company’s ability to repay debt. On the other hand, the fact that Mota-Engil does not consolidate the transport concessions unit proportionally means that the division is not subject to segment reporting. This is negative in our view, as it dramatically decreases the unit’s visibility and information availability for investors.
Based on the information available (until 2009), we can see that Mota-Engil’s TC EBITDA margin is considerably higher than that of comparable companies, and this is due to the fact that Mota-Engil’s portfolio is composed by three shadow tolls and only two real tolls (Grande Lisboa initiated operations only in the end of 2009). In this sense, we considered different dynamics for real and shadow tolls.
MOTA-ENGIL COMPANY REPORT
EQUITY RESEARCH 07JUNE 2010
Figure 17 – Mota-Engil TC EBITDA Margin vs. Comparables:
100.6% 89.7%
70.2% 61.3% 71.2%61.9%
2008 2009
Mota-Engil Brisa Abertis
Source: Companies’ financial statements.
Real Tolls
Besides the fact that real tolls have a larger relative cost structure than shadow tolls, another major difference is the fact that real tolls’ traffic risk lays on the side of the concession sponsors: revenues depend on traffic figures. We estimated average daily traffic (“ADT”) figures based on GDP growth, multiplied by a factor which depends on the stage of the concession (“Ramp-up” – first 3 years, “Deceleration” – years 4-8 and “Maturity” – from year 9 on). Revenues were then calculated according to ADT levels and to an estimated tariff per kilometer (based on historical information). Tariffs were considered to grow with inflation.
Figure 18 – Real Tolls Revenues Growth and EBITDA Margin Estimates:
Nova Research Team Fundam entals Estim ates
Real Tolls 2010E 2011E 2012E 2013E 2014E 2015E 2016E 2017E … 2036E
GDP real grow th 0.3% 0.7% 0.8% 1.3% 1.4% 1.4% 1.4% 1.4% 1.4% 1.4%
Inflation 0.8% 1.1% 1.4% 1.6% 1.7% 1.8% 1.8% 1.8% 1.8% 1.8%
Concessão Norte Deceleration Maturity
Multiplier 5.0 4.0 3.0 2.0 1.8 1.5 1.5 1.5 1.5
ADT 10,069 10,332 10,580 10,861 11,132 11,366 11,604 11,848 12,097 Tariff per km 0.104 0.120 0.134 0.142 0.144 0.147 0.149 0.151 0.154
EBITDA margin 90% 90% 90% 90% 90% 90% 90% 90% 90%
Grande Lisboa Ramp-up Deceleration Maturity
Multiplier 4.0 5.0 6.0 5.0 4.0 3.0 2.0 1.8 1.5 1.5
ADT 14,359 14,828 15,540 16,569 17,515 18,250 18,761 19,221 19,624 28,527 Tariff per km 0.034 0.043 0.050 0.053 0.056 0.060 0.064 0.068 0.073 0.236
EBITDA margin 80% 80% 80% 80% 80% 80% 80% 80% 80% 80%
Source: IMF and Nova Research Team.
Shadow/Availability Tolls
The Portuguese government has long announced the intention of changing the model currently in place for the financing of motorways, namely the end of the so-called shadow tolls. The current economic crisis and consequent increase of the Portuguese public deficit have accelerated the process and the change will happen in July 2010 (with the exception of the Beiras Alta e Litoral concession, which is expected to happen in 2011). Mota-Engil had published a note in late 2009, stating that an agreement was signed with the Portuguese government, which foresaw a new financing model for shadow tolls: availability tolls, which are not free to the user, but where payments to concession’s sponsors will still
Shadow tolls provide a higher EBITDA margin than comparable companies
Traffic risk is on Mota’s side in real tolls
MOTA-ENGIL COMPANY REPORT
EQUITY RESEARCH 07JUNE 2010
happen through Estradas de Portugal, depending on service availability instead of traffic levels. This means that the traffic risk will be transferred to the public entity, while previously it was shared with the sponsor (tariffs varied negatively with traffic levels). A full disclosure of tariffs to be paid is not yet available, but the note explained that the new fees will be calculated in order to maintain each concession’s IRR. This has two main impacts for our valuation assumptions of shadow tolls: the first is that revenues are now closer to fixed payments, with tariffs varying only with inflation (assuming each concession is always completely available), which reduces the downside potential of low traffic levels, but also the upside potential of high traffic levels; the second is a lower, almost bond-like risk for the concession sponsors, which we reflected upon the concession’s cost of equity. EBITDA margins for shadow/availability tolls are 93%.
Martifer
Martifer is a Portuguese holding company dedicated to two main industries: metallic constructions and alternative energies. The alternative energies segment is further divided into three different business units: energy equipments, solar energy and wind energy. Mota-Engil holds a 37.5% stake in Martifer.
In 2009, operational profits amounted to a total of EUR 606 million, representing a 4.6% yoy decrease. Of these operational profits, metallic constructions represented 52.1%, followed by wind energy (21.5%), by solar energy (21.5%) and by energy equipments (3.6%). The group’s consolidated EBITDA margin improved 1.3 p.p. from 9.7% in 2008 to 11.0% in 2009, resulting in a EUR 66.8 million EBITDA. The group is geographically diversified, with 53.7% of 2009 operational profits driven by international activity. It is present in Spain, Poland, Romania, Germany, Australia, Brazil and the USA.
In 2009, the sale of the participation in the German alternative energy company Repower Systems resulted in a capital gain of EUR 161 million, which was the main driver of a record net income of EUR 100 million. Without this non-recurrent capital gain, Martifer’s net income would have amounted to EUR 3.7 million, a 51.9% decrease comparing to 2008 figures. Mota-Engil consolidates Martifer through the equity method, and this resulted in an approximately EUR 40 million non-recurrent gain in 2009. In Q1 2010, Martifer’s net income grew 370% yoy to EUR 2.1 million. This was also due to non-recurrent capital gains from the sale of 15% of Ventinvest to Galp and of 11% of Prio Foods and Prio Energy. In fact, Martifer’s Q1 2010 did not perform well, as operational profits decreased 29.6%, to EUR 103 million. This decrease is explained by a general economic slowdown and adverse financial markets conditions, which reduced demand for alternative energy equipments and projects. Consequently, the company’s stock has fallen since the beginning of the year and Martifer’s market cap is currently at record low levels (EUR 175 million).
Non-recurring gains aside, Martifer’s operations have seen better times
Availability tolls: paid by the user to the state, who then pays sponsors according to service availability, eliminating traffic risk
MOTA-ENGIL COMPANY REPORT
EQUITY RESEARCH 07JUNE 2010
Figure 19 - Martifer Share Price (EUR):
0 2 4 6 8 10
Jan-08 Jan-09 Jan-10
Source: Bloomberg.
Shareholder Structure
Mota-Engil is controlled by the Mota Family, who owns approximately 60.0% of the company. Free-float represents around one third of the company’s stock. This shareholder structure is positive for the company’s operations, as it provides mid-term stability in terms of the strategy pursued. On the other hand, it reduces the stock’s liquidity and could even represent a threat for free-float investors in the sense that there is a major shareholder whose interests might not be just economical (for instance, it would be very hard for a public tender offer on Mota-Engil to be successful, even at a high premium price).
Figure 20 - Mota-Engil’s Shareholder Structure (2009):
Source: Mota-Engil.
Valuation
We value Mota-Engil using a Sum of the Parts approach to properly assess the value of each business unit. In detail, the E&C unit is valued using a DCF-WACC (WACC = 8.5%) until 2014 plus a terminal value that is considered as a growing perpetuity (perpetuity growth = 2.0%). The current valuation implies an EV/EBITDA multiple of 3.8x. The same methodology was applied to the E&S division (WACC = 7.4%; perpetuity growth = 1.5%), except the DCF period is until 2020. The current valuation implies an EV/EBITDA multiple of 8.6x. The 37.5% strategic stake held in Martifer is being valued at market value, as of June
Mota Familly, 60%
Privado Holding, 5% Nmás 1
Agência de Valores, 2%
Free-float, 33%
Market Cap 04.06.2010 = EUR 175 million
MOTA-ENGIL COMPANY REPORT
EQUITY RESEARCH 07JUNE 2010
4th 2010 (EUR 175 million). The sum of these three components is the enterprise
value excluding TC. Regarding the TC division, each concession was valued separately, as different dynamics are in place for each concession. Operational concessions are valued with a DCF-FTE method, due to the project finance nature of Mota-Engil’s transport concessions and consequent lack of a stable capital structure. Moreover, no terminal value was considered for any concession as it is not reasonable to expect a perpetual maintenance of these operations. The recently awarded concessions which are not yet operational were valued based on the amount invested in equity. Lusoponte is being valued at its transaction price in January 2009.
Figure 21 - Mota-Engil Sum of the Parts Valuation:
Sum of the Parts Valuation Method Value
Engineering & Construction DCF/WACC 520.7
Environment & Services DCF/WACC 620.5
Martifer Market Value 65.6
E nter pr ise Value FY10 (excl. Transport Concessions) 1,206.8
Equity Value Transport Concessions 545.2
Concessão Norte DCF/FTE 10.1
Costa de Prata DCF/FTE 115.9
Beiras Litoral e Alta DCF/FTE 181.8
Grande Porto DCF/FTE 46.0
Grande Lisboa DCF/FTE 2.6
Douro Interior Investment IRR 13.4
Pinhal Interior Investment IRR 15.0
Perote-Bandarilla Investment IRR 4.1
Marechal Rondon-Leste Investment IRR 6.4
D1 Investment IRR 10.8
Lusoponte Transaction Value 139.1
Net Debt FY10 843.0
Treasury Stock Market Value 23.2
Minorities 111.0
Equity Value FY10 774.9
# Shares Outstanding (millions) 193,628
Target Price FY10 4.00
Price Mota-Engil as of 04.06.2010 2.11
Upside Potential 89.6%
Recom mendation BUY
Source: Mota-Engil, Bloomberg and Nova Research Team.
Engineering & Construction DCF
The operational performance of the E&C unit is expected to maintain modest growth levels and stable EBITDA margins. However, the difficulties most construction companies have been facing in some markets in terms of payment schedules (the government of Angola owes more than EUR 2.3 billion to construction companies, of which EUR 1.5 billion to Portuguese construction companies), have put pressure in current liquidity. This was reflected in Mota-Engil’s 2009 cash flow statement, with a EUR 67.0 million investment in working capital and a negative free cash flow of EUR 62.9 million. We believe this situation will improve during 2010, as the Portuguese finance minister recently
MOTA-ENGIL COMPANY REPORT
EQUITY RESEARCH 07JUNE 2010
announced the creation of a EUR 500 million credit line for the state of Angola to pay Portuguese construction companies. However, we maintain a cautious approach and expect this problem to be completely solved only in 2011. Consequently, CAPEX is expected to be more modest than what it has historically been. Q1 2010 figures indicate that this is the case, as CAPEX amounted to EUR 14 million in this period, comparing to an investment of EUR 24 million in the same period in 2009.
Figure 22 - E&C DCF (2010-2014):
Engineering & Construction
DCF 2008 2009 2010E 2011E 2012E 2013E 2014E
EBITDA 129.7 134.1 137.3 146.2 155.0 160.3 164.8
EBIT 74.0 78.0 70.9 77.0 81.6 83.0 84.1
(+) Depreciation 55.7 56.1 66.4 69.3 73.4 77.3 80.7
(-) Taxes on EBIT 10.0 16.0 17.7 19.2 20.4 20.8 21.0
(-) WC Investment -4.0 67.0 45.0 -4.2 12.0 7.8 6.3
(-) CAPEX 119.0 114.0 84.2 95.5 97.5 98.8 99.8
FCF 4.7 -62.9 -9.7 35.7 25.1 33.0 37.7
Source: Mota-Engil and Nova Research Team.
The assumptions for the DCF calculation are as follows:
Figure 23 - E&C DCF Assumptions:
Engineering & Construction
DCF Assumptions Value Comments
Risk Free (Rf) 2.65% 10-Year German Bond Yield
Beta (β ) 1.22 Peer group average
Risk Premium (Rp) 5.0%
Country Risk Premium (RCp) 3.7% Weighted average (by segment Q1 2010 revenues)
Portugal 1.3% estimated default spread Central Europe 1.6% estimated default spread Africa 7.1% estimated default spread America 2.8% estimated default spread
Cost of Equity (Ke) 12.4% Rf + β * Rp + CRp
Cost of Debt (Kd) 7.1% Rf + 450 basis points prem ium
Tax Rate (t) 25.0% Portuguese IRC rate
Target Capital Structure
Equity (We) 45% Target D/E ratio 2014
Debt (Wd) 55%
WACC 8.5% Ke * We + Kd * Wd * (1-t)
Real perpetuity grow th 0.5%
Inflation 1.5%
Perpetuity grow th 2.0%
Source: Mota-Engil, Bloomberg, Damodaran and Nova Research Team.
An 8.5% WACC was used to discount the estimated free cash flows. We assumed a target debt-to-equity ratio based on our 2014 balance sheet estimate and a tax rate of 25% (the Portuguese IRC rate).
The cost of debt (“Kd”) was calculated by adding 450 basis points (“b.p.”) to the market risk-free rate (10-Year German bond), which resulted in a 7.1% Kd.
MOTA-ENGIL COMPANY REPORT
EQUITY RESEARCH 07JUNE 2010
A 12.4% cost of equity (“Ke”) was used in the E&C DCF calculation, which was calculated by adding a risk-free rate (10-Year German Bond) to an average historical risk premium (5.0%) multiplied by a beta (constructed using an industry peer group benchmark4) and finally adding a country risk premium.
The E&C country risk premium was calculated by using a weighted average of the each country’s default risk. The weight of each region was estimated based on information made public by the company and each country’s default risk was estimated based on the country’s sovereign debt rating. Transforming the rating into a spread was done using Damodaran’s method and this was then multiplied by 1.5 to reflect the excess volatility of equity markets over bond markets.
Figure 24 - Equity Default Spread by Segment:
Equity Default Spread by Segm ent
Moody's S&P's Fitch Weight SPREAD
Portugal Aa2 A- AA- 100.0% 128 b.p.
Central Europe 155 b.p.
Poland A2 A- A- 53.4%
Slovakia A1 A+ A+ 46.6%
Africa 705 b.p.
Angola B1 B+ n.r. 60.3%
Malaw i n.r. n.r. n.r. 25.5%
Mozambique n.r. B+ B 14.2%
Am erica 280 b.p.
Mexico Baa1 BBB BBB 50.0%
Peru Baa3 BBB- BBB- 50.0%
Source: Mota-Engil, Bloomberg, Damodaran and Nova Research Team.
Environment & Services DCF
The E&S DCF already incorporates the recent acquisition of Geo Vision, for about EUR 21 million. However, CAPEX in 2010 is expected to be lower than in 2009 (EUR 86 million), which included two big acquisitions, namely Takargo (EUR 16 million) and Indaqua (EUR 32 million).
Figure 25 - E&S DCF (2010-2020):
Environm ent & Services
DCF 2008 2009 2010E 2011E 2012E 2013E 2014E 2015E 2016E 2017E 2018E 2019E 2020E
EBITDA 66.4 66.2 72.5 76.5 79.3 82.2 86.0 89.9 91.9 94.5 96.9 99.3 101.7
EBIT 47.0 37.0 41.6 44.6 47.1 49.6 53.0 56.6 58.1 60.4 62.4 64.4 66.3
(+) Depreciation 19.4 29.2 30.9 31.9 32.3 32.6 33.0 33.4 33.7 34.1 34.5 34.9 35.4 (-) Tax on EBIT 11.0 9.0 10.4 11.2 11.8 12.4 13.3 14.1 14.5 15.1 15.6 16.1 16.6 (-) WC Investment 38.0 -13.0 9.5 1.5 1.1 1.1 1.1 1.1 1.1 1.1 1.2 1.2 1.2 (-) CAPEX 67.0 86.0 56.7 40.5 41.1 41.7 42.3 42.9 43.5 44.1 44.7 45.4 44.1 FCF -46.5 -12.1 -0.3 27.3 29.6 31.4 33.9 36.6 37.6 39.1 40.5 41.9 45.2
Source: Mota-Engil and Nova Research Team.
4 The industry peer group includes Soares da Costa, Teixeira Duarte, FCC, Vinci, Eiffage, Hochtief, Bilfinger Berger, Strabag and Skanska.
Each country’s equity default considered in the WACC calculation
MOTA-ENGIL COMPANY REPORT
EQUITY RESEARCH 07JUNE 2010
A 7.4% WACC was used to discount the estimated free cash flows. We assumed a target debt-to-equity ratio based on what we believe is a sustainable capital structure and a tax rate of 25% (the Portuguese IRC rate).
The Kd was calculated by adding 200 b.p. to the market risk-free rate (10-Year Portuguese bond), which resulted in a 6.8% Kd.
A 10.2% Ke was used in the E&S DCF calculation, which was calculated by adding a risk-free rate (10-Year Portuguese Bond) to a historical risk premium (5.0%) multiplied by a beta (constructed using an industry peer group benchmark5).
Figure 26 - E&S DCF Assumptions:
Environm ent & Services
DCF Assumptions Value Comments
Risk Free (Rf) 4.8% 10-Year Portuguese Bond Yield
Beta (β) 1.08 Peer group average
Risk Premium (Rp) 5.0%
Cost of Equity (Ke) 10.2% Rf + β * Rp
Cost of Debt (Kd) 6.8% Rf + 200 basis points prem ium
Tax Rate (t) 25.0% Portuguese IRC rate
Target Capital Structure
Equity (We) 45%
Debt (Wd) 55%
WACC 7.4% Ke * We + Kd * Wd * (1-t)
Real perpetuity grow th 0.5%
Inflation 1.0%
Perpetuity grow th 1.5%
Target D/E ratio 2020
Source: Mota-Engil, Bloomberg, Damodaran and Nova Research Team.
Transport Concessions DCF
Operational Concessions
We value each concession using a DCF-FTE method due to the project finance nature of each concession project (no target debt-to-equity ratio can be estimated). CAPEX is based on the estimated investment value minus last reported revertible fixed assets, divided by the remaining years of the concession. Depreciation is the sum of depreciation from revertible fixed assets and from CAPEX. Debt payments were based on each concession financing facilities and corresponding payments were assumed to be constant. Mota-Engil released a note in 2009, which informed about an agreement with the Portuguese government regarding pending financial compensations to AENOR, which were to be set in EUR 155 million. This amount was added to the calculation of the concession’s free cash flow to equity (“FCFE”) in 2010.
5 The industry peer group includes Aguas de Barcelona, Suez Environment and Veolia Environment.
MOTA-ENGIL COMPANY REPORT
EQUITY RESEARCH 07JUNE 2010
Figure 27 - TC DCF for Operational Concessions:
Transport Concessions
DCF 2010E 2011E 2012E 2013E 2014E … 2029E 2030E 2031E 2032E … 2036E
Concessão Norte (Real toll)
Net Profit -46.2 -40.1 -35.0 -27.1 -22.2 56.5 63.1 (+) Depreciation 61.0 66.2 71.4 71.4 71.4 71.4 71.4 (+) Financial Compensation 155.0
(-) CAPEX 25.9 25.9 25.9 25.9 25.9 25.9 25.9
(-) Debt Change 34.5 38.7 51.4 51.4 51.4 51.4 51.4 FCFE 109.4 -38.5 -41.0 -33.1 -28.2 50.5 57.2
Grande Lisboa (Real toll)
Net Profit -3.8 -3.7 -3.7 -3.9 -4.0 8.9 10.5 12.2 14.0 16.0 23.1 25.8
(+) Depreciation 5.5 6.5 7.5 8.5 9.5 9.5 9.5 9.5 9.5 9.5 9.5 9.5
(-) CAPEX 5.0 5.0 5.0 5.0 5.0 5.0 5.0 5.0 5.0 5.0 5.0 5.0
(-) Debt Change 2.0 2.0 2.0 2.0 2.0 2.0 2.0 2.0 2.0 2.0 0.0 0.0
FCFE -5.4 -4.3 -3.3 -2.4 -1.5 11.4 12.9 14.6 16.5 18.5 27.5 30.2
Costa de Prata (Shadow toll)
Net Profit 19.1 19.4 20.0 21.4 22.9 45.2 46.3 47.4
(+) Depreciation 19.5 20.6 21.7 21.7 21.7 21.7 21.7 21.7
(-) CAPEX 5.6 5.6 5.6 5.6 5.6 5.6 5.6 5.6
(-) Debt Change 16.2 16.2 16.2 16.2 16.2 0.0 0.0 0.0 FCFE 16.7 18.2 19.8 21.3 22.8 61.2 62.4 63.5
Beiras Litoral e Alta (Shadow toll)
Net Profit 25.1 26.7 28.6 32.0 35.4 88.9 92.2 94.5 96.8
(+) Depreciation 43.8 45.4 47.1 47.1 47.1 47.1 47.1 47.1 47.1
(-) CAPEX 8.3 8.3 8.3 8.3 8.3 8.3 8.3 8.3 8.3
(-) Debt Change 41.6 41.6 41.6 41.6 41.6 22.4 0.0 0.0 0.0
FCFE 18.9 22.2 25.8 29.1 32.6 105.3 130.9 133.2 135.6
Grande Porto (Shadow toll)
Net Profit 1.6 1.9 2.4 4.3 6.3 36.9 39.2 40.9 42.7 44.0
(+) Depreciation 30.0 31.8 33.7 33.7 33.7 33.7 33.7 33.7 33.7 33.7
(-) CAPEX 9.3 9.3 9.3 9.3 9.3 9.3 9.3 9.3 9.3 9.3
(-) Debt Change 26.4 26.4 26.4 26.4 26.4 26.4 13.0 13.0 0.0 0.0
FCFE -4.1 -1.9 0.4 2.3 4.3 34.9 50.5 52.3 67.1 68.4
Source: Mota-Engil and Nova Research Team.
For the real toll concessions, a cost of equity was calculated using an industry6
average equity beta. As was mentioned before, there is a different risk profile in the new financing model of the shadow toll concessions (availability tolls), in relation to real tolls. We incorporated this difference in the calculation of the cost of equity, by applying a 20% discount in the beta, in order to reflect a lower volatility of cash flows to equity of the new shadow tolls model.
6 Peer group is composed by Brisa, Abertis, Societe des Autoroutes Paris and Autostrada.
MOTA-ENGIL COMPANY REPORT
EQUITY RESEARCH 07JUNE 2010
Figure 28 - E&C DCF Assumptions:
Transport Concessions
DCF Assumptions Value Comments
Risk-free (Rf) 4.83% Portuguese 10-Year Bond Yield
Beta (b) 0.83 Peer group average
Risk-Premium 5.00%
Cost of Equity (Ke) 8.98% Ke = Rf + β * Rp + CRp
Risk-free (Rf) 4.83% Portuguese 10-Year Bond Yield
Beta (b) 0.66 Peer group average w ith a 20% discount
Risk-Premium 5.00%
Cost of Equity (Ke) 8.15% Ke = Rf + β * Rp + CRp
Real Tolls
Shadow Tolls
Source: Bloomberg and Nova Research Team.
Non-operational Concessions
Given the lack of information available to value these concessions, we use an IRR-based approach to assess each concession value.
Starting from an estimated 10.5% requested IRR in domestic operations we added 0.5% to the Mexican concession demanded IRR, 1.0% to the Brazilian concession and less 0.5% to the Slovakian concession. The cost of equity for each country was estimated using the same method as explained in the E&C DCF part of this report.
Figure 29 - E&C DCF Assumptions:
Non-ope r ational Conce s s ions
in EUR million
Total Investment
Equity
Investment Stake
Attributable
Equity IRR
Cost of
Equity Value
Douro Interior 940 188 42.1% 79.1 10.5% 8.98% 13.4
Pinhal Interior 1,429 210 42.1% 88.4 10.5% 8.98% 15.0
AE Perote-Bandarilla 400 80 30.0% 24.0 11.0% 9.40% 4.1
Marechal Rondon-Leste 964 154 24.0% 37.0 11.5% 9.80% 6.4
D1 3,300 660 7.2% 47.5 10.0% 8.15% 10.8
Source: Bloomberg and Nova Research Team.
Non-operational
MOTA-ENGIL COMPANY REPORT
EQUITY RESEARCH 07JUNE 2010
The Sector
Comparables
Figure 30 - Comparables:
Comparables
Company 09 10E 11E 09 10E 11E 09 10E 11E 09 10E 11E
Mota-Engil 1.3 x 1.2 x 1.1 x 9.5 x 8.7 x 7.8 x 16.4 x 14.5 x 12.6 x 6.9 x 11.6 x 8.2 x
Grupo Soares Da Costa 0.9 x 0.8 x 0.7 x 9.2 x 7.3 x 6.1 x 16.2 x n.a. n.a. 12.4 x 7.9 x 4.7 x
Teixeira Duarte 2.1 x 1.9 x 1.8 x 13.0 x 12.7 x 12.1 x 17.7 x 17.6 x 16.9 x 3.2 x 2.3 x 4.6 x
FCC 0.9 x 0.8 x 0.8 x 7.6 x 7.3 x 7.0 x 15.3 x 13.9 x 13.3 x 9.5 x 9.5 x 8.7 x
Vinci 1.1 x 1.1 x 1.0 x 6.9 x 7.1 x 6.7 x 11.3 x 11.2 x 10.4 x 13.4 x 13.2 x 12.0 x
Eiffage 1.2 x 1.3 x 1.2 x 9.1 x 8.8 x 8.3 x 16.1 x 16.1 x 14.7 x 17.9 x 14.5 x 11.9 x
Hochtief 0.3 x 0.3 x 0.3 x 5.3 x 5.2 x 4.9 x 11.1 x 9.7 x 8.8 x 20.5 x 17.9 x 15.6 x
Bilfinger Berger 0.4 x 0.4 x 0.4 x 9.1 x 7.0 x 7.1 x 14.4 x 9.7 x 9.9 x 15.7 x 9.6 x 9.6 x
Strabag 0.2 x 0.2 x 0.2 x 2.8 x 3.3 x 3.3 x 6.0 x 7.9 x 8.2 x 13.3 x 13.3 x 13.2 x
Skanska 0.3 x 0.3 x 0.3 x 6.5 x 7.5 x 7.4 x 8.4 x 9.8 x 9.9 x 13.4 x 15.5 x 15.0 x
Average Construction 0.8 x 0.8 x 0.7 x 7.7 x 7.4 x 7.0 x 13.0 x 12.0 x 11.5 x 13.3 x 11.5 x 10.6 x
Aguas De Barcelona 2.7 x 1.7 x 1.7 x 9.3 x 7.6 x 7.3 x 14.2 x 11.1 x 10.8 x 17.9 x 22.1 x 21.0 x
Suez Environnement 1.2 x 1.1 x 1.1 x 8.3 x 6.7 x 6.0 x 15.9 x 14.0 x 12.2 x 19.2 x 17.8 x 15.1 x
Veolia Environnement 0.9 x 0.9 x 0.8 x 9.1 x 7.9 x 7.4 x 17.0 x 14.7 x 13.5 x 19.6 x 18.1 x 15.7 x
Average Environment 1.6 x 1.2 x 1.2 x 8.9 x 7.4 x 6.9 x 15.7 x 13.3 x 12.2 x 18.9 x 19.3 x 17.2 x
WEIGHTED AVERAGE 0.9 x 0.9 x 0.8 x 8.1 x 7.4 x 7.0 x 13.9 x 12.4 x 11.7 x 15.1 x 14.2 x 12.9 x
EV/Sales EV/EBITDA EV/EBIT PER
Source: Mota-Engil, Bloomberg and Nova Research Team.
Multiples Valuation
A valuation with multiples suggests that the E&C unit is largely undervalued while the E&S unit is more in line with multiples valuation, slightly overvalued. The difference of value is explained by the fact that the peer group used for the construction industry is composed by companies which are largely diversified and exposed to other industries, such as Teixeira Duarte (several relevant financial participations BCP that, by not providing sales or EBITDA, overestimate the multiples), Vinci (large exposure to concessions, which overestimates the multiple). In this sense, it is very hard to find clean construction multiples as most construction companies are large holdings exposed to many other industries and multiple valuations must be interpreted at face value.
Figure 31 - Multiples Valuation:
Multiples Valuation
in EUR million 2009 2010 2011 Multiple
Engineering & Construction 1378.2 1373.4 1377.4 EV/Sales EV10 = EUR 520.7 million 1034.2 1010.2 1020.1 EV/EBITDA
1010.1 851.0 885.0 EV/EBIT
1140.8 1078.2 1094.2 Average
Environment & Services 527.9 449.0 461.2 EV/Sales
EV10 = EUR 620.5 million 587.8 490.3 457.4 EV/EBITDA
580.9 490.3 450.5 EV/EBIT
565.5 476.5 456.4 Average Source: Mota-Engil, Bloomberg and Nova Research Team.