www.jped.com.br
ORIGINAL
ARTICLE
Growth
and
development
and
their
environmental
and
biological
determinants
夽
Kelly
da
Rocha
Neves,
Rosane
Luzia
de
Souza
Morais
∗,
Romero
Alves
Teixeira,
Priscilla
Avelino
Ferreira
Pinto
PostgraduatePrograminHealth,SocietyandEnvironment(SaSA),UniversidadeFederaldosValesdoJequitinhonhaeMucuri (UFVJM),Unaí,MG,Brazil
Received25March2015;accepted5August2015 Availableonline6January2016
KEYWORDS Failuretothrive; Childdevelopment; Childhealth
Abstract
Objective: Toinvestigate childgrowth,cognitive/language development,andtheir environ-mentalandbiologicaldeterminants.
Methods: This was across-sectional, predictivecorrelationstudy withall 92 children aged 24---36monthswhoattendedthemunicipalearlychildhoodeducationnetworkinatowninthe ValedoJequitinhonha region,in2011.The socioeconomicprofilewasdeterminedusingthe questionnaireoftheAssociac¸ãoBrasileiradeEmpresasdePesquisa.Thesocio-demographicand maternal andchildhealthprofileswere createdthroughaself-preparedquestionnaire.The height-for-ageindicatorwasselected torepresentgrowth. Cognitive/languagedevelopment wasassessedthroughtheBayleyScaleofInfantandToddlerDevelopment.Thequalityof educa-tionalenvironmentswasassessedbyInfant/ToddlerEnvironmentScale;thehomeenvironment was assessedbytheHomeObservationfor MeasurementoftheEnvironment. The neighbor-hoodqualitywasdeterminedbyaself-preparedquestionnaire.Amultivariatelinearregression analysiswasperformed.
Results: FamilieswerepredominantlyfromsocioeconomicclassD,withlowparental educa-tion.Theprevalenceofstuntedgrowthwas14.1%;cognitiveandlanguagedevelopmentwere belowaverageat28.6%and28.3%,respectively.Educationalinstitutionswereclassifiedas inad-equate,and69.6%ofhomeswereclassifiedaspresentingariskfordevelopment.Factorssuch asaccesstoparksandpharmaciesandperceivedsecurityreceivedtheworstscoreregarding neighborhoodenvironment.Biologicalvariablesshowedagreaterassociationwithgrowthand environmentalvariableswithdevelopment.
夽
Pleasecitethisarticleas:daRochaNevesK,deSouzaMoraisRL,TeixeiraRA,PintoPA.Growthanddevelopmentandtheirenvironmental andbiologicaldeterminants.JPediatr(RioJ).2016;92:241---50.
∗Correspondingauthor.
E-mail:[email protected](R.L.deSouzaMorais).
http://dx.doi.org/10.1016/j.jped.2015.08.007
Conclusion: Theresultsshowedahighprevalenceofstuntingandbelow-average resultsfor cognitive/language development among theparticipating children. Bothenvironmental and biological factors were related to growth and development. However, biological variables showedagreaterassociationwithgrowth,whereasenvironmentalvariableswereassociated withdevelopment.
©2015SociedadeBrasileiradePediatria.PublishedbyElsevierEditoraLtda.Allrightsreserved.
PALAVRAS-CHAVE Insuficiênciade crescimento; Desenvolvimento infantil;
Saúdedacrianc¸a
Crescimentoedesenvolvimentoeseusdeterminantesambientaisebiológicos
Resumo
Objetivo: Investigarocrescimentoedesenvolvimentocognitivo/linguagemdecrianc¸aseseus determinantesambientaisebiológicos.
Método: Estudo transversal, correlacional preditivo, com todas as 92 crianc¸as entre 24-36 meses,frequentadorasdaredemunicipaldeeducac¸ãoinfantildeumacidadenoValedo Jequit-inhonha,ano 2011.Trac¸ou-seoperfil econômicoutilizando-se oquestionáriodaAssociac¸ão Brasileira de Empresasde Pesquisa.Operfil sociodemográficoe saúdematerno-infantilpor questionáriopróprio.Elegeu-se o indicadorestatura/idade para representar ocrescimento. Odesenvolvimentocognitivo/linguagemfoiavaliado pormeiodoBayleyScaleofInfantand ToddlerDevelopment.Avaliou-seosambienteseducacionaispeloInfant/ToddlerEnvironment Scale,eoambientedomiciliarpeloHomeObservationfor MeasurementoftheEnvironment. Aferiu-seaqualidadedavizinhanc¸aatravésdequestionáriopróprio.Foramrealizadasanálises deregressãolinearmultivariada.
Resultados: AsfamíliaserampredominantementedaclasseDcombaixaescolaridadedospais. Aprevalênciadedéficitdeestaturafoi14,1%;desenvolvimentoabaixodamédianalinguagem 28,6% e cognitivo 28,3%. As instituic¸ões educacionais classificaram-se como inadequadas e 69,6%dosdomicílioscomo deriscopara odesenvolvimento.Aspectoscomo,disponibilidade deprac¸asefarmáciaseseguranc¸aforamaspectosdepiorpontuac¸ãonoambientevizinhanc¸a. Variáveisbiológicasdemonstrarammaiorassociac¸ãocomocrescimentoevariáveisambientais aodesenvolvimento.
Conclusão: Observou-se elevado déficit de estatura e de resultados abaixo da média para desenvolvimento cognitivo/linguagementreas crianc¸as participantes.Fatores ambientais e biológicosrelacionaram-setantoaocrescimentoquantoaodesenvolvimento.Entretanto, var-iáveisbiológicasdemonstrarammaiorassociac¸ãocomocrescimentoevariáveisambientaiscom odesenvolvimento.
©2015SociedadeBrasileiradePediatria.PublicadoporElsevierEditoraLtda.Todososdireitos reservados.
Introduction
Overthepastfewyears,Brazilhasobservedadecreasein childhoodmortalityrates onaccountof measuressuch as immunization coverage, prenatal care, and breastfeeding promotion.1 In this new scenario, healthcare
profession-als, the government, and researchers have turned their attentiontothemonitoring of adequatechild growthand development.2Once survivalisguaranteed,itisnecessary
to giveall children the opportunity toachieve academic successandreachtheirfullcapacitiesasadults.3
Themonitoringofchildgrowthanddevelopmentis nec-essary, as deficits in these parameterscan have negative effects throughout life. It is estimated that, in countries wherethedevelopmentdeficit ratesaffectmorethan20% oftheiradultpopulation,thenationaleconomymaysuffer a negativeimpact.3 Among the negativeconsequences of
shortstaturein women arelosses inreproductive health, survival, and stunting of their children.4,5 For men, low
economicproductivityhasbeenidentifiedasaresultofshort stature,originatedinchildhood.4
Child growth and development are multifactorial constructs,3,6 associated with environmental,
socioecono-mic,andbiologicalaspects.Studieshaveeitherinvestigated riskfactorsrelatedtochilddevelopmentaldelay3,7,8orthe
risk factors associated withmalnutrition.6 It is observed,
however, that these constructs are associated and have many determinants in common. Factors associated with poverty, suchasrestrictionsin diet,consumergoods, and services;insufficientpsychosocialstimuli;andadverse peri-natalconditionshavebeenreportedasriskfactorsforboth childgrowthanddevelopment.3,5---7,9---11
Thus, the aim of this study was to investigate the environmental, socioeconomic, and biological risk fac-tors associated with and growth and child development, regardingeconomicallyunderprivilegedchildrenin atown inValedoJequitinhonha,aregionwithlowsocioeconomic indicatorslocatedinsoutheasternBrazil.1
Methods
This was a cross-sectional, predictive correlation study, approvedbytheResearchEthicsCommitteeofUniversidade FederaldeMinasGerais(585/2010).
Thestudyconsistedofchildrenaged24---36monthswith normal development, i.e., no congenital or acquired dis-abilities.Additionally,theyhadtobeattending,foratleast six months, the municipalearly childhoodeducation net-workinatownlocatedinValedoJequitinhonha,in2011.To ensurerepresentativeness,allteninstitutionslocatedinthe urbanregionwereincluded.Asthiswasasmallpopulation, itwasdecidedthatallchildrenwhometthecriteriawould beeligible.Atotalof96childrenwereconsideredeligible; however,afterexcludingsomeparticipantsduetothelack ofcooperationfromthechildandlackofparentalconsent, 92childrenwereenrolledinthestudy.
Thefollowingparameterswereusedtoevaluategrowth: weightforage,heightforage,weightforheight,andbody massindex(BMI)forage,consideringtheparameters recom-mendedbytheWorldHealthOrganization(WHO)ascritical
Z-scorevalues.12 AMarte® digitalscale(Marte, SP,Brazil), with a maximum capacity of 199.95kg, and precision of 50gwasusedtoassessweight.Heightwasmeasuredusing a portablestadiometer (Alturaexata®, MG,Brazil),with a precisionof1mm.Thetechniquesusedtoobtainall mea-surements followed standard proceduresaccording to the manualoftheFoodandNutritionSurveillanceSystem.13
ChilddevelopmentwasassessedaccordingtotheBayley ScaleofInfantandToddlerDevelopment(BayleyIII),14 the
gold standard, widelyusedin scientificresearchtoassess childdevelopment.15,16Itisbasedonthesumoftasks
per-formedbythechildgeneratinggrossscores,thenconverted tocompositeorbalancedscores.Forthepresentstudy,the followingscaleswereused:cognitive,compositescore,with meanandstandarddeviationof10(±15)points,and expres-sivelanguagescale,balancedscore,withmeanandstandard deviationof10(±3)points.
The qualityofearlychildhoodeducationwasevaluated by the Infant/Toddler Environment Rating Scale Revised (ITERS-R).17Thistoolconsistsofsevensubscales:Spaceand
Furnishings,PersonalCareRoutines,ListeningandTalking, Activities,Interactionbetweenstaffandchildren,Program Structure,ParentsandStaff.Thescoresoneachscaleand overall score range from 0 to 7, generating the follow-ingclassification:inadequate(1---2.99),minimum(3---4.99), good (5---6.99), and excellent (7).17 in Brazil, some
stud-iesusedITERS-R,andtheirresultsshowedevidenceoftool validityandaccuracy.18,19
The home environment quality was assessed using the Home Observation for Measurement of the Environment (HOME) inventory,20 which has six subscales: parental
responsivity,acceptanceofchild,organizationofthe envi-ronment, learning materials, parental involvement, and
varietyinexperience.Thetoolrecognizesasarisk environ-mentfor developmentascore ≤27in theoverall score.20
Accordingto Totsikaand Sylva,21 theHOME inventoryhas
beensuccessfullyusedinresearchbecauseitiseasytoapply andhascharacteristicsconsideredtobeappropriate.
The qualitative assessment of the neighborhood envi-ronmentwasperformedthroughaquestionnairedeveloped based on literature,22 containing questions where the
respondentexpressedhis/heropinionaboutthe accessibil-ityandqualityofservices,bothpublicandprivate,aswell associalrelationsbetweenneighbors.
Fortheeconomicclassificationofthechildren’sfamilies, the questionnaire of the Associac¸ão Brasileira de Empre-sasde Pesquisa(ABEP --- Brazilian Association ofResearch Companies)wasused.Thistooldefinessocioeconomic sta-tusaccordingtodurablegoods,thenumberofbathrooms, whetherthefamilyemployedahousemaid,andthe house-hold head’s level of education. The score is added and interpreted from the ordinal scale, ranging from class E to A1.23 The socio-demographic and the child’s pre- and
post-natalhealthprofileswereobtainedusinga semistruc-tured,self-prepared questionnaire, applied tothe child’s caregiver.
Prior to the research, some pilot studies were carried out in order topractice the application of tools, as well asto performthe reliability measures. A pilot study was conductedwith20preschoolchildrentopracticetheBayley IIIapplication.Thesamechildrenunderwenthomevisitsto practicefortheHOMEapplication.Thedataobtainedfrom thesechildrenwerenotusedinthefinalstudy.
Thereliabilityamongthefourexaminerswhoappliedthe BayleyIIIscaleandtheHOMEtoolwasassessedandthe intr-aclasscorrelation(ICC)resultsofthesubscalemeanswere 0.95and0.94,respectively.TheICCbetweenthetwo exam-inerswhoappliedtheITERS-Rwas0.83.Allanthropometric measurements were performed by the same nutritionist. Theintra-examinerreliability,measuredbytheICC,showed a mean of 0.99 for weightmeasurement of and 0.98 for heightmeasurement.
The anthropometric assessment and the application of Bayley III scale and ITERS-R inventorywere performed in thedaycare center,while theother tools wereappliedat thechildren’shomesbytwopreviouslytrainedexaminers.
Thedescriptiveandinferentialanalyseswereperformed usingSPSSforWindows(IBMCorp.Released2011.IBMSPSS StatisticsforWindows,Version20.0;NY,USA).Asignificance levelof0.05wasusedtoanalyzetheassociationbetween environmental and biological conditions and investigated phenomena,bothintheunivariatelinearregressionandthe multivariateanalyses.Theunivariateanalysesincludedthe independentvariableswithp-value≤0.20inSpearman’s cor-relationtestandshowednomulticollinearitywiththeother variables.
Results
Table1 Socioeconomiccharacterizationandbiologicalprofileofthe92participants.Diamantina,Brazil,2011.
Variables Categories n(92) %
Gender Male 53 57.6
Female 39 42.4
Paternallevelofschooling Illiterateordidnotfinish4thGrade 13 16.5
Finished4thGrade 31 39.2
FinishedElementarySchool 27 34.2
FinishedHighSchool 8 10.1
Maternallevelofschooling Illiterateordidnotfinish4thGrade 5 5.6
Finished4thGrade 31 34.4
FinishedElementarySchool 29 32.2
FinishedHighSchool 20 22.2
FinishedCollege/University 5 5.6
Socioeconomicclass C1 15 16.3
C2 33 35.9
D 39 42.4
E 5 5.4
Familytype Mononucleara 19 20.6
Nuclearb 39 42.4
Expandednuclearc 10 10.9
ExpandedmononuclearId 24 26.1
Maternalage 18---30 66 71.7
31---47 26 28.3
N.ofsiblings 0---2 67 72.8
≥3 25 27.2
N.ofpeopleinhousehold ≤5 53 58.2
≥6 38 41.8
Pregnancycomplications Yes 29 31.5
No 63 68.5
Prenatalconsultations <6 51 56.7
≥6 39 43.3
Gestationalage(inweeks) Preterme 6 6.5
Full-termf 86 93.5
Birthweight(kg) ≤2.5 3 3.3
>2.5 88 96.7
Birthlength <3rdpercentileg 9 10.2
>3rdpercentileg 79 89.8
Maternalbreastfeeding Yes 91 98.9
No 1 1.1
Exclusivebreastfeeding(months) <6 57 61.9
≥6 35 40.2
Chronicdiseases Yes 45 48.9
No 47 51.1
Infectiousdiseases Yes 48 53.3
No 43 46.7
Hospitaladmissions Yes 22 23.9
No 70 76.1
n,absolutenumber;%,percentage. aMononuclear:motherandchildren. b Nuclear:father,mother,andchildren.
c Expandednuclear:father,mother,children,andothers. d ExpandedmononuclearI:mother,children,andothers. e Full-term:≥37gestationalweeks.
f Preterm:≤36gestationalweeks.
gBasedonthegrowthcurveaccordingtotheWorldHealthOrganization.12
andthepercentageof biologicalparents whodidnot live withtheirchildren (46.7%).Mostchildrenwerebornafter over 37 weeks of gestation and pregnancy complications were infrequent, as well as birth weight <2.5kg.
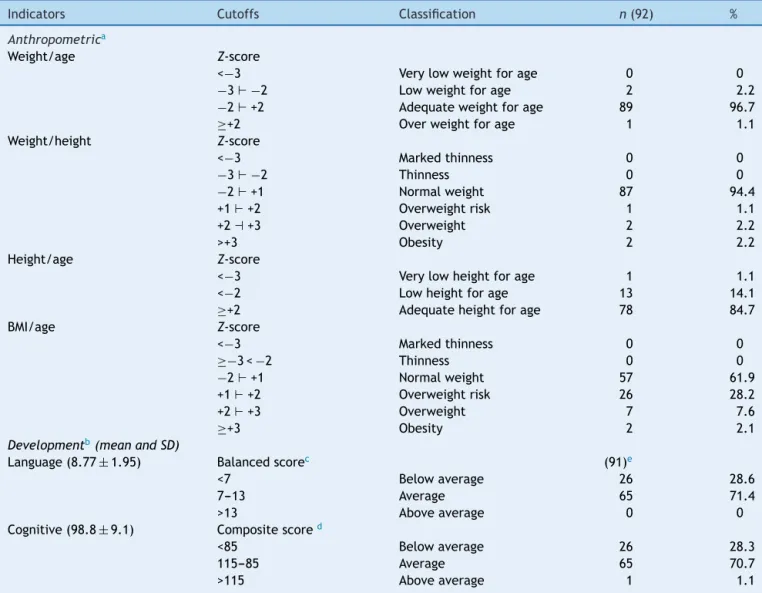
Table2 Resultsofthegrowthanddevelopmentassessment.Diamantina,Brazil,2011.
Indicators Cutoffs Classification n(92) %
Anthropometrica
Weight/age Z-score
<−3 Verylowweightforage 0 0
−3⊢−2 Lowweightforage 2 2.2
−2⊢+2 Adequateweightforage 89 96.7
≥+2 Overweightforage 1 1.1
Weight/height Z-score
<−3 Markedthinness 0 0
−3⊢−2 Thinness 0 0
−2⊢+1 Normalweight 87 94.4
+1⊢+2 Overweightrisk 1 1.1
+2⊣+3 Overweight 2 2.2
>+3 Obesity 2 2.2
Height/age Z-score
<−3 Verylowheightforage 1 1.1
<−2 Lowheightforage 13 14.1
≥+2 Adequateheightforage 78 84.7
BMI/age Z-score
<−3 Markedthinness 0 0
≥−3<−2 Thinness 0 0
−2⊢+1 Normalweight 57 61.9
+1⊢+2 Overweightrisk 26 28.2
+2⊢+3 Overweight 7 7.6
≥+3 Obesity 2 2.1
Developmentb(meanandSD)
Language(8.77±1.95) Balancedscorec (91)e
<7 Belowaverage 26 28.6
7---13 Average 65 71.4
>13 Aboveaverage 0 0
Cognitive(98.8±9.1) Compositescored
<85 Belowaverage 26 28.3
115---85 Average 65 70.7
>115 Aboveaverage 1 1.1
n,absolutenumber;%,percentage;SD,standarddeviation;BMI,bodymassindex;---|,including. a StandardreferenceoftheWorldHealthOrganization.12
b AccordingtoBayleyIIIscale.
c Balancedscore,expectedaverage,10±3points.
d Compositescore,expectedaverage,100±15points.
e OnechildrefusedtoparticipateintheBayleylanguagedomain.
ofthechildrenhadhadchronic(45%)and/orinfectious dis-eases(48%)inthelastthreemonthspriortodatacollection.
Table2showstheresultsforthegrowthanddevelopment constructs.Amongtheindicatorsofgrowth,heightforage showedthehighestpercentageofdeficit,andwasthus cho-senasthedependentvariableinthesubsequentinferential analyses. The percentage of children withbelow-average languageand cognitive developmentshowed a difference ofonly0.3%betweeneachother.Thus,bothwereusedfor theuni- and multilinear regressionanalyses asdependent variables,representativeofthedevelopmentconstruct.
Table3showstheresultsfortheassessedenvironmental factors:neighborhood,home,andpreschools.Inthe neigh-borhoodenvironment,intheinfrastructurecategory,street pavement and sanitation showed higher levels of inade-quacy. Amongtheofferedservices,thelowerscores were related to parks and playgrounds. Neighborhood security,
interactionandtrustbetweenneighbors,andsocialturmoil alsoshowednegativeresults.Athome,itwasobservedthat 69.6%ofthechildren’senvironmentwasconsideredatrisk, accordingtoHOME.Regardingthequalityofpreschools,the medianoverall score in ITERS-R(2.17) showed thatthese environmentswereinadequate.
Table3 Qualityofenvironments:neighborhood,home,andearlychildhoodeducation institutionsfor the92participants. Diamantina,Brazil,2011.
Variables n(92) % Scalereference
range(ordinal)
Minimum/Maximum Median
Neighborhood(infrastructure)a Basicsanitation
Yes 77 83.7 --- ---
---No 15 16.3 --- ---
---Electricity
Yes 91 98.9 --- ---
---No 1 1.1 --- ---
---Drinkingwater
Yes 90 97.8 --- ---
---No 2 2.2 --- ---
---Wastedisposal
Yes 82 89.1 --- ---
---No 10 10.9 --- ---
---Pavedstreet
Yes 71 77.2 --- ---
---No 21 22.8 --- ---
---Neighborhood(qualityofservices)a
Publicdaycarecenter --- --- 0---2 1---2 2
Familyhealthstrategy --- --- 0---2 0---2 2
Square/park --- --- 0---2 0---2 0
Playground --- --- 0---2 0---2 0
Grocerystoreorsmallstore --- --- 0---2 0---2 2
Pharmacy/drugstore --- --- 0---2 0---2 0
Overallscore --- --- 0---12 2---10 6
Neighborhooda
Institutionalactivities --- --- 0---12 0---11 6
Interactionandtrust --- --- 0---12 0---12 6
Interactionandretaliation --- --- 0---6 0---6 4
Childassistance --- --- 0---12 2---12 10
Qualityofneighborhood --- --- 0---16 3---14 9
Mobility --- --- 0---4 0---4 4
Security --- --- 0---5 0---5 2
Socialturmoil --- --- 0---4 0---4 2
Overallscore --- --- 0---113 37---81 58
Householdenvironment(HOME)
Responsivity --- --- 0---11 3---11 7.00
Acceptance --- --- 0---8 1---8 6.00
Organization --- --- 0---6 0---6 4.00
Learningmaterials --- --- 0---9 1---8 4.00
Parentalinvolvement --- --- 0---6 0---5 2.00
Varietyofexperiences --- --- 0---5 0---4 2.00
Overallscore --- --- 0---45 14---38 23.00b
Earlychildhoodeducationenvironment(ITERS-R)
Spaceandfurnishings --- --- 0---7 2.0---3.1 2.3c
Personalcareroutines --- --- 0---7 1.0---2.5 2.0c
Languageandreasoning --- --- 0---7 1.0---3.7 2.5c
Activities --- --- 0---7 1.12---2.88 1.94c
Interactionbetweenstaffandchildren --- --- 0---7 1.0---4.75 2.62c
Programstructure --- --- 0---7 1.0---4.34 2.16c
Interactionbetweenparentsandstaff --- --- 0---7 1.29---2.57 1.78c
Overallscore --- --- 0---7 1.34---3.23 2.17c
N,absolutenumber;%,percentage.
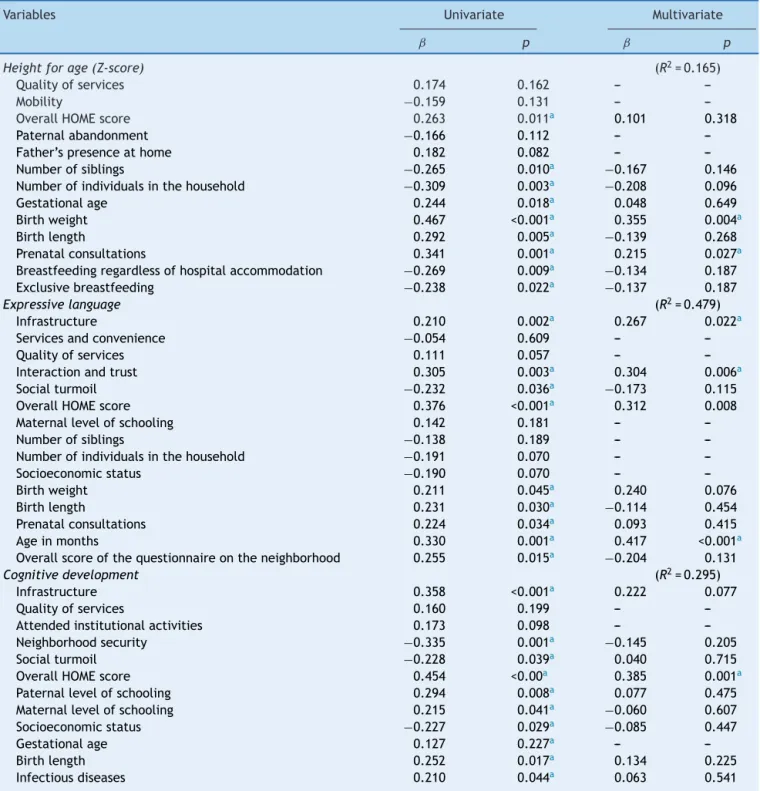
Table4 Univariateandmultivariatelinearregressionanalyses:heightforage,expressivelanguage,andcognitivedevelopment. Diamantina,Brazil,2011.
Variables Univariate Multivariate
ˇ p ˇ p
Heightforage(Z-score) (R2=0.165)
Qualityofservices 0.174 0.162 ---
---Mobility −0.159 0.131 ---
---OverallHOMEscore 0.263 0.011a 0.101 0.318
Paternalabandonment −0.166 0.112 ---
---Father’spresenceathome 0.182 0.082 ---
---Numberofsiblings −0.265 0.010a −0.167 0.146
Numberofindividualsinthehousehold −0.309 0.003a −0.208 0.096
Gestationalage 0.244 0.018a 0.048 0.649
Birthweight 0.467 <0.001a 0.355 0.004a
Birthlength 0.292 0.005a −0.139 0.268
Prenatalconsultations 0.341 0.001a 0.215 0.027a
Breastfeedingregardlessofhospitalaccommodation −0.269 0.009a −0.134 0.187
Exclusivebreastfeeding −0.238 0.022a −0.137 0.187
Expressivelanguage (R2=0.479)
Infrastructure 0.210 0.002a 0.267 0.022a
Servicesandconvenience −0.054 0.609 ---
---Qualityofservices 0.111 0.057 ---
---Interactionandtrust 0.305 0.003a 0.304 0.006a
Socialturmoil −0.232 0.036a −0.173 0.115
OverallHOMEscore 0.376 <0.001a 0.312 0.008
Maternallevelofschooling 0.142 0.181 ---
---Numberofsiblings −0.138 0.189 ---
---Numberofindividualsinthehousehold −0.191 0.070 ---
---Socioeconomicstatus −0.190 0.070 ---
---Birthweight 0.211 0.045a 0.240 0.076
Birthlength 0.231 0.030a −0.114 0.454
Prenatalconsultations 0.224 0.034a 0.093 0.415
Ageinmonths 0.330 0.001a 0.417 <0.001a
Overallscoreofthequestionnaireontheneighborhood 0.255 0.015a −0.204 0.131
Cognitivedevelopment (R2=0.295)
Infrastructure 0.358 <0.001a 0.222 0.077
Qualityofservices 0.160 0.199 ---
---Attendedinstitutionalactivities 0.173 0.098 ---
---Neighborhoodsecurity −0.335 0.001a −0.145 0.205
Socialturmoil −0.228 0.039a 0.040 0.715
OverallHOMEscore 0.454 <0.00a 0.385 0.001a
Paternallevelofschooling 0.294 0.008a 0.077 0.475
Maternallevelofschooling 0.215 0.041a −0.060 0.607
Socioeconomicstatus −0.227 0.029a −0.085 0.447
Gestationalage 0.127 0.227a ---
---Birthlength 0.252 0.017a 0.134 0.225
Infectiousdiseases 0.210 0.044a 0.063 0.541
ˇ,estimateoftheincreaseordecreaseofthedependentvariableforeachincreaseofoneunitoftheindependentvariable;p,statistical significance;R2,coefficientofdetermination.
a p≤0.05.
and interactionand trust (p=0.006)remained among the ‘‘neighborhood’’environmentvariables;theoverallscoreof theHOMEinventory(p=0.008)andthechild’sage(p<0.001) also remained as explanatory variables of language. This groupshoweda48%explanatorypower.
Discussion
It is indisputable that, in the past decades, several childhood-related indicators have improved, mainly those relatedtosurvival.2Inlight ofthisfact,itisnecessary to
ensurethat these children have the opportunity to reach their full potential for growth and development.3,7 Thus,
thepresentstudyaimedtoinvestigategrowthand develop-mentofunderprivilegedchildrenandtheirassociationwith environmental,socioeconomic,andbiologicalriskfactors.
Regardingtheeconomicprofile,itwasinagreementwith theBrazilianscenario,24whichhasshowninrecentdecades
a decrease in the number of individuals in class E. How-ever,theproportionofhouseholdsbelongingtoclassD(46%) demonstratestheconcentrationofthestudypopulationin economicallydisadvantagedclasses.Accordingtothe liter-ature, thisfact affectsnot only the capacitytopurchase consumer goods, but also parents’ emotional well-being, whichinturncaninterferewithadequatechildgrowthand development.3,7
Thehighermaternallevelofeducation,whencompared withthepaternal,isconsistentwithnationalstatisticsthat showahighermeanofyearsofstudyamongfemales(7.6%) whencomparedwithmales(7.3%).1However,itis
notewor-thy that only 27.8% of the mothers in this study finished high school. Maternal education has been identified as a determiningfactorforchildgrowth6,11anddevelopment.3,7
The family composition alsoshowed that 46.7% of the childrendidnotlivewiththeirbiologicalparents. Accord-ingtoPilzandShermann,25thelikelihoodofchildrenwhose
mothers are not supported by the fathers to have sus-pected developmental delay is seven times higher than thosechildrenwhosemothersareassistedbytheirchildren’s father.
Asforthematernalandchild’shealthhistory,itis note-worthythenumberofmotherswhohadhadfewerthansix prenatalconsultations.Thepercentageof56.7%wasfound tobemuchhigherthanthe11.8%recordedinthesoutheast regionin2006.1Prenatalcareisreportedasoneofthe
deter-minantsofadequatechildgrowth.6,11Although98.9%ofthe
childrenwerebreastfed,therateofexclusivebreastfeeding uptosixmonthsoflifewas2.9%,belowtheaverageforthe setofBraziliancapitalcities.21 Studies haveshownbotha
protectiveeffectofbreastfeedingongrowthand develop-mentwhenitoccurs,7aswellastheriskwhenitdoesnot.6
Thefactthatalmosthalfofchildrenhadarecordofchronic andinfectiousdiseasesisofconcern,giventheassociation demonstratedbyotherauthorsbetweendiseasesandgrowth anddevelopmentdeficits.3,6
Similarly to other studies,10,11,26 the height-for-age
indicatorwasshowntobethemostprevalentand represen-tativeindexofmalnutrition.Theproportionof15.2%oflow heightforageinthispopulationishigherthanthatfoundin theSoutheastregionofthecountry(5.6%)intheyear2006,26
butitisclosetothatobservedinotherstudiesinareas rec-ognizedfortheirlowHumanDevelopmentIndex(HDI),such asthenorthernregionofthecountry,whichrecorded14.7% of stunting in 2006,26 and the Brazilian semi-arid region,
withprevalenceratesof13%and10.9%11in2007and2008,
respectively.Theseresultsreflecttheinequalityamongthe regionsofBrazil,asshownbybothhealthindicatorsandthe HDI.
Asforthequalityoftheassessedhouseholds,overhalfof themwereconsideredtorepresentariskforchild develop-ment.TheseresultscorroborateotherBrazilianstudiesthat usedHOMEinthecontextofunderprivilegedfamilies.9,27
The quality of the assessed preschool environment rangedfrompoortominimallyadequate.Someauthors,6,28
whenassessingthequalityofpreschoolenvironmentthrough ITERS, found similarresults,identifyingseveral inadequa-cies such as insufficient training of professionals, poor infrastructure,fewadequatematerialsanddevices,lackof pedagogicalproject,andlackoffamilyparticipation.
Regarding the neighborhood environment, it was
observed that more than half of households were disad-vantaged, withthe followingsubscales showing the worst results:security,social turmoil,andinteractionandtrust. ForFariasandPinheiro,29changesinlifestyle,mediatedby
increasingly moreprivateand individualizedsocialhabits, have hindered the establishment of more participative neighborhoodrelations.
As for the determinants of the growth and develop-ment construct,it appearsthatbiological factors,aswell associoeconomicandenvironmentalonesexerttheir influ-ence. However, environmental variables were associated withdevelopment, whereasbiological variables showed a greaterassociationwithgrowth.
Corroborating twoother studies, the variables number ofprenatalvisitsandbirthweightwereexplanatoryforthe height-for-age outcome. Correia et al.10 found an
associ-ation between this nutritional indexand the child’s birth weight,whereasRamosetal.11foundaninversecorrelation
betweenstuntingandthenumberofprenatalconsultations. Acloseassociationwasobservedbetweenthese explana-toryvariables,since,accordingtotheliterature,oneofthe most important determinants of birth weightis adequate prenatalcareassistance,whichcanonlybeachievedwith anadequatenumberofconsultations.6Evenifonly3.3%of
childrenwerebornweighinglessthan2.5kg,the multivari-atelinearregressionanalysisshowedthatforevery1kgof birthweight,therewasa0.355 increaseintheZ-scoreof theheight-for-ageindex,whichisinagreementwithother studies.
Thequalityofthehomeenvironmentwastheonly deter-minantthatexplainedthecognitivedevelopmentconstruct. Forlanguage,inadditiontothequalityofthisenvironment, theneighborhoodqualityandthechild’sagewerealso rel-evant.
Theriskscenarioforchilddevelopmentinthehousehold demonstratedbytheHOMEinventoryaimedathomeis sim-ilartothatfoundbyLamyFilhoetal.9andbySantosetal.27
Thelatterauthorsfoundthat,foreveryextraunitof domes-ticstimulation,therewasanimprovementofhalfapointin cognitiveperformanceforthechildrenintheirstudy.
The variables related to the neighborhood associated withexpressivelanguageperformancewereinfrastructure andinteractionandtrustbetweenneighbors.Regardingthe infrastructure,forMacintyresandEllaway,30thegreaterthe
individualandthesocialenvironmentforthehuman devel-opmentprocess.This process,during childhood,isalways mediated by other individuals, whether family members, healthcareandeducationprofessionals,orevenneighbors. Itis throughtheinteractionwiththe familyand itssocial networkthatthechildassimilatestheskillspreviously con-structedthroughouthumanhistory.26
The third and last variable associated with the ‘‘expressivelanguage’’outcomecorrespondstothechild’s age.Eveniftheusedmeasurementtoolassessesthechild accordingtohis/herage’sskills,thisvariablealsoappears tobeassociatedwithperformanceinthisdomaininother studies.8,31Theseresultscouldbeexplainedbyboth
biolog-icalandenvironmentalfactors.31
The model proposed in this study was based on the complexity and context of the growth and development constructs,whileconsideringenvironmental,biological,and socioeconomicvariables.Inthissense,thefamily socioeco-nomicstatusandqualityofeducationalinstitutions,which were not considered by the statistical analysis as predic-tors of the investigated outcomes, may be exerting their influenceindirectly.
Therefore,futurestudiesshouldinvestigatethetypeof influence(directorindirect),themediationandmoderation associations,andthemagnitudeofthehome,educational, and neighborhood environment impact, as well as socio-economic andbiological factorsin child developmentand growth.Onelimitationof thepresentstudywasthesmall variabilityregardingthequalityofeducationalinstitutions, whichmayhavecontributedtotheresults.
In conclusion, there was a high prevalence of height-for-agedeficit,whencomparedwiththenationalaverage, and below average results for cognitive development and expressive language among economically disadvan-taged children participating in this study. Environmental, socioeconomic,andbiologicalfactorsinfluenceboth devel-opmentandgrowth.
However,thebiologicalvariablesshowedagreater asso-ciation withgrowth andenvironmental variableswith the assessed development variables, i.e., the cognitive and expressivelanguagedomains.
Funding
CAPESandUFVJM.
Conflicts
of
interest
Theauthorsdeclarenoconflictsofinterest.
References
1.InstitutoBrasileiro de Geografia eEstatística(IBGE).Síntese deindicadoressociais:umaanálisedascondic¸õesde vidada populac¸ão brasileira. Rio de Janeiro: Instituto Brasileiro de GeografiaeEstatística;2009.
2.BarrosRP,BironL,CarvalhoM,FandinhoM,FrancoS,Mendonc¸a R,etal.Determinantesdodesenvolvimentonaprimeira infân-cia no Brasil. Texto para discussão N◦ 1478. Brasília: Ipea;
2010.
3.Grantham-McGregorS,CheungYB,CuetoS,GlewweP,Richter L, Strupp B, et al. Developmental potential in the first 5 yearsfor childrenindevelopingcountries.Lancet. 2007;369: 60---70.
4.Dewey KG,BegumK. Long-termconsequencesof stuntingin earlylife.MaternChildNutr.2011;7:5---18.
5.deSouzaMM,PedrazaDF,deMenezesTN.Nutritionalstatusof childrenattendedinday-care-centersandfood(in)securityof theirfamilies.CienSaudeColet.2012;17:3425---36.
6.OliveiraLP,BarretoML,AssisAM,Braga-JuniorAC,NunesMF, OliveiraNF,etal.Determinantsoflineargrowthretardationin Brazilianpreschoolchildren:amultilevelapproach.CadSaude Publica.2007;23:601---13.
7.WalkerSP, Wachs TD,Grantham-McGregor S,BlackMM, Nel-sonCA,HuffmanSL,etal.Inequalityinearlychildhood:risk and protective factors for earlychild development. Lancet. 2011;378:1325---38.
8.SilvaLK,LabancaL,MeloEM,Costa-GuariscoLP.Identification of languagedisorders in theschool setting. Rev CEFAC(São Paulo).2014;16:1972---9.
9.LamyFilhoF,MedeirosSM,LamyZC,MoreiraME.Home envi-ronmentand alterationsinthedevelopmentofchildrenina communityoftheoutskirtsofSãoLuís---MA.CienSaudeColet. 2011;16:4181---7.
10.Correia LL, SilvaAC,Campos JS,Andrade FM, MachadoMM, LindsayAC,etal.Prevalenceanddeterminantsofchildunder nutritionandstuntinginsemiaridregionofBrazil.RevSaude Publica.2014;48:19---28.
11.Ramos CV, Dumith SC, Prevalence César JA. factors associ-ated withstunting and excess weight in children aged 0---5 years from the Braziliansemi-arid region.J Pediatr (Rio J). 2015;91:175---82.
12.WorldHealthOrganization(WHO),MulticentreGrowth Refer-enceStudyGroup.WHOchildgrowthstandards: length/height-for-age, weight-for-age, weight-for-length,weight-for-height and body mass index-for-age: methods and development. Geneva:WHO;2006.
13.Brasil.MinistériodaSaúde.Vigilânciaalimentarenutricional --- SISVAN:orientac¸õesbásicas paraacoleta, processamento, análisededadoseinformac¸ãoemservic¸osdesaúde.Brasília: MinistériodaSaúde;2004.
14.Bayley N. Bayley scales ofinfant and toddler development: technicalmanual.3rded.SanAntonio:Pearson;2006. 15.EickmannSH,MalkesNF,LimaMC.Psychomotordevelopment
of preterm infants aged 6 to 12 months. Sao Paulo Med J. 2012;130:299---306.
16.GreeneMM,PatraK,NelsonMN,SilvestriJM.Evaluatingpreterm infantswiththeBayley-III:patternsandcorrelatesof develop-ment.ResDevDisabil.2012;33:1948---56.
17.HarmsT,CryerD,CliffordR.Infant/toddlerenvironmentrating scale--- revisededition(ITERS-R).FrankPorterGrahamChild DevelopmentCenter,UniversityofNorthCarolinaatChapelHill. ChapelHill:TeachersCollegePress;2003.
18.Oliveira MA, Furtado RA, Souza TN, Campos-de-Carvalho MI. Avaliac¸ão dos ambientes educacionais infantis. Paidéia. 2003;13:41---58.
19.SilveiraSM.Qualidadedoatendimentodecreches:análisede umaescaladeavaliac¸ão.RibeirãoPreto:UniversidadedeSão Paulo;2009.[dissertation].
20.CaldwellBM,BradleyRH.HOME:inventoryandadministration manual.3rded.LittleRock:UniversityofArkansasforMedical SciencesandUniversityofArkansasatLittleRock;2003. 21.Totsika V, Sylva K. The home observation for measurement
of the environment revisited. Child Adolesc Ment Health. 2004;9:25---35.
23.Associac¸ãoBrasileiradeEmpresasdePesquisa(ABEP).Critério de classificac¸ão econômica --- Brasil; 2011. Available from: http://www.abep.org/novo/Content.aspx?ContentID=835
[accessed21.05.13].
24.BarrosRP,CarvalhoM,FrancoS,Mendonc¸aRS.Textospara dis-cussãoIPEAn◦1460:Determinantesdaquedanadesigualdade
derendanoBrasil.Brasília:SecretariadeAssuntosEstratégicos daPresidênciadaRepública;2010.
25.PilzEM,SchermannLB.Environmentalandbiological determi-nantsofneuropsychomotordevelopmentinasampleofchildren inCanoas/RS.CiencSaudeColet.2007;12:181---90.
26.Brasil.Ministério daSaúde. PesquisaNacionalde Demografia eSaúdedaCrianc¸aedaMulher ---PNDS 2006:dimensõesdo processoreprodutivoedasaúdedacrianc¸a.Brasília:Ministério daSaúde---CentroBrasileirodeAnáliseePlanejamento;2009.
27.SantosRS,Araújo AP, PortoMA. Earlydiagnosis of abnormal developmentofpretermnewborns:assessmentinstruments.J Pediatr(RioJ).2008;84:289---99.
28.CamposMM,EspósitoYL,BheringE,GimenesN,AbuchaimB. Qualityofearlychildhoodeducation: astudyinsixBrazilian statecapitals.CadPesqui.2011;41:20---54.
29.Farias TM, Pinheiro JQ. Living the neighborhood: person---environment interfaces in the production of alive neighborhoods.PsicolEstud.2013;18:27---36.
30.MacintyreS, EllawayA, CumminsS. Placeeffectsonhealth: howcanweconceptualize,operationaliseandmeasurethem? SocSciMed.2002;55(1):125---39.