www.jped.com.br
ORIGINAL
ARTICLE
Equations
based
on
anthropometry
to
predict
body
fat
measured
by
absorptiometry
in
schoolchildren
and
adolescents
夽
Luis
Ortiz-Hernández
∗,
A.
Valeria
Vega
López,
Norma
Ramos-Ibá˜
nez,
L.
Joana
Cázares
Lara,
R.
Joab
Medina
Gómez,
Diana
Pérez-Salgado
UniversidadAutónomaMetropolitana(UAM),DepartamentodeSalud,MexicoCity,Mexico
Received17April2016;accepted24August2016
Availableonline26January2017
KEYWORDS Bodyfat; Children; Adolescents; Mexico; DualX-ray absorptiometry; Anthropometry
Abstract
Objective: Todevelopandvalidateequationstoestimatethepercentageofbodyfatofchildren andadolescentsfromMexicousinganthropometricmeasurements.
Methods: Across-sectionalstudywascarriedoutwith601childrenandadolescentsfrom Mex-icoaged5---19years.Theparticipantswererandomlydividedintothefollowingtwogroups:the developmentsample(n=398)andthevalidationsample(n=203).Thevalidityofpreviously pub-lishedequations(e.g.,Slaughter)wasalsoassessed.Thepercentageofbodyfatwasestimated bydual-energyX-rayabsorptiometry.Theanthropometricmeasurementsincludedheight, sit-ting height, weight, waist andarm circumferences, skinfolds (triceps, biceps, subscapular, supra-iliac,andcalf),andelbowandbitrochantericbreadth. Linearregressionmodelswere estimatedwiththepercentageofbodyfatasthedependentvariableandtheanthropometric measurementsastheindependentvariables.
Results: Equationswerecreatedbasedoncombinationsofsixtonineanthropometricvariables andhadcoefficientsofdetermination(r2)equaltoorhigherthan92.4%forboysand85.8%for
girls.Inthevalidationsample,thedevelopedequationshadhighr2values(≥85.6%inboysand ≥78.1%ingirls)inallagegroups,lowstandarderrors(SE≤ 3.05%inboysand≤3.52%ingirls), andtheinterceptswerenotdifferentfromtheorigin(p>0.050).Usingthepreviouslypublished equations,thecoefficientsofdeterminationwerelower,and/ortheinterceptsweredifferent fromtheorigin.
Conclusions: Theequationsdevelopedinthisstudy canbeusedtoassessthepercentageof bodyfatofMexicanschoolchildrenandadolescents,astheydemonstrategreatervalidityand lowererrorcomparedwithpreviouslypublishedequations.
©2017SociedadeBrasileiradePediatria.PublishedbyElsevierEditoraLtda.Thisisanopen accessarticleundertheCCBY-NC-NDlicense(http://creativecommons.org/licenses/by-nc-nd/ 4.0/).
夽 Pleasecitethisarticleas:Ortiz-HernándezL,VegaLópezAV,Ramos-Ibá˜nezN,CázaresLaraLJ,MedinaGómezRJ,Pérez-SalgadoD. Equationsbasedonanthropometrytopredictbodyfatmeasuredbyabsorptiometryinschoolchildrenandadolescents.JPediatr(RioJ). 2017;93:365---73.
∗Correspondingauthor.
E-mail:[email protected](L.Ortiz-Hernández).
http://dx.doi.org/10.1016/j.jped.2016.08.008
PALAVRAS-CHAVE Gorduracorporal; Crianc¸as;
Adolescentes; México;
Absorciometriade duplaenergiade raios-X;
Antropometria
Equac¸õescombasenaantropometriaparapreveragorduracorporalmedida porabsorciometriaemcrianc¸asemidadeescolareadolescentes
Resumo
Objetivo: Desenvolverevalidarequac¸õesparaestimaropercentualdegorduracorporal(%GC) decrianc¸aseadolescentesdoMéxicoutilizandomedidasantropométricas.
Métodos: Foirealizadoumestudotransversalcom601crianc¸aseadolescentesdoMéxicocom idadesentre5e19anos.Osparticipantesforamdivididosaleatoriamentenosseguintesdois grupos:aamostradedesenvolvimento(n=398)eaamostradevalidac¸ão(n=203).Avalidade dasequac¸õespublicadasanteriormente(porexemplo,Slaughter)tambémfoiavaliada.O%GC foiestimadoporabsorciometriadeduplaenergiaderaios-X(raio-Xdeduplaenergia(DXA)).As medidasantropométricasincluíramestatura,alturasentado,peso,circunferênciasdacintura edobrac¸o,dobrascutâneas(tríceps,bíceps,subescapular,suprailíacaepanturrilha)elarguras docotoveloebitrocantérica.Osmodelosderegressãolinearforamestimadoscomo%GCsendo avariáveldependenteeasmedidasantropométricascomoasvariáveisindependentes.
Resultados: Asequac¸õesforamcriadas combasenascombinac¸õesdeseus anovevariáveis antropométricaseapresentaramcoeficientesdedeterminac¸ão(r2)iguaisousuperioresa92,4%
parameninose85,8%parameninas.Naamostradevalidac¸ão,asequac¸õesdesenvolvidas apre-sentaramaltosvaloresder2(≥ 85,6%emmeninose≥ 78,1%emmeninas)emtodososgrupos,
baixoníveldeerrospadrão(EP≤3,05%emmeninose≤3,52%emmeninas)eosinterceptosnão foramdiferentesdaorigem(p>0,050).Utilizandoasequac¸õespublicadasanteriormente,os coeficientesdedeterminac¸ãoforammenorese/ouosinterceptosforamdiferentesdaorigem.
Conclusões: Asequac¸õesdesenvolvidasnesteestudopodemserutilizadasparaavaliaro%GC dascrianc¸asemidadeescolareadolescentesmexicanos,poiselaspossuemumamaiorvalidade emenorerroemcomparac¸ãoàsequac¸õespublicadasanteriormente.
©2017SociedadeBrasileiradePediatria.PublicadoporElsevierEditoraLtda.Este ´eumartigo OpenAccesssobumalicenc¸aCCBY-NC-ND(http://creativecommons.org/licenses/by-nc-nd/4. 0/).
Introduction
Overweightandobesity areimportantpublichealth prob-lems because of their magnitude and impact on health. In 2012, prevalence of overweight and obesity in Mexi-can schoolchildren 5---11 years old was 34.4% (19.8% and 14.6%, respectively) and,in adolescents 12---19 years old, it was 34.9%.1 In schoolchildren, this value was slightly
higher(34.8%)in2006,whereasinadolescents,itwaslower (33.2%).
Childrenwithobesitytend tobecomeadultswith obe-sity, which increases their risk for the development of chronic diseases.2 Obesity represents an economic
prob-lembecausethetreatmentofitsco-morbiditiescarrieshigh costs.3Hence,itisnecessarythatobesityisaccurately
diag-nosed.
Differentmethods forassessingbodyfat include hydro-densitometry,dualenergyX-rayabsorptiometry(DXA),and deuterium dilution. These measures are used mainly in researchsettingsbecausetherequiredequipmentiscostly andmustbeoperatedbyspecializedtechnicians.Forthese reasons,thesemethodsareunsuitableforpopulation stud-ies, clinical practice, and screening activities. On the contrary,anthropometricmeasurements---althoughindirect indicatorsofadiposity---areeconomical,non-intrusive,and highlyreproducible.4
Various equations based on anthropometry have been used to estimate body fat in children, and these meth-ods have been developed in Euro- and Afro-descendent
subjects. Slaughter equations5 are the most frequently
used in the evaluation of body composition in children and adolescents.6---9 These equations were developed in
310Afro-AmericanandEuro-Americanpeoplefrom8to29 years of age.5 However, these equations tend to
overes-timate body fat.8,9 In recent years, Dezenberg equations
have been used,7 which were developed in a sample of
202 Afro- and Euro-American children aged 4---10 years of age. In Latinochildren fromthe USA, theseequations inaccurately estimate bodyfat.10 These results show that
equations developed in an ethnic group can be used in other populations, but the obtained estimation could be inaccurate. In the case of the Latino population, it has been recognized thatthe present-dayMexican population isan admixtureamongAmerindian,European,andAfrican ancestries.11
FewstudiesinLatinAmericahaveexploredthevalidity of prediction equations to estimate body fat in children usinganthropometricmeasurements.12,13 Itispossiblethat
equationsdevelopedinpopulationsofEuropeanorAfrican ancestrycouldnotbeappliedtotheLatinAmerican popu-lationduetoethnicdifferencesinamountanddistribution of body fat. For example, in comparison with European-or African-descendedchildren, thosewithLatinoancestry have higher waist circumference.14 In addition, pediatric
LatinAmericanpopulationshaveahighweightinrelationto theirheight(anindirectindicatorofadiposity),whichisnot alwaysisduetoexcessbodyfat.15,16Otherreasonsforhigh
with the reference population, Latino populations have lower heights15,16 but higher values of muscle mass,16
fat-freemasshydration,17trunklength,15 bodyframe(i.e.,
bone thickness),15 andthoraxcircumference.18 Therefore,
theobjectivesofthisstudywere(1)toevaluatethevalidity ofpreviouslypublishedequationstoestimate%BFinLatino children,and(2)todevelopandvalidatenewequationsin Latinochildren to predict bodyfat using DXAasthe gold standard.
Methods
Across-sectionalstudywascarriedoutwithaconvenience sampleof schoolchildrenandadolescentsaged5---19years fromMexicoCity.Theparticipantswererecruitedfrom ele-mentary(n=7),juniorhigh(n=8),andhighschools(n=4)in MexicoCityandacommunitycenterintheStateofMexico. The researchteampresented the projecttothe principal ofeachschool,andallstudentswereinvitedtoparticipate. Additionally, childrenof employeesfromthe Metropolitan AutonomousUniversity atXochimilco(UAM-X)participated inthestudy.Childrenwithaplastercastormotor disabili-tieswereexcludedfromthestudy.Thestudywasapproved bytheDivisionofBiologicalandHealthSciencesfrom UAM-X. The participants and their parents or guardians were informedabouttheresearchprocedures,andthelatter pro-videdinformedconsent.
Following the procedures used in other studies,7,10,19
the total sample (n=601) was randomly divided into two groups.Datafromtwo-thirdsoftheparticipantswereused todevelopequations(n=398),anddatafromtheremaining one-third of the children were used to validate new and previouslypublishedequations(n=203).TheSPSSsoftware package(IBMCorp.2010.IBMSPSSStatisticsforWindows, version20.0.NY,USA)wasusedtogeneratethesesamples (option‘‘Randomsampleofcases’’inthecommand‘‘Select cases’’).
Mostanthropometricmeasurementswereperformed fol-lowing thetechniques described byLohman etal.20 Waist
circumference was measured according to the technique describedbyFernándezetal.14Observerswerestandardized
following the Habicht protocol.21 Participants were
mea-sured with light clothes and without shoes. Stature was measuredwithaportablestadiometer,model214(SECA®, SP,Brazil)andbodyweightwithadigitalscale,model813 (SECA®, SP, Brazil). Waist and arm circumferences were obtainedwithametallictape(Lufkin®,MD,USA).Skinfolds (triceps, bicipital, subscapular, suprailiac, and calf) were measured with a compass (Harpenden®, Mediflex Produ-tosCirúrgicos,NY,USA).Eachskinfoldwasmeasuredthree times,andtheaveragevaluewasanalyzed.Bitrochanteric breadthandsittingstatureweremeasuredwithan anthro-pometer (Harpenden®, Mediflex Produtos Cirúrgicos, NY, USA).Elbowbreadthwasmeasuredwithananthropometer (Futrex®,MD,USA).
Bodymassindex(BMI:bodyweight/height2)was
calcu-latedasa Z-scorefor ageand sexusingthe WorldHealth Organizationreference.22Maturitywasestimatedusingthe
equationsofMirwaldetal.23
The percentage of body fat (%BF)was evaluated with DXA using equipment Model Discovery Wi (Hologic®, MA,
USA)Calibration, scanning,andimage analysiswere com-pleted following the manufacturer procedures and those described bythe International Society for Clinical Densit-ometry(ISCD).24Theimageswereanalyzedusingthewhole
bodyoption for Hispanic populations,model APEXversion 3.3.0.1(Hologic®, MA, USA). The coefficients of variation for the technicianwere 1.27% for total body fat (TBF) in kilograms,0.66% for leanbody mass,and 1.04%for %TBF, whichareacceptableaccordingtotheISCD.24
The distribution of anthropometric variables was assessedusingtheKolmogorov---Smirnovtest(Table1).When thevariablehadabiaseddistribution,it wastransformed usingthebase-10logarithmtoachieveaclosersymmetric distribution.Linearregressionmodelswereestimatedusing DXAderived%BFasadependentvariableand anthropomet-ricmeasurementasindependentvariables.Separatemodels wereestimatedforeachsex.Theequationsweredeveloped usingthefollowingtwoprocedures:
(a) Differentcombinationsof independentvariableswere manually tested. First, the capacity of each anthro-pometric variable to estimate %BF was evaluated (Supplementary Table S1). In addition, scatter plots were graphedto verifythe linear relationship among thevariables.Acurvilinearrelationshipof%BFwithage wasevidentinboys;meanwhile,amonggirls,this rela-tionshipwaslinear.Forthisreason,inmodelsforboys, thequadratic termof age wasincorporated. Because age and maturity are related, separate models with eachvariablewereestimated,andnodifferenceswere observed. For simplicity, only models with age were reported. The coefficient of determination (r2) and
standarderror(SE)wereusedascriteriatoidentifythe variablesthatbetterpredicted%BF.Avariablewas con-sidered an adequate predictor when the p-value was <0.050.
(b) Theautomaticbackwardandforwardproceduresofthe linearregressioncommandofSPSSsoftwarewereused (Table 2). In the backward option, all variables were introducedinthemodels,andthenthosethathadalow partial correlation withthe dependent variable were excluded (elimination criteria: p>0.100). In the for-wardoption,thevariableswereintroducedone-by-one according to greater correlation with the dependent variable. These variables were introduced and kept ifthey significantly predicted thedependent variable (p<0.050).
Theassessmentofthevalidityofthepreviouslypublished equationswascarriedoutusingage-matchedsubjectsfrom thepopulationthatwasusedtodevelopthem(e.g.,forthe Slaughterequations,25 participantsdatafrom8to18years
oldwereusedandfortheDeurenbergequations26therange
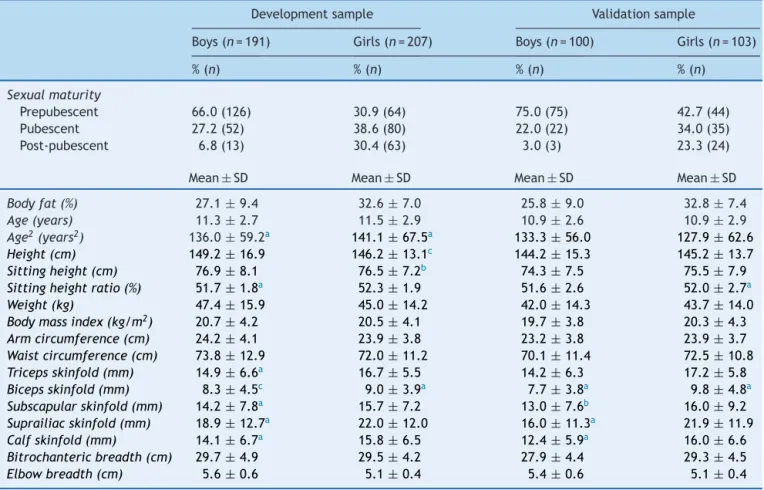
Table1 DescriptivestatisticsoftheanthropometricmeasuresinthedevelopmentandvalidationsamplesofMexicanchildren andadolescents.
Developmentsample Validationsample
Boys(n=191) Girls(n=207) Boys(n=100) Girls(n=103) %(n) %(n) %(n) %(n)
Sexualmaturity
Prepubescent 66.0(126) 30.9(64) 75.0(75) 42.7(44) Pubescent 27.2(52) 38.6(80) 22.0(22) 34.0(35) Post-pubescent 6.8(13) 30.4(63) 3.0(3) 23.3(24)
Mean± SD Mean± SD Mean± SD Mean± SD
Bodyfat(%) 27.1± 9.4 32.6± 7.0 25.8± 9.0 32.8± 7.4
Age(years) 11.3±2.7 11.5±2.9 10.9±2.6 10.9±2.9
Age2(years2) 136.0± 59.2a 141.1± 67.5a 133.3± 56.0 127.9± 62.6
Height(cm) 149.2±16.9 146.2±13.1c 144.2±15.3 145.2±13.7
Sittingheight(cm) 76.9±8.1 76.5±7.2b 74.3±7.5 75.5±7.9
Sittingheightratio(%) 51.7± 1.8a 52.3± 1.9 51.6± 2.6 52.0± 2.7a
Weight(kg) 47.4±15.9 45.0±14.2 42.0±14.3 43.7±14.0
Bodymassindex(kg/m2) 20.7± 4.2 20.5± 4.1 19.7± 3.8 20.3± 4.3
Armcircumference(cm) 24.2±4.1 23.9±3.8 23.2±3.8 23.9±3.7
Waistcircumference(cm) 73.8± 12.9 72.0± 11.2 70.1± 11.4 72.5± 10.8
Tricepsskinfold(mm) 14.9±6.6a 16.7±5.5 14.2±6.3 17.2±5.8
Bicepsskinfold(mm) 8.3± 4.5c 9.0± 3.9a 7.7± 3.8a 9.8± 4.8a
Subscapularskinfold(mm) 14.2± 7.8a 15.7± 7.2 13.0± 7.6b 16.0± 9.2
Suprailiacskinfold(mm) 18.9±12.7a 22.0±12.0 16.0±11.3a 21.9±11.9
Calfskinfold(mm) 14.1± 6.7a 15.8± 6.5 12.4± 5.9a 16.0± 6.6
Bitrochantericbreadth(cm) 29.7±4.9 29.5±4.2 27.9±4.4 29.3±4.5
Elbowbreadth(cm) 5.6± 0.6 5.1± 0.4 5.4± 0.6 5.1± 0.4
SignificancebytheKolmogorov---Smirnovtest. ap≤0.050.
b p≤0.010. c p≤0.001.
Table2 Multiplelinearregressionmodelshaving%BFbyDXAasoutcomeandanthropometriccharacteristicsaspredictorsin thedevelopmentsampleofMexicanchildrenandadolescents.
Equations Multiplelinearregressionmodels r2(%) SE(%)
Forboys
1 −8.739− 0.384c(height,cm)+35.371a(logweight,kg)− 0.892b(BMI,kg/m2)− 0.299a
(armcircumference,cm)+0.258c(waistcircumference,cm)+17.732c(logtriceps
skinfold)+6.698b(logsubscapularskinfold)+3.545d(logsuprailiacskinfold)+4.019d
(logcalfskinfold)
93.4 2.5
2 1.511− 0.152c(height,cm)− 0.431c(armcircumference,cm)+0.213c(waist
circumference,cm)+21.271c(logtricepsskinfold)+7.386b(logsubscapular
skinfold)+4.981b(logsuprailiacskinfold)
92.7 2.56
3 −1.791+0.329(age,years)−0.033a(age2,years2)−0.141c(height,cm)+0.162c(waist
circumference,cm)+18.516c(logtricepsskinfold)+6.013a(logsubscapular
skinfold)+5.633b(logsuprailiacskinfold)
92.4 2.61
Forgirls
1 −7.299−21.436b(logsittingheight)+17.739b(logBMI)+20.143a(logwaist
circumference)+7.813c(logtricepsskinfold)+6.379b(logsubscapularskinfold)+6.051b
(logcalfskinfold)−16.364a(logelbowbreadth)
85.8 2.65
%BFbyDXA,percentageofbodyfatestimatedbydual-energyX-rayabsorptiometry;BMI,bodymassindex;SE,standarderror.
p-Valuesofregressioncoefficientswere: ap<0.050.
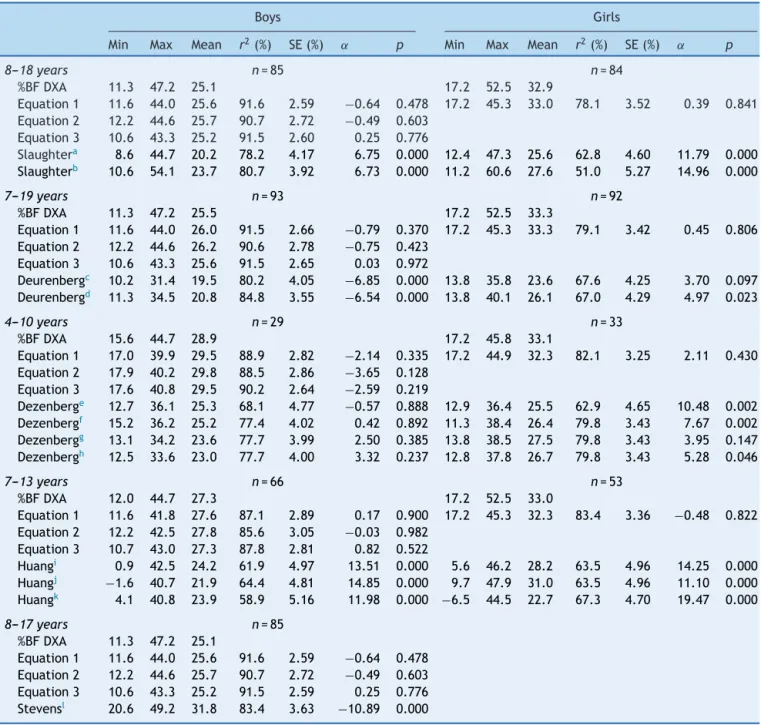
Table3 Cross-validationofnewandpreviouslypublishedpredictionequationsinvalidationsampleofMexicanchildrenand adolescents.
Boys Girls
Min Max Mean r2(%) SE(%) ˛ p Min Max Mean r2(%) SE(%) ˛ p
8---18years n=85 n=84
%BFDXA 11.3 47.2 25.1 17.2 52.5 32.9
Equation1 11.6 44.0 25.6 91.6 2.59 −0.64 0.478 17.2 45.3 33.0 78.1 3.52 0.39 0.841 Equation2 12.2 44.6 25.7 90.7 2.72 −0.49 0.603
Equation3 10.6 43.3 25.2 91.5 2.60 0.25 0.776
Slaughtera 8.6 44.7 20.2 78.2 4.17 6.75 0.000 12.4 47.3 25.6 62.8 4.60 11.79 0.000
Slaughterb 10.6 54.1 23.7 80.7 3.92 6.73 0.000 11.2 60.6 27.6 51.0 5.27 14.96 0.000
7---19years n=93 n=92
%BFDXA 11.3 47.2 25.5 17.2 52.5 33.3
Equation1 11.6 44.0 26.0 91.5 2.66 −0.79 0.370 17.2 45.3 33.3 79.1 3.42 0.45 0.806
Equation2 12.2 44.6 26.2 90.6 2.78 −0.75 0.423
Equation3 10.6 43.3 25.6 91.5 2.65 0.03 0.972
Deurenbergc 10.2 31.4 19.5 80.2 4.05 −6.85 0.000 13.8 35.8 23.6 67.6 4.25 3.70 0.097
Deurenbergd 11.3 34.5 20.8 84.8 3.55 −6.54 0.000 13.8 40.1 26.1 67.0 4.29 4.97 0.023
4---10years n=29 n=33
%BFDXA 15.6 44.7 28.9 17.2 45.8 33.1
Equation1 17.0 39.9 29.5 88.9 2.82 −2.14 0.335 17.2 44.9 32.3 82.1 3.25 2.11 0.430
Equation2 17.9 40.2 29.8 88.5 2.86 −3.65 0.128
Equation3 17.6 40.8 29.5 90.2 2.64 −2.59 0.219
Dezenberge 12.7 36.1 25.3 68.1 4.77 −0.57 0.888 12.9 36.4 25.5 62.9 4.65 10.48 0.002
Dezenbergf 15.2 36.2 25.2 77.4 4.02 0.42 0.892 11.3 38.4 26.4 79.8 3.43 7.67 0.002
Dezenbergg 13.1 34.2 23.6 77.7 3.99 2.50 0.385 13.8 38.5 27.5 79.8 3.43 3.95 0.147
Dezenbergh 12.5 33.6 23.0 77.7 4.00 3.32 0.237 12.8 37.8 26.7 79.8 3.43 5.28 0.046
7---13years n=66 n=53
%BFDXA 12.0 44.7 27.3 17.2 52.5 33.0
Equation1 11.6 41.8 27.6 87.1 2.89 0.17 0.900 17.2 45.3 32.3 83.4 3.36 −0.48 0.822
Equation2 12.2 42.5 27.8 85.6 3.05 −0.03 0.982
Equation3 10.7 43.0 27.3 87.8 2.81 0.82 0.522
Huangi 0.9 42.5 24.2 61.9 4.97 13.51 0.000 5.6 46.2 28.2 63.5 4.96 14.25 0.000
Huangj −1.6 40.7 21.9 64.4 4.81 14.85 0.000 9.7 47.9 31.0 63.5 4.96 11.10 0.000
Huangk 4.1 40.8 23.9 58.9 5.16 11.98 0.000 −6.5 44.5 22.7 67.3 4.70 19.47 0.000
8---17years n=85
%BFDXA 11.3 47.2 25.1
Equation1 11.6 44.0 25.6 91.6 2.59 −0.64 0.478
Equation2 12.2 44.6 25.7 90.7 2.72 −0.49 0.603
Equation3 10.6 43.3 25.2 91.5 2.59 0.25 0.776
Stevensl 20.6 49.2 31.8 83.4 3.63 −10.89 0.000
%BFDXA,percentageofbodyfatestimatedbydual-energyX-rayabsorptiometry;Min,minimum;Max,maximum;SE,standarderror;
r2,coefficientofdetermination;˛,intercept;T-SF,tricepsskinfold;B-SF,bicepsskinfold;SS-SF,subscapularskinfold;SI-SF,supra-iliac
skinfold;C-SF,calfskinfold.
Theestimationsweremadebasedon: a T-SFandC-SF.
b T-SFandSS-SF. c T-SFandB-SF.
d T-SF,B-SFSI-SF,andSS-SF. e Weight.
f WeightandT-SF. g Weight,T-SF,andgender.
h Weight,T-SF,gender,andethnicity. i Age.
j Ageandgender. k Age,gender,andheight.
Equation 1 for boys
Difference = 2080 – 0.060 average
p of β : 0.012
Difference = 2198 – 0.057 average
p of β : 0.013
Difference = 3564 – 0.106 average
p of β : 0.028 Difference = 1201 – 0.040 average
p of β : 0.144
Equation 2 for boys Equation 1 for girls Equation 3 for boys
7.50
10.00
5.00
0.00
–5.00
–10.00 5.00
2.50
0.00
–2.50
Diff
erence in %BF (predicted-measured)
Diff
erence in %BF (predicted-measured)
Diff
erence in %BF (predicted-measured)
–5.00
10.00
5.00
0.00
–5.00 Diff
erence in %BF (predicted-measured)
10.00
5.00
0.00
–5.00
–10.00
–15.00 10.00 20.00 30.00
Average %BF by DXA and equation 1 (boys)
40.00 50.00 10.00 20.00 30.00
Average %BF by DXA and equation 3
40.00 50.00
10.00 20.00 30.00
Average %BF by DXA and equation 2
40.00 50.00 10.00 20.00 30.00
Average %BF by DXA and equation 1 (girls)
40.00 50.00
A
C
B
D
Figure1 Bland---Altmangraphsforthedifferencein%BFmeasuredbyDXAandestimated%BFbynewpredictionequationsbased onanthropometryinthevalidationsampleofMexicanchildrenandadolescents.%BFbyDXA,percentageofbodyfatestimatedby dual-energyX-rayabsorptiometry.
over- or under-estimate %BF. Finally, the Bland Altman plots weregraphed(Fig. 1and SupplementaryFig. S1) to verify whether bias existed in the estimations according toadipositylevels.Differencesbetweenthemeasuredand estimated %BF were plotted against the average of mea-suredand estimated %BF. Onlyequations whose intercept wasnot different from the origin were plotted. The sta-tisticalanalyses wereperformed usingSPSSsoftware(IBM Corp.2010.IBMSPSSStatisticsforWindows,version20.0. NY,USA)
Statistical power analysis for different scenarios was completed using the G*Power software.27 For the
devel-opment of equations (Table 2) given a significance level (˛) of 0.050, a sample size of 207, an effect of 85.8% (r2), and seven predictors (scenario for the girls’
equa-tion),thestatisticalpowerwas1.00.Thesameresultwas obtainedwiththescenarioforthethreeequationsforboys. Forthe validation analysis (Table 3), the power obtained underthe different scenarios withrespect to the sample size(n from29to93), theeffect(r2 from51.0to91.6%)
andthenumberofpredictors(1---7)wasalwayssatisfactory (i.e.,≥0.80).
Results
Adescriptiveanalysisoftheanthropometricvariablesinthe development and validation samples is shown in Table 1. Themeanageofthedevelopmentsamplewas11.88years, which is higher than thatof the validation sample (11.32 years,p=0.019).Inboth samples,halfof theparticipants were girls (development sample: 52%, validation sample: 50.7%).Althoughmostparticipantswerepre-pubescent,the proportionwashigherinthevalidationsamplethaninthe developmentsample(58.6%vs.47.7%,p<0.050).
Foreachsexgroup,differentanthropometric character-isticswererelatedto%BF(SupplementaryTableS1).Inboys, thevariablesthatbetterpredicted%BFwereage,stature, BMI,circumferencesof arm andwaist, bitrochantericand elbowbreadth,sittingstature,weight,sittingstatureindex, and five skinfolds. Among girls, the best predictors were age,stature,weight,sittingstature,sittingstatureindex, BMI, circumference of arm and waist, five skinfolds, and bitrochantericandelbowbreadth.
option,thefollowingvariableswereincludedinthemodel (calledEquation(1)):stature,BMI,arm andwaist circum-ferences,bodyweight,andtriceps,subscapular,suprailiac, and calf skinfolds (r2=93%, SE=2.5%). With the forward
option, the model (called Equation (2)) included the fol-lowing variables: stature, arm and waist circumferences, andtriceps,subscapular,andsuprailiacskinfolds(r2=92%,
SE=2.5%). In boys, manual selection produced a model (Equation (3)) that included age, stature, waist circum-ference, andtriceps, subscapular,and suprailiacskinfolds (r2=92%, SE=2.0%). In girls, both of the automated
pro-cedures produced the samesolution (called Equation (1)) withthefollowingvariables:sittingstature,BMI,waist cir-cumference, triceps, elbowbreadth, and subscapularand calfskinfolds(r2=85%,SE=2.5%).Amonggirls,themanual
selectionmodeldidnotadequatelypredict%BF(r2≥80.0%).
Table3showsthedifferentestimationsof%BFobtained by equations in the validation sample. In all of the age groups, the newly developed equations in Mexican schoolchildren and adolescents had high coefficients of determination(r2≥85%in boysand≥78%in girls)andthe
lowestSE(≤3.05%inboysand≤3.52%ingirls);inaddition, their intercepts didnot differ fromthe origin (p>0.050). Although with the Dezenberg equations the intercept did notdifferfromtheorigin(p>0.050),theirpredictive capac-ity (r2≥77.7 in boys and <79.8 in girls) was lower than
that of the equations developed here (r2≥88 and 82%,
respectively).TheStevensequationsinboysexplaineda sig-nificantproportionofvariance(r2=85%),buttheintercept
differedfromtheorigin.Inbothsexes,theSlaughter equa-tionsoverestimated%BF(positiveintercept,p<0.050).The Deurenbergequationsunderestimated%BFinboys(negative intercept,p<0.050)andoverestimatedingirls.TheHuang equationsoverestimated%BFinbothsexes.
TheBland---Altmanplots(Fig.1A,BandD)revealedthat developedequationsthroughautomaticproceduresproduce biasedestimations of %BF.These equations overestimated values in children withlow adiposity,while in thosewith high adiposity,valueswereunderestimated. The equation developedbymanualselectioninboysyieldedestimations withoutsystematicbias(Fig.1C).
Discussion
Themainaimofthisstudywastodevelopequationsbased onanthropometricmeasurementstopredict%BFforMexican schoolchildrenandadolescents.Thefourdeveloped equa-tionsrequiremeasuresrelatedtoadiposity,lineargrowth, and body frame. For boys, three equations explained a highproportionofthe%BFvariance(r2≥92%).Althoughthe equation for girls explainedahigh proportion of variance (85%),thiswaslowerthanthatforboys.Anotheraimofthe study wastoanalyze thevalidity of previouslydeveloped equations. With the exception of Dezenberg’s equations, none of previously published equations were valid in the sampleofMexicanschoolchildrenandadolescents.
In itsoriginalpopulation,5the Slaughterequations had
acceptable predictive capacity (r2 from 75% to 78% in
thetotalsample).However,intheMexican schoolchildren and adolescents, these equations overestimated the %BF. The same trend was observed Indian children,9 Chinese
childrenwithobesity,8andBritishchildren.6TheDeurenberg
equations26weredevelopedin379Dutchchildrenand
ado-lescentsfrom7to20yearsofageandhadlowtomoderate predictivecapacity(r2=41%to69%inthetotalsample).In
theMexicanpediatricpopulation,theseequations underes-timated%BFinboysandoverestimateditingirls.However, theopposite effect occurred in Britishchildren.6 Physical
differences of Mexican children and adolescents in com-parison with those who participated in the Slaughter25
and Deurenberg26 studies could explain the results found
in the present study. Participants in the Slaughter25 and
Deurenberg26 samples were taller(155.2cmand 164.3cm
vs.144.2cm,respectively)andheavier(47.4kgand53.9kg
vs.42kg, respectively) than childrenin the Mexican sam-ple but had lower %BF (16.7% and 15.1% vs. 25.8%, respectively).
InMexican schoolchildrenandadolescents,the estima-tionsobtainedwiththeDezenberg equations didnottend to systematically over- or underestimate %BF (i.e., the interceptdidnotdifferfromtheorigin).However,the pre-dictivecapacityof the Dezenberg equations(r2=68.1% to
77.4%in boysand62.9% to79.8% in girls)waslowerthan thoseoftheequationsdevelopedinthisstudy(88.5%---90.2% and82.1%,respectively).Similarfindingswereobtainedin Cubanschoolchildren.28Nevertheless,inLatino10andIndian
schoolchildren,9 the Dezenberg equations underestimated
%BF;whereasinBritishschoolchildrenthesesequationshad abiasof13%intheestimationof%BFmeasuredbydeuterium dilution.29
The Huang equations10 were developed in 96 Latino
schoolchildrenfrom7to13yearsofagefromtheUSAand hadanacceptablepredictivecapacity(r2=86%---97%inthe
totalsample).IntheMexicansampletheseequations over-estimated %BF. Although participants of the Huang study wereLatino,theywereheavierthantheMexican schoolchil-dreninthecurrentsample.Thesedifferencescouldreflect thedifferentenvironmentswherechildrenfromtheUSAand Mexicolive.
The Stevens equations19 were developed with a
multi-ethnicsampleof5374subjects8---17yearsofageandhada predictivecapacityupto85%inboysusingDXAasthegold standard.Thisequationtendedtounderestimatethe%BFin Mexicanschoolchildrenandadolescents.
TheLatinAmericanpopulationhascertainphysical char-acteristics such aslower height, short lowerextremities, higherlevelsofbodyfatinthetrunkandabdominalregions, andlargerbodyframe.14---16 Forthisreason,inthepresent
study,body characteristics related tolinear growth (i.e., stature or sitting stature) and body frame (i.e., elbow or bitrochanteric breadth) were measured in addition to those related to adiposity (i.e., skinfolds and waist cir-cumference).Intheequationsdevelopedfor boys,stature hadanegativeregressioncoefficient;whereasingirls,the coefficientsforelbowbreadthandsittingstatureindexwere alsonegative.Thisshowsthatchildrenoradolescentswith higherstatureorlargerbodyframestendtohaveless adi-posity.In addition,in the newequation measurementsof abdominal and trunk fat were predictors of %BF, includ-ing waist circumference and subscapular and suprailiac skinfolds.
should be done with caution. Another limitation is that althoughDXAisconsideredanadequatemethodtomeasure adiposity,30itsvalidityinaMexicanpopulationhasnotbeen
established.Inthedevelopmentoftheequationsfor Mexi-canchildrenandadolescents,lesspredictivecapacitywas observedingirlsthanboys.Thisdifferencebysexhasbeen observedinothersamples.19,26Inthefuture,measurements
shouldbe identifiedthat increase the predictive capacity ofequations in girls. Amain limitation ofthis researchis thataconveniencesampleofchildrenandadolescentsfrom Mexico City was used, and, therefore, the sample had a specificethniccomposition.Inthisway,althoughthe devel-opedequationsprovideanimprovedestimationof%BFinthe sample understudy,their usein other populationsshould beextended withcaution.In other words, the validityof theseequationsshouldbeevaluatedinothersamplesof chil-drenfromotherregionsofMexicoandotherLatinAmerican countries.ThisisnecessarybecausetheLatinAmerican pop-ulationisdiverseintermsofethnicancestry.Forexample,in thesoutheastregionofMexico,thereisapredominanceof AmerindianancestryoverEuropean,whereasinthe North-ern region the opposite trend is observed.11 Finally, the
predictivecapacity of the estimated %BF(with the equa-tionspublishedhere)toidentifyclinicallyrelevantoutcomes (i.e.,cardiovascularrisk)shouldbedetermined.
In conclusion, the findings indicate that the equa-tions developed based on anthropometric measurements appropriatelypredict%BFinaheterogeneousgroupof Mex-icanschoolchildrenandadolescents.Incontrast,equations developed in other populations (even with similarethnic characteristics) have reduced predictive capacity to esti-mate%BF.Therefore,theequationsdevelopedinthisstudy canbeusedtoassessthe%BFinMexicanschoolchildrenand adolescents,astheydemonstrategreatervalidityandlower errorcomparedwiththepreviouslypublishedequations.
Conflicts
of
interest
Theauthorsdeclarenoconflictsofinterest.
Acknowledgements
The authors are grateful for the support of Magdalena Rodriguez-Magallanes --- from the Nutrition, Body Compo-sition, and Energy Expenditure Unit --- who standardized theobserverswhocarriedouttheanthropometric measure-ments.
Appendix
A.
Supplementary
data
Supplementary data associated with this article can be found, in the online version, at doi:10.1016/j.jped. 2016.08.008.
References
1.GutiérrezJP,Rivera-DommarcoJ,Shamah-LevyT, Villalpando-HernándezS,FrancoA,Cuevas-NasuL,etal.Encuestanacional desaludynutrición2012,Resultadosnacionales.Cuernavaca. México:InstitutoNacionaldeSaludPública;2012.
2.MustA,AndersonSE.Effectsofobesityonmorbidityinchildren andadolescents.NutrClinCare.2003;6:4---12.
3.Rtveladze K, Marsh T, Barquera S, Sanchez Romero LM, Levy D, Melendez G, et al. Obesity prevalence in Mexico: impacton health and economic burden. PublicHealth Nutr. 2014;17:233---9.
4.FrignaniRR,PassosMA,FerrariGL,NiskierSR,FisbergM,Cintra IdeP.Referencecurvesofthebodyfatindexinadolescentsand theirassociationwithanthropometricvariables.JPediatr(Rio J).2015;91:248---55.
5.SlaughterMH,LohmanTG,BoileauRA.Relationshipof anthro-pometricdimensionstoleanbodymassinchildren.AnnHum Biol.1978;5:469---82.
6.ReillyJJ,WilsonJ,DurninJV.Determinationofbody composi-tionfromskinfoldthickness:avalidationstudy.ArchDisChild. 1995;73:305---10.
7.DezenbergCV,NagyTR,GowerBA,JohnsonR,GoranMI. Pre-dictingbodycompositionfromanthropometryinpre-adolescent children.IntJObesRelatMetabDisord.1999;23:253---9. 8.ChanDF,LiAM,SoHK,YinJ,NelsonEA.Newskinfold-thickness
equationforpredictingpercentagebodyfatinChineseobese children.HKJPaediatr(NewSeries).2009;14:96---102. 9.KehoeSH,KrishnaveniGV,LubreeHG,WillsAK,GuntupalliAM,
VeenaSR,etal.Predictionofbody-fatpercentagefromskinfold andbio-impedancemeasurementsinIndianschoolchildren.Eur JClinNutr.2011;65:1263---70.
10.HuangTT,WatkinsMP,GoranMI.Predictingtotalbodyfatfrom anthropometryinLatinochildren.ObesRes.2003;11:1192---9. 11.Rubi-Castellanos R, Martínez-Cortés G, Mu˜noz-Valle JF,
González-MartínA, Cerda-FloresRM,Anaya-Palafox M,et al. Pre-hispanic mesoamerican demography approximates the present-dayancestry ofMestizos throughoutthe territoryof Mexico.AmJPhysAnthropol.2009;139:284---94.
12.UrrejolaP,HernándezI,IcazaG,VelandiaS,ReyesM,Hodgson I.Estimacióndemasagrasaenni˜noschilenos:ecuacionesde plieguessubcutáneosvsdensitometríadedoblefotón.RevChil Pediatr.2011;82:502---11.
13.ConliskEA, Haas JD, Martinez EJ, Flores R, Rivera JD, Mar-torellR.Predictingbodycompositionfromanthropometryand bioimpedance in marginally undernourished adolescents and youngadults.AmJClinNutr.1992;55:1051---60.
14.FernándezJR,ReddenDT,PietrobelliA,AllisonDB.Waist cir-cumferencepercentilesinnationallyrepresentativesamplesof African-American,European-American,andMexican-American childrenandadolescents.JPediatr.2004;145:439---44. 15.MartorellR, MendozaFS,Castillo RO, PawsonIG,Budge CC.
ShortandplumpphysiqueofMexican-Americanchildren.AmJ PhysAnthropol.1987;73:475---87.
16.Ortiz-HernándezL, López OlmedoNP, Genis GómezMT, Mel-chorLópezDP,ValdésFloresJ.Applicationofbodymassindex to schoolchildren of Mexico City. Ann Nutr Metab. 2008;53: 205---14.
17.BouttonTW, Trowbridge FL,Nelson MM, WillsCA,Smith EO, LopezdeRomanaG,etal.BodycompositionofPeruvian chil-dren with short stature and high weight-for-height, I.Total body-watermeasurementsandtheirpredictionfrom anthropo-metricvalues.AmJClinNutr.1987;45:513---25.
18.TrowbridgeFL,MarksJS,LopezdeRomanaG,MadridS,Boutton TW,KleinPD.BodycompositionofPeruvianchildrenwithshort statureandhighweight-for-height,II.Implicationsforthe inter-pretationfor weight-for-height asanindicator ofnutritional status.AmJClinNutr.1987;46:411---8.
19.StevensJ,CaiJ,TruesdaleKP,CuttlerL,RobinsonTN,Roberts AL.Percentbodyfatpredictionequationsfor8-to17-year-old Americanchildren.PediatrObes.2014;9:260---71.
21.Habicht JP. Standardization of quantitative epidemiological methodsinthefield.BolOficinaSanitPanam.1974;76:375---84. 22.deOnisM,OnyangoAW,BorghiE,SiyamA,NishidaC,Siekmann J.DevelopmentofaWHOgrowthreferenceforschool-aged chil-drenandadolescents.BullWorldHealthOrgan.2007;85:660---7. 23.MirwaldRL,Baxter-JonesAD,BaileyDA,BeunenGP.An assess-mentofmaturityfromanthropometricmeasurements.MedSci SportsExerc.2002;34:689---94.
24.HangartnerTN,WarnerS,BraillonP,JankowskiL,ShepherdJ. TheofficialpositionsoftheInternationalSocietyfor Clinical Densitometry:acquisition ofdual-energy X-ray absorptiome-trybodycompositionandconsiderationsregardinganalysisand repeatabilityofmeasures.JClinDensitom.2013;16:520---36. 25.SlaughterMH,LohmanTG,BoileauRA,HorswillCA,StillmanRJ,
VanLoanMD,etal.Skinfoldequationsforestimationofbody fatnessinchildrenandyouth.HumBiol.1988;60:709---23.
26.Deurenberg P, Pieters JJ, Hautvast JG. The assessment of thebodyfat percentagebyskinfoldthicknessmeasurements in childhood and young adolescence. Br J Nutr. 1990;63: 293---303.
27.FaulF,ErdfelderE,LangAG,BuchnerA.G*Power3:aflexible statisticalpoweranalysisprogramfor thesocial,behavioral, andbiomedicalsciences.BehavResMethods.2007;39:175---91. 28.Fernández-VieitezJA. Estimacióndelacomposición corporal pordosdelasecuacionesdeDezenbergparani˜nosde5a10 a˜nos.RevCubanaSaludPública.2003;29:37---41.
29.WellsJC. PredictingfatnessinUS vsUKchildren. IntJObes RelatMetabDisord.1999;23:1103.