ORIGIN
AL RESEAR
CH
Corresponding address: Natiele Camponogara Righi – Rua Felipe de Oliveira, n° 510, ap. 101, Bairro Centro – Santa Maria (RS), Brazil – Zip Code 97015-250 – E-mail: natirighi@gmail. com – Finance source: FAPERGS/MS/CNPq/SESRS n. 002/2013 – Conlict of interest: Nothing to declare – Presentation: Jan. 12, 2017 – Accepted for publication: Aug. 23, 2017 – Approved by the Ethics Committee of the Universidade Federal de Santa Maria, protocol no. 1,218,985.
Study conducted by the Department of Physical Therapy and Rehabilitation of the Universidade Federal de Santa Maria – Santa Maria (RS), Brazil.
1Physical therapist graduated from the Universidade Federal de Santa Maria (UFSM) – Santa Maria (RS), Brazil. 2Physical therapist graduated from the Universidade Federal de Santa Maria (UFSM) – Santa Maria (RS), Brazil.
3Master’s degree in Human Communication Disorders. Physical therapist from Hospital Universitário de Santa Maria (HUSM). Universidade Federal de Santa Maria (UFSM) – Santa Maria (RS), Brazil.
4PhD in health sciences from the Universidade de Brasília (UnB) – Brasília. Professor, Department of Physical Therapy and Rehabilitation at Universidade Federal de Santa Maria (UFSM) – Santa Maria (RS), Brazil.
ABSTRACT | Cerebral Palsy (CP) is characterized
as movement and posture disorders that cause performance limitations in activities easily performed by children with typical development (TD). Our study aimed to compare plantar pressure distribution and foot morphology between children with CP and TD, using an observational analytical research, of cross-sectional and comparative type, with 32 children between 6 and 11 years old, paired by gender and age, distributed in study group (SG) and control group (CG). We assessed the plantar distribution with the Footwork electronic baropodometry system and classiied foot type by the Chippaux-Smirak Index. The SG obtained greater values on anterior weight-bearing and lower on posterior weight-bearing (p=0.02). In addition, SG showed lower mean pressure values for right (p=0.00) and left feet (p=0.01), when compared with the CG. Most children showed the same type of foot bilaterally, with the prevalence of lat feet in SG and cavus feet in the CG. Children with spastic CP who presented preserved locomotor performance, or with some dysfunction, revealed antepulsion posture, smaller mean plantar pressures, and lat foot prevalence when compared with children with TD.
Keywords | Foot Deformities; Foot, Children, Cerebral Palsy, Evaluation.
321
RESUMO | A paralisia cerebral (PC) é caracterizada por desordens de movimento e postura, que causam limitações na execução de atividades facilmente desempenhadas por crianças com desenvolvimento típico (DT). Este estudo objetivou comparar a distribuição da pressão plantar e a morfologia do pé entre crianças com PC e DT, utilizando uma pesquisa analítica observacional transversal do tipo comparativa, com 32 crianças entre 6 e 11 anos, pareadas por sexo e idade e distribuídas em grupo estudo (GE) e grupo controle (GC). A distribuição plantar foi avaliada por meio do sistema de baropodometria eletrônica Footwork e o tipo de pé classiicado pelo índice de Chippaux-Smirak. O GE obteve maior descarga de peso no sentido anterior e menor no sentido posterior (p=0,02), além de menores valores das pressões médias dos pés direito (p=0,00) e esquerdo (p=0,01) em relação ao GC. A maioria das crianças apresentou o mesmo tipo de pé bilateralmente, com prevalência de pés planos no GE e cavos no GC. Crianças com PC espástica, que apresentaram o desempenho locomotor preservado ou com alguma disfunção, revelaram antepulsão corporal, menores pressões plantares médias e prevalência do pé plano, em comparação às crianças com DT.
Descritores | Deformidades do Pé; Pé; Criança; Paralisia Cerebral; Avaliação.
Plantar pressure distribution and foot morphology of
children with Cerebral Palsy and typical development
Distribuição da pressão plantar e morfologia do pé de crianças com paralisia cerebral e
crianças com desenvolvimento típico
Distribución de la presión plantar y morfología del pie de los niños con parálisis cerebral y
las niñas con el desarrollo típico
RESUMEN | El parálisis cerebral (PC) es caracterizado por desórdenes de movimiento y postura, que causan limitaciones en la ejecución de las actividades fácilmente desempeñadas por los niños con el desarrollo típico (DT). Este estudio tuvo el objetivo de comparar la distribución de la presión plantar y la morfología del pie entre los niños con el PC y el DT, utilizando una investigación analítica observacional transversal del tipo comparativa, con 32 niños entre seis y once años, pareadas por sexo y edad y distribuidas en el grupo estudio (GE) y el grupo control (GC). La distribución plantar fue evaluada por medio del sistema de baropodometría electrónica Footwork y el tipo de pie clasiicado por el índice de Chippaux-Smirak.
El GE obtuvo la descarga de peso más grande en el sentido anterior y menor en el sentido posterior (p=0,02), además de menores valores de las presiones medianas de los pies derecho (p=0,00) e izquierdo (p=0,01) en relación al GC. La gran parte de los niños presentó el mismo tipo de pie bilateralmente, con prevalencia de pies planos en el GE y cavos en el GC. Los niños con PC espástica, que presentaron el desempeño locomotor preservado o con alguna disfunción, revelaron antepulsión corporal, menores presiones plantares medianas y prevalencia del pie plano, en comparación a los niños con DT.
Palabras clave | Deformidades del Pie; Pie; Parálisis Cerebral; Evaluación.
INTRODUCTION
Cerebral Palsy (CP) is characterized as movement and posture disorders, consequential of non-progressive alictions in the developing encephalon, which causes performance limitations in activities easily performed
by children with typical development (TD)1, 2.
Abnormalities in muscle tone and, consequently, in posture, are common in children with CP, spasticity
being the most2 predominant. For this reason, the
primary change on CP is the motor impairment, which leads to postural adjustments, with alterations on body
biomechanics and possible bone deformities3.
he constant action of distinct forces on the plantar surface may compromise foot functionality, leading to changes in load distribution. hese changes interfere with the alignment of ankle and foot and can lead to
the emergence of plantar diseases and deformities3, 4.
his distribution analysis is relevant to the prevention
of postural disorders5, 6 and can be performed with
electronic baropodometry7, which gives an indication of
foot function and helps the investigation of abnormal patterns in static position and gait, thus contributing to
the disorders’ understanding4. Studies8-10 demonstrate
the efectiveness of this system to plantar pressure distribution evaluation, although the comparison of baropodometry and foot morphology between children
with CP and TD is still little explored10.
Consequent CP alterations can lead to diferences in those children’s plantar pressure distribution and foot type, when compared with TD. herefore, our study aimed to compare the plantar pressure distribution and
foot morphology between children with cerebral palsy and typical development.
METHODOLOGY
To achieve the goal proposed, an observational, cross-sectional, and analytical research, of comparative type, was used. he sample calculation, based on the
study by Nakaya et al. 11, was of 16 children with TD
in the control group (CG), and 16 children diagnosed with spastic CP in the study group (SG), chosen according to gender and age. We divulged the study in a university hospital and in public schools, in such a way that the sample happened for convenience. Inclusion criteria for SG were: children aged from 6 to 11 years, able to understand simple verbal instructions and with independent gait, classiied in level I, in which the children walk without limitations, or in level II, in which they present limitations to walk long distances or in balance, according to the Gross
Motor Function Classiication System (GMFCS)12.
As exclusion criteria, the children could not have performed orthopedic surgery in the lower limbs and/ or application of botulinum toxin in the last six months, and could not present diagnosed associated disorders (mental deiciency and sensory problems) that would make the evaluation unfeasible.
maximum pressure by a capacitor of 100N/cm² and a 16-bit analog converter. he capacitor measurements were 7.62x7.62mm, weight of 3kg and a thickness of 4mm/5mm, with rubber. Child’s shoe size, height, and weight, measured at the time of evaluation with a Líder brand scale, LD 1050, were used for calibration of the device.
he normality patterns considered were 57% to 60% of body weight for back foot, 40% to 43% for front
foot, 50% to right lower limb and 50% for the left13,
characterizing antepulsion or retropulsion postures and right or left body laterality when the values exceeded these limits.
Chippaux-Smirak Index (CSI) was used to classify foot morphology. For the calculation, two straight lines were drawn in the right and left plantar prints: one tangent to the medial points in the irst metatarsal head region and to the calcaneus, and another one tangent to the most lateral point of ifth metatarsal head to the calcaneus. In sequence, linking the most medial and the most lateral points in the metatarsal heads region, the greater width in the impression of the region was delimited (segment a). At the same time, the smallest foot width was marked in the longitudinal plantar arch or midfoot region (segment b). Both segments were measured (a and b), and we divided the latter by the former, obtaining a percentage. Five categories are described for medial longitudinal arch classiication according to this index: 0% – high arch foot (cavus); 0.1%-29.9% – morphologically normal arch foot; 30%-39.9% – intermediate foot (lat degree I); 40%-44.9% – low arch foot (lat degree II); 45% or higher – lat foot
(lat degree III)14. he morphology analysis of the 64
feet was held separately, the 32 SG feet and the 32 CG feet, since it can present itself bilaterally diferent, both in children with CP and with TD.
During the evaluation with the baropodometry system, the children were oriented to keep a standing position on the platform, adopting a spontaneous and comfortable posture, supported in both feet, barefoot, parallel feet, aligned heels, and loose arms along the body. Each child conducted the test three times, with eyes open and staring at a point marked one meter away, at the height of the children glabellar point, for 10 seconds. his time was established because children with CP have diiculties to remain in static posture for
a long time1. he mean results were used for the analysis.
As a beneit, the children obtained relevant information about their plantar pressure distribution and foot type. During the assessments, if necessary,
those responsible for the children were oriented to seek specialized treatment, being made available the images acquired through the equipment.
Data normality was veriied using the Shapiro-Wilk test, and the comparison between groups was performed with the Mann-Whitney U test and the Fisher exact test. he analyses were conducted using the Windows Statistical Package for the Social Sciences, version 17.0.
he study was approved by the Research Ethics Committee of the Universidade Federal de Santa Maria under Protocol No. 1,218,985, respecting the ethical precepts contained in CNS Resolution No. 466/2012, with reading, analysis and signature of the informed consent form by the responsible, and Term of Consent by the participant.
RESULTS
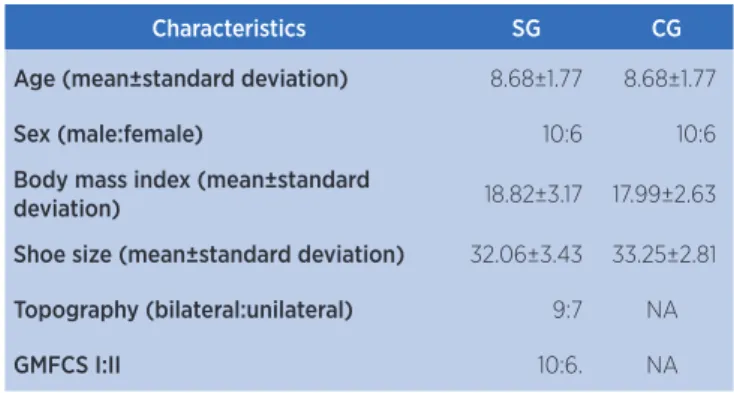
he sample was composed of 32 children, paired by sex and age, and the characterization of study and control groups are described in Table 1.
Table 1. Groups characteristics
Characteristics SG CG
Age (mean±standard deviation) 8.68±1.77 8.68±1.77
Sex (male:female) 10:6 10:6
Body mass index (mean±standard
deviation) 18.82±3.17 17.99±2.63
Shoe size (mean±standard deviation) 32.06±3.43 33.25±2.81
Topography (bilateral:unilateral) 9:7 NA
GMFCS I:II 10:6. NA
GMFCS, Gross Motor Function Classiication System; GE, Study Group; GC, control group; NA, non-applicable
he ages ranged from 6 to 11 years, no child used an insole or bracing, and all showed BMI within the normal range. Regarding the topography of children with CP, the bilateral (56.25%) predominated, and according to the GMFCS, there was a prevalence of children from level I (62.5%).
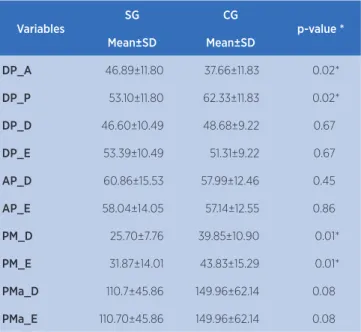
Table 2 presents the comparison of plantar pressure variables between the groups.
a statistical diference, with SG presenting lower pressures when compared with CG.
he morphology comparison of the 32 feet in SG and the 32 in CG is presented in Table 3.
Table 2. Comparison of plantar pressure distribution variables between the groups
Variables
SG CG
p-value *
Mean±SD Mean±SD
DP_A 46.89±11.80 37.66±11.83 0.02*
DP_P 53.10±11.80 62.33±11.83 0.02*
DP_D 46.60±10.49 48.68±9.22 0.67
DP_E 53.39±10.49 51.31±9.22 0.67
AP_D 60.86±15.53 57.99±12.46 0.45
AP_E 58.04±14.05 57.14±12.55 0.86
PM_D 25.70±7.76 39.85±10.90 0.01*
PM_E 31.87±14.01 43.83±15.29 0.01*
PMa_D 110.7±45.86 149.96±62.14 0.08
PMa_E 110.70±45.86 149.96±62.14 0.08
*Mann-Whitney U Test; DP_A, anterior plantar distribution; DP_P, posterior plantar distribution; DP_D, right plantar distribution; DP_E, left plantar distribution; AP_D, area of the right foot; AP_E, area of the left foot; PM_D, average pressure of the right foot; PM_E, average pressure of the left foot; PMa_D, maximum pressure on the right foot; PMa_E, maximum pressure on the left foot; SG, study group; CG, control group
Table 3. Foot morphology
Variables SG CG p-value *
R foot
Normal 2 6
0.12
Not normal 14 10
L foot
Normal 3 7
0.15
Not normal 13 9
*Fischer exact test, R foot – right foot, L foot – left foot; SG – study group; CG – control group
Of the 32 feet in SG, 5 were normal, as well as 13 of the 32 feet in CG. Besides, Table 4 presents the morphological changes of the 27 feet that were not considered normal in the SG and the 19 not-normal feet in CG.
Table 4. Foot morphological alterations
Variables SG CG p-value *
R foot
Cavus 5 6
0.40
Flat 9 4
L foot
Cavus 5 6
0.23
Flat 8 3
*Fischer exact test, R foot – right foot, L foot – left foot; SG – study group; CG – control group
Regarding foot morphology, no statistically signiicant diferences were found between the groups, the lat foot being prevalent in the SG and the cavus in the CG. In the SG, 12 children presented the same foot morphology bilaterally, 8 of which with lat feet, 3 with cavus feet, and 1 with normal feet. In the CG, the feet were symmetrical in 11 children, being 2 with lat feet, 5 with cavus feet, and 4 with normal feet.
DISCUSSION
When comparing the plantar pressure distribution and the foot morphology of children with Cerebral Palsy and typical development, our study identiied that children with CP present antepulsion posture. his
study is in concordance with Galli et al.10, in which
signiicantly increased plantar pressures were found on the front foot and midfoot in hemiplegic and diplegic children with CP, and decreased in the back foot.
Children with spastic CP present greater ankle joint stifness compared with children TD, in addition to shortening of medial gastrocnemius, which reduces
the movement response ability15. For this reason, the
adoption of a diferent biomechanical alignment, such as the antepulsion posture, and the use of hip strategy, which needs less efort than the ankle strategy used by children with TD, compensate for the abnormal capacity
of children with CP to stay in static position16-19. However,
such adaptations demand a considerable efort of posterior
antigravity muscles to avoid the fall20, which can lead to
an overload on the posterior muscular chain.
Besides these compensatory strategies, recent studies indicate that, although children with CP can produce anticipatory postural adjustment activities for movements, this activation is delayed, mainly in lower limb muscles, and their magnitude is smaller when
compared with children with TD21, 22.
During the baropodometric evaluation, the pressures of right and left foot are registered, which allows the determination of weight percentage supported by each
foot8. In both studied groups, the laterolateral weight
distribution showed values close to normality, a fact that may be associated with the foot symmetry presented by most children.
here was a prevalence of the lat foot among children with CP, in concordance with the results by
Galli et al.10 and Costa et al.1, in which all the studied
foot. Such a inding can be justiied by the increase of anterior weight-bearing presented by the children evaluated in this study. By adopting antepulsion posture and using hip strategy, which leads to knee lexion, these children are predisposed to increased contact area
in the medial foot region10,23.
Changes in foot morphology are known to be associated with diferences in the plantar pressure
distribution24. In our study, children with CP presented
smaller mean pressure in the foot, probably due to the lat foot, because the larger the contact area, the smaller the mean pressure on the foot, being better
distributed in all foot areas25. In the CG, otherwise,
most children presented cavus feet and, consequently, greater plantar pressure.
he formation of the longitudinal arch occurs around the irst 6 years of life because growth inluences ligament laxity, the musculature becomes more
competent and the plantar face fat decreases26. Tong and
Kong27 observed, from a longitudinal study, that from
7 to 9 years, the longitudinal arch remains unchanged after formation. hey concluded that in process of longitudinal arch formation, some factors, such as the type of footwear used, inluence the children’s foot type. hese factors, not evaluated in our study, might justify the cavus foot predominance in the CG.
Studies16,17,20 point out that hemiplegia, characterized
by motor impairment and unilateral spasticity in the contralateral upper and lower limb to the afected brain hemisphere, leads the child to use the normal half-body, hindering the weight transfer on the side afected. Diplegic children, on the other hand, with bilateral spasticity, predominant in the lower limbs, present greater diiculties in posture control mechanisms.
As study limitation, we highlight the inclusion on the SG of children with unilateral and bilateral CP, considering that the plantar pressure distribution tends to appear diferently in children with distinct CP topographies.
he results obtained in our study contribute to a better understanding of CP consequences and the adaptations these children need to perform to maintain the static position when compared with TD. From the clinical point of view, we point out the importance of foot type classiication in CP, performed in this study through the CSI due to the frequent presence of deformities, which lead to an abnormal distribution of plantar pressures. he measurement of this variables enables the choice
and modeling of corrective and protective devices for the prevention of postural disorders.
CONCLUSION
Children with CP, who feature preserved locomotor performance or with some dysfunction, revealed antepulsion posture, smaller mean plantar pressures, and lat foot prevalence when compared with children with TD.
REFERENCES
1. Costa TDA, Carvalho SMR, Braccialli LMP. Análise do equilíbrio estático e de deformidades nos pés de crianças com paralisia cerebral. Fisioter Pesqui. 2011;18(2):127-32. doi: 10.1590/S1809-29502011000200005.
2. Assumpção MS, Piucco EC, Corrêa ECR, Ries LGK. Coativação, espasticidade, desempenho motor e funcional na paralisia cerebral. Motriz Rev Educ Fis. 2011;17(4):650-59. doi: 10.1590/ S1980-65742011000400009.
3. Roque AH, Kanashiro MG, Kazon S, Grecco LAC, Salgado ASI, de Oliveira CS. Análise do equilíbrio estático em crianças com paralisia cerebral do tipo diparesia espástica com e sem o uso de órteses. Fisioter Mov. 2012;25(2):311-16. doi: 10.1590/ S0103-51502012000200008.
4. Fortaleza ACS, Martinelli AR, Nozabieli AJL, Mantovani AM, Camargo MR, Chagas EF, et al. Avaliação das pressões plantares em diferentes situações por baropodometria. Colloquium Vitae. 2011;3(1):6-10. doi: 10.5747/cv.2011.v03. n1.v040.
5. Zammit GV, Menz HB, Munteanu SH. Reliability of the TekScanMatScan(R) system for the measurement of plantar forces and pressures during barefoot level walking in healthy adults. J Foot Ankle Res. 2010;3:11. doi: 10.1186/1757-1146-3-11. 6. Rosário JLP. A review of the utilization of baropodometry in
postural assessment. J Body Work Mov Ther. 2014;18(2):215-19. doi: 10.1016/j.jbmt.2013.05.016.
7. Mesquita PR. Distribuição da pressão plantar durante o andar e o correr em crianças. [dissertação de mestrado]. [Brasília]: Universidade de Brasília; 2015.
8. Menezes LT, Barbosa PHFA, Costa AS, Mundim AC, Ramos GC, Paz CCSC, et al. Baropodometric technology used to analyze types of weight-bearing during hemiparetic upright position. Fisioter Mov. 2012;25(3):583-94. doi: 10.1590/ S0103-51502012000300014.
9. Valentini FA, Granger B, Hennebelle DS, Eythrib N, Robain G. Repeatability and variability of baropodometric and spatio-temporal gait parametres – results in healthy subjects and in stroke patients. Neurophysiol Clin. 2011;41(4):181-9. doi: 10.1016/j.neucli.2011.08.004.
while standing. Res Dev Disabil. 2015;41(42):52-7. doi: 10.1016/j.ridd.2015.05.006.
11. Nakaya L, Mazzitelli C, Sá CSC. Comparação do equilíbrio de crianças com paralisia cerebral e crianças com desenvolvimento motor normal. Rev Neurocienc. 2013;21(4):510-9. doi: 10.4181/RNC.2013.21.822.10p.
12. Silva DBR, Dias LB, Pfeifer LI. Coniabilidade do sistema de classiicação da função motora grossa ampliado e revisto (GMFCS E & R) entre estudantes e proissionais de saúde no Brasil. Fisioter Pesqui. 2016;23(2):142-7. DOI: 10.1590/1809-2950/14396823022016.
13. Cavanagh PR, Rodgers MM, Iiboshi A. Pressure distribution under symptom-free feet during barefoot standing. Foot Ankle. 1987;7(5):262-76. doi: 10.1177/107110078700700502. 14. Onodera NA, Sacco ICN, Morioka EH, Souza PS, Sá MR,
Amadio CA. What is the best method for child longitudinal plantar arch assessment and when does arch maturation occur? Foot (Edinb). 2008;18(3):142-9. doi: 10.1016/j. foot.2008.03.003.
15. Dias CP, Vaz MA, Goulart NBA, Onzi ES. Adaptações morfológicas musculares na espasticidade. Sci Med. 2013;23(2):102-7.
16. Domagalska ME, Szopa AJ, Lembert DT. A descriptive analysis of abnormal postural patterns in children with hemiplegic cerebral palsy. Med Sci Monit. 2011;17(2):CR110-6. doi: 10.12659/MSM.881396.
17. Domagalska-Szopa M, Szopa A. Postural pattern recognition in children with unilateral cerebral palsy. Ther Clin Risk Manag. 2014;10:113-20. doi: 10.2147/TCRM.S58186.
18. Lopes GHR, David AC. Posturography in the analysis of postural control in children with cerebral palsy: a literature review. Fisioter Pesqui. 2013;20(1):97-102. doi: 10.1590/ S1809-29502013000100016.
19. Lemos LFC, Oliveira RS, Pranke GI, Teixeira CS, Mota CB, Zenkner JEA. Sistema estomatognático postura e equilíbrio corporal. Salusvita. 2010;29(2):57-67.
20. Maturana CS, Silva LST, Gaetan ESM, Ribeiro DCL. Plantar pressure distribution in children with hemiparetic and diparetic cerebral palsy: case control study. Ter Man. 2013;11(54):481-7.
21. Tomita H, Fukaya Y, Takagi Y, Yokozawa A. Efects of severity of gross motor disability on anticipatory postural adjustments while standing in individuals with bilateral spastic cerebral palsy. Res Dev Disabil. 2016;57:92-101. doi: 10.1016/j.ridd.2016.06.017.
22. Shiratori T, Girolami GL, Aruin AS. Anticipatory postural adjustments associated with a loading perturbation in children with hemiplegic and diplegic cerebral palsy. Exp Brain Res. 2016;234(10):2967-78. doi: 10.1007/s00221-016-4699-0. 23. Saxena S, Rao BK, Kumaran S. Analysis of postural stability
in children with cerebral palsy and children with typical development: an observational study. Pediatr Phys Ther. 2014;26(3):325-30. doi: 10.1097/PEP.0000000000000060. 24. Queen RM, Mall NA, Nunley JA, Chuckpaiwong B. Diferences
in plantar loading between lat and normal feet during diferent athletic tasks. Gait Posture. 2009;29(4):582-6. doi: 10.1016/j.gaitpost.2008.12.010.
25. Fernández-Seguín LM, Diaz Mancha JA, Sánchez Rodríguez R, Escamilla Martínez E, Gómez Martín B, Ramos Ortega J. Comparison of plantar pressures and contact area between normal andcavus foot. Gait Posture. 2014;39(2):789-92. doi: 10.1016/j.gaitpost.2013.10.018.
26. Melanda AG. Alterações isiológicas do desenvolvimento infantil e suas variações. In: Tópicos em ortopedia pediátrica. Londrina: Universidade Estadual de Londrina; 2010. 25-40. 27. Tong JW, Kong PW. Medial longitudinal arch development of