29 1. Medical student, School of Medicine, Universidade Federal de Minas
Gerais (UFMG), Belo Horizonte, MG, Brazil.
2. PhD. Associate professor, Department of Pediatrics, School of Medicine, Universidade Federal de Minas Gerais (UFMG), Belo Horizonte, MG, Brazil.
Manuscript received May 05 2003, accepted for publication Sep 17 2003. Abstract
Objective: To identify factors associated with increased arterial blood pressure in children.
Methods: In this cross-sectional study, arterial blood pressure was measured in 672 children between 2 and 11 years of age from two schools in the city of Belo Horizonte, Brazil. After providing informed consent, all children had their blood pressure and anthropometric parameters measured. Blood pressure was measured based on the recommendations of the Update on the 1987 Task Force Report on High Blood Pressure in Children and Adolescents. The following variables were assessed: age, sex, race, urban life quality index, weight, height, and body mass index. Analysis of variance was used for comparison of means and the chi-square was used for comparison of proportions. Variables associated with increased blood pressure were included in a multiple regression model.
Results: According to univariate analysis, increased systolic and diastolic blood pressure were associated with high urban life quality index, white race and high body mass index. On multivariate analysis, body mass index, urban life quality index and height remained associated with increased systolic blood pressure; urban life quality index and age were associated with increased diastolic blood pressure.
Conclusion: In this study, excess weight and obesity were associated with increased systolic blood pressure. Other unidentified factors were partially associated with increased blood pressure in children from the school with elevated urban life quality index.
J Pediatr (Rio J). 2004;80(1):29-34: Risk factors, obesity, overweight, race, cross-sectional study.
Evaluation of risk factors
associated with increased blood pressure in children
Frederico D. Garcia1, Aleyson F. Terra1, Anderson M. Queiroz1, Cristiano A. Correia1,
Priscila S. Ramos1, Quésia T. Ferreira1, Regina L. Rocha2, Eduardo A. Oliveira2
Copyright © 2004 by Sociedade Brasileira de Pediatria
O
RIGINALA
RTICLEIntroduction
Blood pressure screening is an important tool in pediatric routine examination.1 The idea that hypertension in children is rare, being most times secondary to kidney diseases, has been contested in epidemiological studies, which have shown an increase in the prevalence of essential hypertension in the pediatric population.2
Pediatricians must be aware of this fact in order to help prevent cardiovascular events, since elevated blood pressure in children may be a predictor for hypertension
in adults. Several cohort studies have shown a significant correlation between elevated blood pressure in children and adolescents with hypertension in adults.3,4 Children with blood pressure levels above the 90th percentile have a 2.4 times higher risk of becoming hypertensive adults.5 Although essential hypertension is not a risk factor for cardiovascular events in childhood, cardiovascular and hemodynamic disorders may develop in the second decade of life or even earlier.6
family history of hypertension,7 obesity8 and a high body mass index.9 Some longitudinal studies show that excessive weight gain in children and low birthweight are predictors for hypertension in adults.10-12 In a longitudinal study with a 10-year follow-up, Dekkers et al.13 demonstrated that ethnic differences in the United States are independently associated with higher blood pressure levels, with a higher predominance of elevated diastolic blood pressure among black children and adolescents.
The aim of this cross-sectional study is to investigate, on a preliminary basis, the possible factors associated with elevated blood pressure in children from two schools (public and private) of Belo Horizonte, state of Minas Gerais, Brazil.
Methods
This cross-sectional study assessed children from two schools of Belo Horizonte, state of Minas Gerais, Brazil. The students in these schools came from two different regions of the city of Belo Horizonte, according to the quality of urban life (QUL). The QUL was developed by the local City Hall based on indicators such as family income, health conditions, social assistance, education, and housing conditions. Belo Horizonte was divided into six regions (class I to class VI), in decreasing order of quality of life. The public school, with 506 children, is located in a region with low QUL (QUL = 0.33, class 6). The private school, with 297 children, is located in a region with high QUL (mean QUL = 0.52, class II). The study was approved by the Research and Ethics Committee of Universidade Federal de Minas Gerais (UFMG). The inclusion criteria were the following: age 2 years to 10 years and 11 months, informed consent form signed by the parents, and proper data collection. The exclusion criteria were: children younger than two years (n = 13), those older than 10 years and 11 months (n = 102), those with hypertension (n = 4) and those whose parents did not sign the informed consent form (n = 12). A total of 627 children were assessed, 409 (61%) from the public school and 263 (39%) from the private one.
The childrens blood pressure and anthropometric parameters were measured by especially trained fifth-year medical students. Information about the childs health, family history and risk factors for hypertension was collected from the form filled out by the parents. Blood pressure was measured twice, following the parameters established by the Update on the 1987 Task Force Report on High Blood Pressure in Children and Adolescents14 Blood pressure was measured in a controlled environment in the sitting position, and a five-minute interval was allowed between the first and second blood pressure screenings.
Age and gender were considered for the body mass index (BMI). All children were classified as: normal, overweight or obese, according to Cole et al.15 The children were split into two groups according to age:
preschool children (between 2 and 6 years old) and school-aged children (between 7 and 10 years old).
The data were stored and analyzed using SPSS®. The chi-square test was used for comparison of proportions, and the analysis of variance (ANOVA) was used for comparison of the means. Multiple linear regression was used for the multivariate analysis, and the systolic and diastolic blood pressures were considered response variables. The following independent variables were studied: age, height, gender, skin color, QUL, and BMI. The methodology used in the multivariate analysis consisted of the initial inclusion of all significant variables in the univariate analysis, and backward elimination (exclusion of those variables with no significant contribution to the model). All the factors associated with elevated blood pressure, considering a significance level less than 0.25, were initially included in the multivariate analysis. After obtaining the predictive variables for the final model, we investigated the occurrence of association.
Results
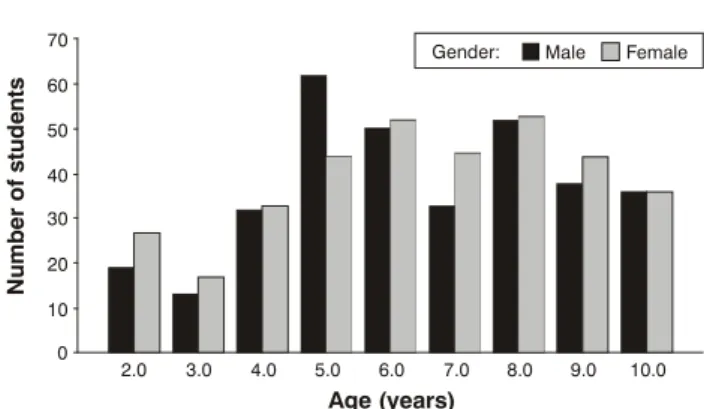
A total of 672 children, of whom 343 (51%) were female, were studied. Age ranged from 2 years to 10 years and 11 months, with a mean of 6.9 years (SD = 2.3). Of 672 children, 336 (50%) were aged from 2 to 6 years and 11 months, and 336 (50%) were aged from 7 to 10 years and 11 months. No significant age difference was found between genders (p = 0.95). Skin color was assessed in 671 (99.7%) individuals, among whom 307 (45.7%) were white and 364 (54.2%) were non-white (brown or black). Figure 1 shows the distribution of age versus gender.
There was a predominance of male children in the private school (53%) compared to the public school (46%), with a significant difference (p = 0.03). There was a remarkable difference in terms of skin color. Of 307 white students, 247 (80%) attended the private school,
Figure 1 - Distribution of the 695 children included in this study according to age and gender.
70
Male Female
60
50
40
30
20
10
0
2.0 3.0 4.0 5.0 6.0
Age (years)
N
u
m
b
e
r
o
f
s
tu
d
e
n
ts
and 348 (96%) of 364 non-white students attended the public school (p < 0.001). The BMI had the following distribution: 553 (82.3%) children showed appropriate values for age and gender; 94 (14%) were overweight and 25 (3.7%) were obese. There was a significant correlation between BMI and childs origin: of 263 children attending the private school, 62 (23.5%) were overweight or obese, while 57 (14%) of 409 children attending the public school were overweight or obese (p = 0.001). There also was an association between white individuals and a high BMI. Of 307 white children, 66 (21.5%) were overweight or obese; of 364 non-white children, 53 (14.5%) were overweight or obese (p = 0.013).
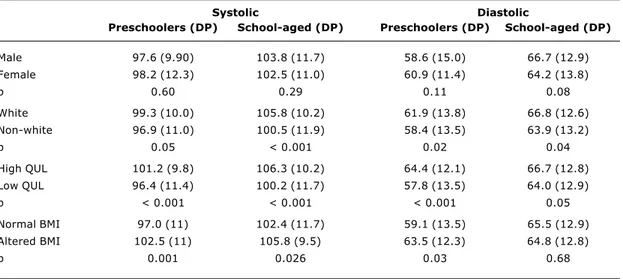
In the univariate analysis of risk factors for elevated blood pressure the following were included: gender, skin color, QUL, and BMI. Table 1 shows the comparisons between the mean values of systolic and diastolic blood pressures and the analyzed risk factors. Children were stratified according to age (preschool children and school-aged children). The levels of systolic blood pressure were significantly higher in white children, in children from the school with a high QUL and in children with a high BMI, regardless of age. No significant difference was observed between genders. The levels of diastolic blood pressure were significantly higher in white children and in children from the school with a high QUL, regardless of age. The children with a high BMI only showed higher diastolic blood pressure levels at the preschool age. There was no significant difference between genders as to diastolic blood pressure.
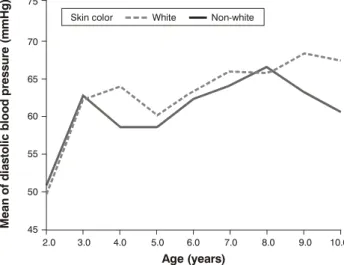
Figures 2 and 3 show the differences in the levels of systolic and diastolic blood pressure in white and non-white children. We may observe that the levels of systolic and diastolic blood pressure are persistently higher in white children, especially after the age of four years.
Figure 4 shows that there was a significant increase in systolic blood pressure with the increase in BMI. However, this association was not observed for the diastolic blood pressure; obese children had lower diastolic blood pressure levels.
A multiple linear regression model was developed for the identification of variables independently associated with higher blood pressure levels. In this case, the variables associated with higher levels of blood pressure were included, in addition to the childs height. The results for systolic and diastolic blood pressure are shown in Tables 2 and 3, respectively. In the model for systolic blood pressure, three variables were statistically
Table 1 - Comparison of the means of systolic and diastolic blood pressure in children classified by age according to gender, skin color, QUL and BMI
Systolic Diastolic
Preschoolers (DP) School-aged (DP) Preschoolers (DP) School-aged (DP)
Male 97.6 (9.90) 103.8 (11.7) 58.6 (15.0) 66.7 (12.9)
Female 98.2 (12.3) 102.5 (11.0) 60.9 (11.4) 64.2 (13.8)
p 0.60 0.29 0.11 0.08
White 99.3 (10.0) 105.8 (10.2) 61.9 (13.8) 66.8 (12.6)
Non-white 96.9 (11.0) 100.5 (11.9) 58.4 (13.5) 63.9 (13.2)
p 0.05 < 0.001 0.02 0.04
High QUL 101.2 (9.8) 106.3 (10.2) 64.4 (12.1) 66.7 (12.8)
Low QUL 96.4 (11.4) 100.2 (11.7) 57.8 (13.5) 64.0 (12.9)
p < 0.001 < 0.001 < 0.001 0.05
Normal BMI 97.0 (11) 102.4 (11.7) 59.1 (13.5) 65.5 (12.9)
Altered BMI 102.5 (11) 105.8 (9.5) 63.5 (12.3) 64.8 (12.8)
p 0.001 0.026 0.03 0.68
Figure 2 - Means of systolic blood pressure in white and non-white children according to age.
2.0 80
Skin color: White Non-white
90 100 110 120
3.0 4.0 5.0 6.0
Age (years)
M
e
a
n
o
f
s
y
s
to
li
c
b
lo
o
d
p
re
s
s
u
re
(
m
m
H
g
)
significant: BMI, QUL, and height. No correlation was observed between these variables. Two variables were statistically significant in the model for diastolic pressure: age and QUL. No correlation was observed between these variables. Skin color was not independently associated with blood pressure levels in both models.
Discussion
The present study is a cross-sectional analysis of blood pressure in students from two schools of Belo Horizonte. The sample was not randomly selected.
Although the number of students analyzed in our study is representative, there might have been a selection bias, which is inherent to samples that are not randomly selected. In spite of this, a few findings require some comments and may contribute to the development of prospective studies especially designed to identify groups at risk for elevated blood pressure in the pediatric population.
In our study, the higher levels of systolic and diastolic blood pressure in the univariate analysis were significantly associated with white children, children from the region with a high QUL and those with a high BMI. The multiple linear regression analysis of blood pressure showed that skin color does not explain this finding and, therefore, this variable was excluded from the model. Despite the association of high BMI with the children from the private school, the multivariate analysis revealed that both variables were significant, partially explaining the higher levels of systolic blood pressure in these children. In other words, a high BMI was not solely responsible for higher systolic blood pressure levels. With regard to diastolic blood pressure, only QUL and age were maintained in the model after being adjusted. Skin color, gender, and BMI were not independently associated with higher diastolic blood pressure levels.
Although BMI was strongly associated with elevated blood pressure in our study, other factors have to be identified and evaluated. Obviously, QUL represents the social background of the studied population. We may infer
Figure 3 - Means of diastolic blood pressure in white and non-white children according to age.
2.0 45 50 60
55 70
65 75
3.0 4.0 5.0 6.0
Age (years)
M
e
a
n
o
f
d
ia
s
to
li
c
b
lo
o
d
p
re
s
s
u
re
(
m
m
H
g
)
7.0 8.0 9.0 10.0 Skin color White Non-white
Figure 4 - Mean and standard deviation of systolic and diastolic blood pressure according to BMI.
120
110
100
90
80
70
60
50
normal overweight
Body mass index
obesity
B
lo
o
d
p
re
s
s
u
re
(
m
m
H
g
)
+
2
S
D
Blood pressure: systolic diastolic
Table 2 - Linear regression model of systolic blood pressure including three variables: age, height, QUL, BMI and skin color*
Systolic pressure Beta Standard error T p
Constant 72.200 3.280 22.010 < 0.001
BMI 3.022 1.112 2.718 0.007
QUL 4.168 0.909 4.587 < 0.001
Height 0.158 0.028 5.640 < 0.001
* Skin color (p = 0.82) and age (p = 0.60) were excluded from the model since they do not present significant association with the dependent variable.
* Skin color (0.74), height (p = 0.65), gender (p = 0.64) and BMI (p = 0.54) were sequentially excluded from the model since they do not present significant association with the dependent variable.
Table 3 - Linear regression model of diastolic blood pressure including four variables: age, height, QUL, BMI, skin color and gender*
Diastolic pressure Beta Standard error T p
Constant 49.162 1.932 25.446 < 0.001
QUL 4.113 1.058 3.888 < 0.001
that other factors associated with lifestyle, nutrition, and environment may have contributed to the consistently higher blood pressure values in children from regions with a high QUL.
Some risk factors assessed in our study have been associated with elevated blood pressure. Longitudinal studies with adults have shown that excessive weight gain is strongly associated with the risk for cardiovascular diseases.16-18 It also has been acknowledged that the roots of cardiovascular events in adults extend back to childhood.19,20 Recently, Sinaiko et al.21 in a prospective study with serial blood pressure screenings and anthropometric measurements of 679 children followed up to the age of 23 years, demonstrated that weight gain and an increase in BMI during childhood were significantly associated with the levels of insulin, lipids and blood pressure of young adults. He et al.,22 in a matching study (one obese and one nonobese child) with 1,322 Chinese children, showed that the mean difference between pairs was of approximately 5 mmHg for systolic blood pressure and 4 mmHg for diastolic blood pressure, with the highest levels among obese children. Among obese children, 19.4% had a blood pressure above the 95th percentile against 7% in children with an appropriate BMI. Rosner et al.23 carried out a multicenter study in the United States and assessed the differences in blood pressure of children and adolescents by taking into consideration skin color and BMI. The authors showed that white children had elevated levels of systolic blood pressure. When the role of BMI was analyzed, higher BMI resulted in higher blood pressure levels in all groups. However, BMI seemed to have a major effect on the systolic blood pressure of white male children.
Some studies have demonstrated that the clinical course of hypertension in obese children is characterized by the predominance of isolated systolic hypertension. In a recent surveillance study on hypertension and obesity in schoolchildren, Sorof et al.9 revealed a prevalence of 94% for isolated systolic hypertension among adolescents. The pathophysiological mechanisms associated with isolated systolic hypertension are still unknown; therefore, more research is needed to investigate the causes and the best approach to these patients.2
Altogether, these data show that overweight and obesity have possibly played a deleterious role in the cardiovascular system since childhood. Recently, Sorof & Daniels2 underscored the importance of obesity-induced hypertension in children and adolescents and the epidemic proportion of this disease . Obesity is the most common nutritional disorder in children in industrialized countries. Many of the obesity-related events that typically affect adults, such as hypertension, type 2 diabetes, dyslipidemia, left ventricle hypertrophy, hepatic steatosis, among others, have already been described in the pediatric population. In the last 50 years, thanks to clinical and epidemiological studies that identified the risk factors involved in cardiovascular diseases, the morbidity and mortality
attributed to these conditions have decreased. The increase in the prevalence and severity of obesity among children and adolescents is quite worrying, since it might change the current situation and compromise the results of all studies carried out in the last few years.24
Even though our study presents some limitations, it stresses the important role of pediatricians in monitoring blood pressure in children as a routine practice for the early detection of risk factors for overweight and obesity, which allows for the prevention of cardiovascular events in the future. This approach is still overlooked in our setting. By evaluating blood pressure in schoolchildren in Belo Horizonte, Oliveira et al.25 showed that less than 50% of study participants (mean age = 11.5 years) had already had their blood pressure screened at least once. This fact shows us the necessity to establish blood pressure screening as part of every pediatric examination. Also, longitudinal multicenter studies, including regular blood pressure screenings, should be conducted in our setting with the aim of identifying other factors that may be implicated in the etiology of elevated blood pressure in the pediatric population.
References
1. Sinaiko AR. Hypertension in children. N Engl J Med. 1996;335:1968-73.
2. Sorof J, Daniels S. Obesity hypertension in children: a problem of epidemic proportions. Hypertension. 2002;40:441-7. 3. Bao W, Threefoot SA, Srinivasan SR, Berenson GS. Essential
hypertension predicted by tracking of elevated blood pressure from childhood to adulthood: The Bogalusa Heart Study. Am J Hypertens. 1995;8:657-65.
4. Cook NR, Gillman MW, Rosner BA, Taylor JO, Hennekens CH. Prediction of young adult blood pressure from childhood blood pressure, height, and weight. J Clin Epidemiol. 1997;50:571-9. 5. Mahoney LT, Clarke WR, Burns TL, Lauer RM. Childhood predictors
of high blood pressure. Am J Hypertens. 1991;4:S608-10. 6. Daniels SR. Cardiovascular sequelae of childhood hypertension.
Am J Hypertens. 2002;15(2 Pt 2):S61-3.
7. Munger RG, Prineas RJ, Gomez-Marin O. Persistent elevation of blood pressure among children with a family history of hypertension: The Minneapolis Childrens Blood Pressure Study. J Hypertens. 1988;6:647-53.
8. Lauer RM, Burns TL, Clarke WR, Mahoney LT. Childhood predictors of future blood pressure. Hypertension. 1991;18:i74-81. 9. Sorof JM, Poffenbarger T, Franco K, Bernard L, Portman RJ.
Isolated systolic hypertension, obesity, and hyperkinetic hemodynamic states in children. J Pediatr. 2002;140:660-6. 10. Yiu V, Buka S, Zurakowski D, McCormick M, Brenner B, Jabs K.
Relationship between birthweight and blood pressure in childhood. Am J Kidney Dis. 1999;33:253-60.
11. Eriksson J, Forsen T, Ttuomilehto J, Osmond C, Barker D. Fetal and childhood growth and hypertension in adult life. Hypertension. 2000;36:790-4.
12. Law CM, Shiell AW, Newsome CA, et al. Fetal, infant, and childhood growth and adult blood pressure: a longitudinal study from birth to 22 years of age. Circulation. 2002;105:1088-92. 13. Dekkers JC, Snieder H, Van Den Oord EJ, Treiber FA. Moderators of blood pressure development from childhood to adulthood: a 10-year longitudinal study. J Pediatr. 2002;141:770-9. 14. Update on the 1987 Task Force Report on High Blood Pressure
15. Cole TJ, Bellizzi MC, Flegal KM, Dietz WH. Establishing a standard definition for child overweight and obesity worldwide: international survey. BMJ. 2000;320:1240-3.
16. Hubert HB, Feinleib M, McNamara PM, Castelli WP. Obesity as an independent risk factor for cardiovascular disease: a 26- year follow-up of participants in the Framingham heart study. Circulation. 1983;67:968-77.
17. Kannel WB, DAgostino RB, Cobb JL. Effect of weight on cardiovascular disease. Am J Clin Nutr. 1996;63 Suppl3:S419-22. 18. Rexrode KM, Manson JE, Hennekens CH. Obesity and
cardiovascular disease. Curr Opin Cardiol. 1996;11:490-5. 19. Dietz WH, Franks AL, Marks JS. The obesity problem. N Engl J
Med. 1998;338:1157-8.
20. Dietz WH. Health consequences of obesity in youth: childhood predictors of adult disease. Pediatrics. 1998;101:518-25. 21. Sinaiko AR, Donahue RP, Jacobs DR Jr, Prineas RJ. Relation of
weight and rate of increase in weight during childhood and adolescence to body size, blood pressure, fasting insulin, and lipids in young adults. The Minneapolis Childrens Blood Pressure Study. Circulation. 1999;99:1471-6.
22. He Q, Ding ZY, Fong DY, Karlberg J. Blood pressure is associated with body mass index in both normal and obese children. Hypertension. 2000;36:165-70.
Corresponding author: Eduardo A. Oliveira Rua Patagônia, 515/701
CEP 30320-080 Belo Horizonte, MG, Brazil E-mail: [email protected] Fax: +55 (31) 224.3088
23. Rosner B, Prineas R, Daniels SR, Loggie J. Blood pressure differences between blacks and whites in relation to body size among US children and adolescents. Am J Epidemiol. 2000;151:1007-19.
24. Daniels SR. Is there an epidemic of cardiovascular disease on the horizon? J Pediatr. 1999;134:665-6.