1
Journal Impact Factors for the year-after the next can be
objectively predicted
Mauricio Rocha-e-Silva
DOI: 10.5935/MedicalExpress.2016.05.06
BRIEF COMMUNICATION
University of São Paulo, São Paulo, Brazil
OBJECTIVE: To determine whether trends of Journal Impact factor variation can be objectively predicted for the year after next.
METHOD: Curves for citations/document have been constructed for articles published in the two years previous to the current year (YEAR–1 and YEAR–2) and their citations in the current (uninished year). Separate curves were constructed for YEAR–1 and YEAR–2. A parameter named INDEX R has been deined. INDEX R was calculated for a randomly selected sample of 100 journals with Impact Factors in the 1 - 3 range.
RESULTS: INDEX R was found to distribute in a quasi-normal manner, with a borderline adherence to the Gauss distribution (0.10 > p > 0.05). A mean value of 0.60 ± 0.19 was observed.
CONCLUSION: As a working hypothesis, it is suggested that INDEX R may indicate a trend for the Impact Factor to occur for the year-after (2017), to be published in the summer of 2018.
KEYWORDS: Impact Factor, bibliometrics, future trends.
Rocha-e-Silva M. Journal Impact Factors for the year-after the next can be objectively predicted. MedicalExpress (São Paulo, online). 2016:M160506
Received for Publication on October 13, 2016; First review on October 20, 2016; Accepted for publication on October 20, 2016; Online on October 31, 2016
E-mail: [email protected]
■
INTRODUCTIONIn spite of objections frequently raised concerning Journal Impact Factor as a measure of quality, it is still true that, no matter how severely it is criticized, it has become, for many journal Editors, a “cannot-live-without” sort of talisman. Irrespective of whether it is a good or a bad thing, whether it is tampered with or not, it must be seen as a pandemic affliction, affecting the world of scientific editing. I do not intend to discuss Impact Factor merits or demerits. This communication is about a concept that may be helpful in predicting not merely next year’s Impact Factor, a procedure often described in the past. To the best of my knowledge it has never been previously described. The new idea is a device that may be potentially useful to detect Impact Factor trends in the year-after the next.
Generally speaking, journals have fairly steady Impact Factors over time, so that long term future trends are easy to envisage. On rare occasions, a journal may
Copyright © 2016 MEDICALEXPRESS. This is an open access article distributed under the terms of the creative commons attribution Non-Commercial License (creativecommons.org/licenses/by-nc/4.0/) which permits unrestricted non commercial use, distribution and reproduction in any medium, provided the original work is properly cited.
present legitimately aberrant years, usually caused by an outlier article with an unusually large number of citations. The most famous recent example was Sheldrick, 2008,1
which has been cited more than 50,000 times to date. Less than 100 articles in the entire range of published scientific articles (1900 – 2010, over 30 million articles) come even close to this.2 In other occasions, an Editor may
wish to detect whether his present policies of acceptance/ rejection of papers may have positive or negative effects on the quality of the journal. Even though Impact Factor and equivalent citation-based metrics may have flaws, there is little question that citations per se are a definite measure of the interest generated by articles, and therefore must be seen as reflections of quality. Editors must keep in mind the fact that editorial actions performed in the current year will influence Impact Factors to be divulged 3 – 4 years later.
2
MedicalExpress (Sao Paulo, online) 2016: M160506
Predicting Journal Impact Factors Rocha-e-Silva M
■
PREDICTING THE NEXT IMPACT FACTOR (2016)Predicting the next Impact Factor is a well-established procedure: a number of studies have described how it is done.3,4 To put all of this into perspective, I will to take one step at a time. I will only use one method, namely the gathering of information from Web of Science (WoS) releases.5
In the summer of 2017, Journal Citation Index (JCR) will publish Impact Factors for 2016. Let us begin by looking at the scenario as it will occur on March 31, 2017. By then, practically all the information required to calculate the IF will have been collected; Web of Science transparently provides it to all users:5 for any given journal “X” the Impact
Factor can be estimated through the standard IF procedure: Estimated IF2016 = Cites2016/(N2014 + N2015)
where
N2014 and N2015: number of citable documents
(research articles and reviews) published by “X” in 2014 and 2015, respectively
Cites: number of citations granted in 2016 to all articles published by “X” in 2014 and 2015.
However, this is still not quite the Impact Factor that will be formally released by JCR. The release will be preceded by a search through the Web of Science database looking for mistakes and missed citations.6 Missed citations
are usually more numerous than mistakes; consequently, the Impact Factor estimated in March will usually be slightly lower than the posted value.
Could this have been predicted earlier? Definitely yes and this has already been described.3,4 If we move backward in time, we will see that meaningful information was already being made available by WoS throughout 2016: at any date along this year, you could have gone to WoS and recorded a value for CITES2016 up to that date; N2014 and N2015 were already definitive values and CITES are systematically updated by WoS on a weekly basis. An interim cites/ document “race” can be constructed by visiting WoS on a weekly basis, checking for citations and calculating an interim Cites/document for each week:
Interim cites/document = CITESto-date/(N2014 + N2015) If you happen to be a tennis fan, this would look very much like the ATP “Race to London”, London being the venue of the end-of-year tennis tournament, by invitation only.
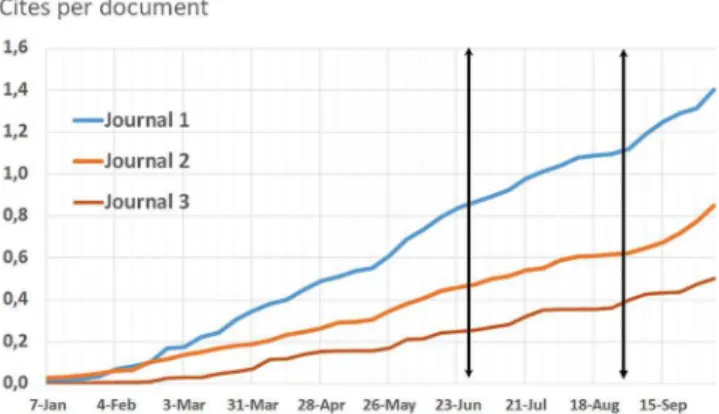
Figure 1 shows this Impact Factor “race” for three journals (their recent Impact Factors were 2.5, 1.7, 1.1, respectively) as it developed from January to October. By mid-March, you could already tell the difference between them. As the year progresses, these differences become more evident. I have selected and marked two strategic moments along the “race”: end of June and end of August. Pilot tests for previous years strongly suggest that at these dates, journals average 30% and 50%, respectively, of what their posted Impact Factors will be. To the best of my knowledge, this specific indication has never been explicitly suggested. I offer it as a working hypothesis.
Figure 1 - The weekly progress of cites/document for three journals with recent impact
factors of 2.5, 1.7 and 1.1. Two vertical lines mark the mid-year and the end of August. These provide indications for rapid estimation of the Impact Factor, as discussed in text.
As shown in Figure 1, by midyear cites/document reach only 30% of final value. Only well in to the 2nd
semester, on August 31st do we see cites/document reaching
50% of their respective final values. There are two reasons for this lag:
(a) unlike the tennis “race for London”, the IF “race” only really gets going a few weeks after January 1st; before
any citation can be displayed, journal issues for the new year must be published and picked up by Web of Science;
(b) when the “race” starts, papers from 2015 (YEAR–1) are on average six months old, while those from 2014 (YEAR-2) average 18 months. Six months is probably
the minimum lag between an article being published and its first citations landing in Web of Science. Consequently, early in the new year papers published in 2015 (YEAR–1) contribute very little to the race. Data for the distribution of CITES between YEAR–1 and YEAR–2 can be retrieved from the Journal Citations Report site; they show that, almost invariably, papers published in YEAR–2 are more cited than those from YEAR–1. This is central to the argument that follows.
To conclude this item on predicting the “next” Impact Factor, the procedure is well established and extensively used by Editors. It is also useful for Editors hoping to insert journals into the Science Citation Index database. The new concept here is the marking of specific points in the race, from which easy calculations can predict the coming IF with some confidence.
■
PREDICTING FUTURE IMPACT: THE YEAR AFTER3
MedicalExpress (Sao Paulo, online) 2016: M160506 Predicting Journal Impact Factors
Rocha-e-Silva M
published. Consequently, any exact numerical predictions is impossible. However, I will try to show that specific trends can be objectively estimated for any given journal.
To do this, I took advantage of the well-known fact,
already mentioned, that citations to YEAR–1 papers are
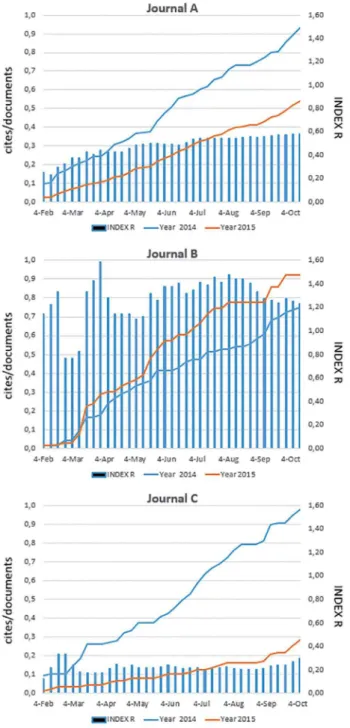
normally less numerous than those to YEAR–2 papers. Figure 2 has been constructed for three journals by splitting the citations “race” into YEAR–2 and YEAR–1. The journals have been deliberately selected to illustrate three distinct scenarios.
Figure 2 - Constructed curves of cites/document for three journals (previously
pu-blished Impact Factors 2.5, 1.7, 1.1) for the period January 1st to Ocotebr 4th. For each
journal a separate curve was constructed for 2014 (YEAR–2) and 2015 (YEAR–1). Vertical bars indicate calculated INDEX R values from April to October.
For Journal A, citations to YEAR–2 papers are consistently higher than those to YEAR–1: the ratio YEAR–1/ YEAR–2 is also displayed and tends to remain stable throughout the year, ending at 0.56; in contrast, for Journal B, YEAR–1 papers are consistently more frequently cited than YEAR–2 papers; the corresponding ratio averaged 1.30. Journal C shows a third possible pattern, with an extremely low YEAR–1/YEAR–2 ratio of 0.28. Supposing that Journal A represents the normal pattern, i.e., a pattern leading to a steady IF, it follows that Journal B is over performing in YEAR–1, and that this should lead to an increment of IF for 2017; the opposite is true for Journal C, which appears to be heading toward a decreased Impact Factor. For simplicity, I am defining a parameter:
INDEX R = {cites/doc to YEAR–1 articles}/{cites/doc to YEAR–2 articles}
But a question begs to be answered: is Journal A really representative of anything that can be described as the “usual” pattern? Figure 3 shows the distribution of INDEX R for 100 randomly selected journals: the overall mean ± std. dev. was 0.60 ± 0.19. The distribution was found to adhere to the Gaussian distribution (χ2 = 10.1; 10 > p >
0.05). There is a small central tendency, with an equally slight skew toward higher values. However, it should be noted that this is a small sample coming from a restricted range of Impact Factors (1.00 to 3.00).
Figure 3 - Frequency distribution of INDEX R for 100 randomly selected journals within
an Impact factor range of 1 - 3. The distribution adheres to the Gauss distribution with a borderline level of non-signiicance (Chi squared (5 df ) = 10.06. 010 > p > 0.05). The mean value for this population was 0.60 ± 0.19, There is an above normal central tendency, with a slight skew toward higher values.
4
MedicalExpress (Sao Paulo, online) 2016: M160506
Predicting Journal Impact Factors Rocha-e-Silva M
The entire subject is highly debatable and open to further verification and alternative explanations; the theme will be the object of future notes.
■
CONFLICT OF INTERESTNone.
PREDIZENDO FATORES DE IMPACTO: O ANO SEGUINTE PODE SER OBJETIVAMENTE AVALIADO
OBJETIVO: Determinar se tendências de variação Fator Impacto podem ser objetivamente definidas para o ano seguinte ao ano corrente.
MÉTODO: Curvas para citações/documento
foram construídas para artigos publicados nos dois anos anteriores ao ano em curso (ANO-1 e ANO-2) e suas citações
no ano corrente (Janeiro a Outubro). Curvas separadas forma construídas para cada ano. Um parâmetro designado ÍNDICE R foi definido e calculado para uma amostra aleatória de 100 revistas com Fatores de Impacto entre 1 e 3.
RESULTADOS: O ÍNDICE R distribui-se de forma normal, com aderência limítrofe à distribuição de Gauss. Observou-se um valor médio para ÍNDICE R = 0,60 ± 0,19.
CONCLUSÃO: Como hipótese de trabalho, sugere-se que o ÍNDICE R pode indicar uma tendência futura do Fator de Impacto.
PALAVRAS-CHAVE: fator de impacto, bibliometria, tendências futuras.
■
REFERENCES1. Sheldrick GM. A short history of SHELX. Acta Crystallographica Section A. 2008;64(1):112-22. http://dx.doi.org/10.1107/ S0108767307043930
2. Garfield E. The Agony and the Ecstasy—The History and Meaning of the Journal Impact Factor. International Congress on Peer Review And Biomedical Publication Chicago, September 16, 2005.
3. Ketcham KM. Predicting impact factor one year in advance. Laboratory Investigation (2007) 87, 520–526. http://dx.doi.org/10.1038/ labinvest.3700554.
4. Wu XF, Fu Q, Rousseau R. On indexing in the Web of Science and predicting journal impact factor. J Zhejiang Univ Sci B. 2008 Jul; 9(7): 582–590. http://dx.doi.org/10.1631/jzus.B0840001.
5. Retrieved from Web of Science in October 10, 2016. http://apps. webofknowledge.com/WOS_GeneralSearch_input.do?product=WOS &SID=1B6YChmO4fbjiklD65f&search_mode=GeneralSearch 6. Pendlebury DA. Thomson Scientific Corrects Inaccuracies in Editorial.